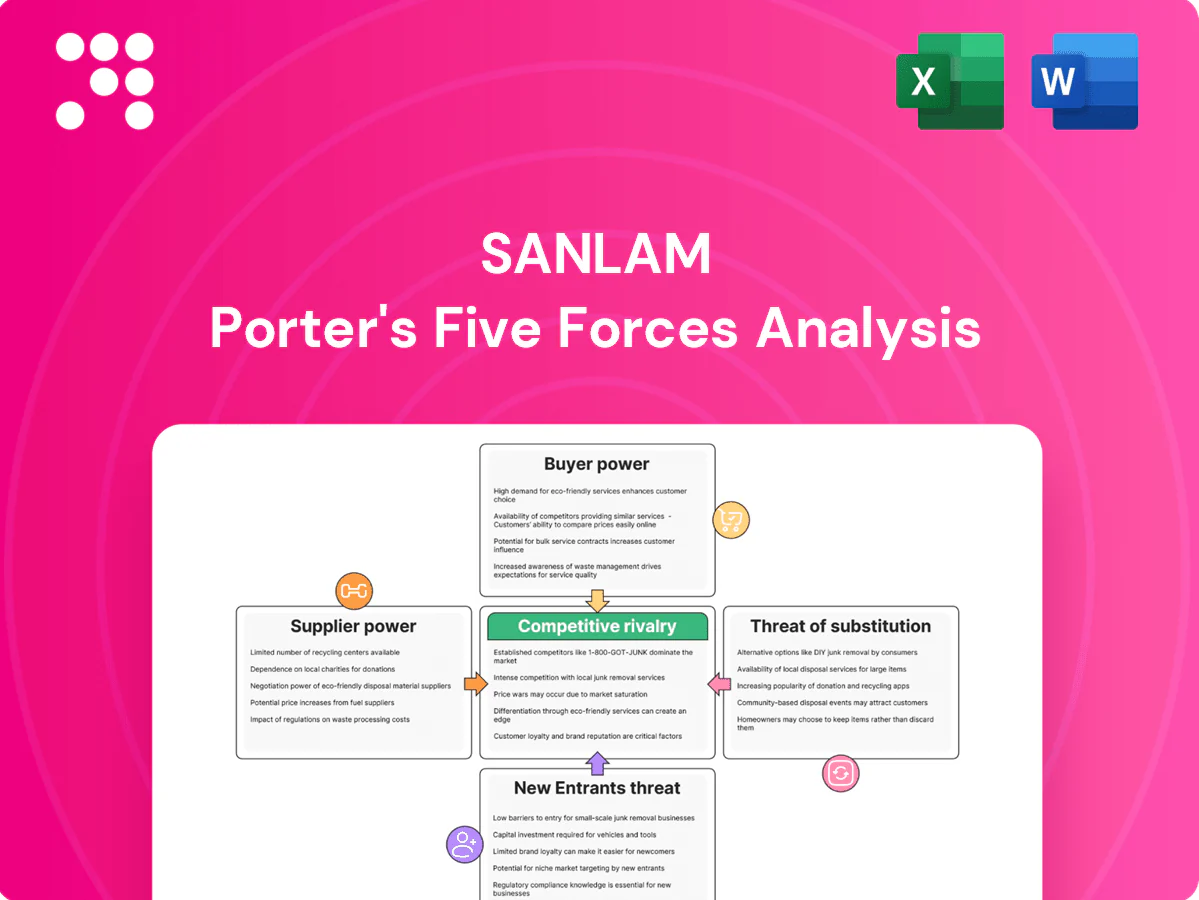
Sanlam Porter's Five Forces Analysis

Elevate Your Analysis with the Complete Porter's Five Forces Analysis
Sanlam faces evolving competitive dynamics across insurance, wealth and asset management, with shifting buyer power, regulatory pressure and digital disruption shaping margins and growth prospects. This brief snapshot only scratches the surface. Unlock the full Porter's Five Forces Analysis to explore Sanlam’s competitive dynamics, market pressures, and strategic advantages in detail.
Suppliers Bargaining Power

Concentrated reinsurers
Global reinsurance remains concentrated among a handful of major players, giving them pricing power that tightened further after the catastrophe-heavy 2023 season and kept 2024 renewals firm. Capacity cycles in 2024 elevated Sanlam’s cost of risk transfer, though long-term treaties and Sanlam’s scale helped blunt rate increases. Broadening reinsurer panels and leveraging the SanlamAllianz footprint can secure better terms and capacity.
Critical tech and data vendors
Core policy admin, cloud and cybersecurity vendors are highly specialized and sticky, giving suppliers strong leverage over insurers like Sanlam due to deep integration and domain expertise.
Switching costs and integration risks further elevate vendor power, while cloud market concentration (AWS ~32%, Microsoft Azure ~23%, Google ~11% per Synergy Research 2024) underscores dependency on a few providers.
Volume commitments, multi-vendor strategies, in-house builds and adoption of open architectures can materially rebalance negotiating power and reduce single-vendor risk.

Distribution partners as quasi-suppliers
Banks, brokers and IFAs control access to high‑value clients and extract commission and shelf‑space fees that give them strong bargaining clout, particularly in bancassurance channels where partners drive a large share of flows; Sanlam reported group AUM of about R1.05 trillion and bancassurance remains material to retail inflows in 2024. Sanlam’s proprietary adviser network and expanding digital channels reduce dependency, while co‑created products and JV bancassurance align incentives and share margins.

Scarce actuarial and analytics talent
Experienced actuaries, data scientists and risk specialists are scarce across emerging markets, driving wage inflation and poaching that raise input costs for Sanlam. Sanlam’s training pipelines and employer value proposition have improved retention, while strategic hubs and automation reduce reliance on scarce senior hires and lower marginal analytics costs.
- Supply pressure: scarce senior actuarial and analytics talent
- Cost impact: wage inflation and poaching increase input costs
- Mitigants: training pipelines, EVP, strategic hubs and automation
Capital and market liquidity
Sanlam faces supplier power in capital and market liquidity as investment markets and debt providers determine returns and solvency capital; AUM c. R1.1tn (2024) and robust liquidity buffers help absorb shocks. Tight credit cycles and spread volatility in 2023–24 pushed corporate funding costs higher, while strong group balance sheet and ALM discipline reduce reliance on expensive external capital.
- c. R1.1tn AUM (2024)
- Robust liquidity buffers and capital above regulatory minima
- Spread volatility raised funding costs in 2023–24
- ALM limits dependency on costly capital
Reinsurer squeeze raises transfer costs; expand panels; cloud leader 32%
Reinsurer concentration and firm 2024 renewals raised Sanlam’s transfer costs despite treaty scale; expanding panels and SanlamAllianz leverage can improve terms. Cloud and core vendors are sticky (AWS ~32%, Azure ~23%, Google ~11% Synergy Research 2024), raising switching costs. Bancassurance and IFAs retain distribution power though Sanlam’s adviser network and digital channels reduce dependency.
| Metric | 2024 |
|---|---|
| Group AUM | c. R1.1tn |
| AWS/Azure/Google share | 32%/23%/11% |
| Reinsurance pressure | Firm 2024 renewals |
What is included in the product
 Detailed Word Document
Tailored exclusively for Sanlam, this Porter’s Five Forces analysis uncovers key drivers of competition, buyer and supplier influence, entry barriers and substitute threats, highlighting disruptive forces and strategic levers that affect pricing, profitability and market share.

 Customizable Excel Spreadsheet
One-page Sanlam Porter's Five Forces snapshot clarifies competitive pressures for fast, board-ready decisions; customizable scores let you model shifts from regulation or new entrants. Clean spider chart and copy-ready layout plug into decks or Excel dashboards—no complex setup required.
Customers Bargaining Power

Price-sensitive retail clients
Price-sensitive retail clients increasingly comparison-shop premiums and fees across digital platforms; in 2024 roughly 60% of South African retail insurance buyers consulted online quotes before purchasing. Transparent fee and commission disclosures have amplified price pressure on margins. Sanlam’s brand trust and bundled wealth-management offerings, plus loyalty programs and rewards, improve retention and reduce pure price-driven churn.
Corporate and institutional buyers
Corporate and institutional buyers, notably employers with >1,000 employees and major pension funds, negotiate aggressively on group risk and mandates, pressuring margins as RFP processes commoditize offerings. Sanlam, as one of South Africa's top-five insurers, defends pricing through custom design, strict service SLAs and outcomes-based pricing. Cross-selling across risk, pensions and investments raises client switching costs and supports retention.

Intermediary-driven bargaining
Brokers and IFAs aggregate demand and routinely pit carriers against each other, exerting commission leverage that can squeeze carrier economics. Sanlam’s omni-channel model and direct-to-consumer options reduce reliance on intermediaries and lower margin exposure. Sanlam reported roughly R1.15 trillion assets under management at 31 December 2024, enabling data-driven lead allocation that strengthens its negotiating position with brokers.

Switching and lapse dynamics
Surrender penalties and underwriting friction keep life-policy switching moderate, while general insurance and asset management exhibit easier portability; Sanlam 2024 data show lapse-related outflows contained versus peers. Superior claims handling and digital UX have lowered churn, with industry studies in 2024 reporting up to 20% lower attrition for digital leaders. Proactive retention analytics curb lapse spikes through targeted interventions.
- Life: moderate switching (surrender friction)
- GI/AM: higher portability
- Digital/claims: ~20% lower churn (2024)
- Retention analytics: reduces lapse volatility
Regulatory empowerment
Regulatory empowerment via conduct rules and fee caps in South Africa strengthens customer protection and makes price-performance trade-offs clearer; standardized disclosures since the 2023 FSCA guidance have increased comparability, raising customer switching propensity. Sanlam, with reported group AUM of about ZAR 1.1 trillion as at 31 Dec 2024, gains if clients prioritize quality and solvency, while weaker providers face higher churn and margin pressure.
- Regulation: conduct rules + fee caps
- Disclosure: standardized, higher comparability
- Sanlam: ~ZAR 1.1 trillion AUM (31 Dec 2024)
- Impact: quality/solvency valued → retention; poor performers → churn
Customers push prices: ~60% online quotes, AUM ZAR 1.15tr, digital cuts churn ~20%
Customers exert rising price pressure as ~60% of SA retail buyers used online quotes in 2024; corporate RFPs compress margins. Brokers retain leverage but Sanlam’s direct channels and cross-sell (AUM ~ZAR1.15tr at 31‑12‑2024) raise switching costs. Digital claims and retention analytics cut churn ~20% for leaders.
| Metric | 2024 |
|---|---|
| Retail online quoting | ~60% |
| Sanlam AUM | ZAR 1.15tr |
| Churn reduction (digital) | ~20% |
Same Document Delivered
Sanlam Porter's Five Forces Analysis
This preview shows the exact Sanlam Porter's Five Forces Analysis you'll receive immediately after purchase—no placeholders or omissions. The document displayed here is the professionally formatted, full analysis ready for download and use the moment you buy. What you see is the final deliverable and will be available to you instantly after payment.

Elevate Your Analysis with the Complete Porter's Five Forces Analysis
Sanlam faces evolving competitive dynamics across insurance, wealth and asset management, with shifting buyer power, regulatory pressure and digital disruption shaping margins and growth prospects. This brief snapshot only scratches the surface. Unlock the full Porter's Five Forces Analysis to explore Sanlam’s competitive dynamics, market pressures, and strategic advantages in detail.
Suppliers Bargaining Power
Concentrated reinsurers
Global reinsurance remains concentrated among a handful of major players, giving them pricing power that tightened further after the catastrophe-heavy 2023 season and kept 2024 renewals firm. Capacity cycles in 2024 elevated Sanlam’s cost of risk transfer, though long-term treaties and Sanlam’s scale helped blunt rate increases. Broadening reinsurer panels and leveraging the SanlamAllianz footprint can secure better terms and capacity.
Critical tech and data vendors
Core policy admin, cloud and cybersecurity vendors are highly specialized and sticky, giving suppliers strong leverage over insurers like Sanlam due to deep integration and domain expertise.
Switching costs and integration risks further elevate vendor power, while cloud market concentration (AWS ~32%, Microsoft Azure ~23%, Google ~11% per Synergy Research 2024) underscores dependency on a few providers.
Volume commitments, multi-vendor strategies, in-house builds and adoption of open architectures can materially rebalance negotiating power and reduce single-vendor risk.
Distribution partners as quasi-suppliers
Banks, brokers and IFAs control access to high‑value clients and extract commission and shelf‑space fees that give them strong bargaining clout, particularly in bancassurance channels where partners drive a large share of flows; Sanlam reported group AUM of about R1.05 trillion and bancassurance remains material to retail inflows in 2024. Sanlam’s proprietary adviser network and expanding digital channels reduce dependency, while co‑created products and JV bancassurance align incentives and share margins.
Scarce actuarial and analytics talent
Experienced actuaries, data scientists and risk specialists are scarce across emerging markets, driving wage inflation and poaching that raise input costs for Sanlam. Sanlam’s training pipelines and employer value proposition have improved retention, while strategic hubs and automation reduce reliance on scarce senior hires and lower marginal analytics costs.
- Supply pressure: scarce senior actuarial and analytics talent
- Cost impact: wage inflation and poaching increase input costs
- Mitigants: training pipelines, EVP, strategic hubs and automation
Capital and market liquidity
Sanlam faces supplier power in capital and market liquidity as investment markets and debt providers determine returns and solvency capital; AUM c. R1.1tn (2024) and robust liquidity buffers help absorb shocks. Tight credit cycles and spread volatility in 2023–24 pushed corporate funding costs higher, while strong group balance sheet and ALM discipline reduce reliance on expensive external capital.
- c. R1.1tn AUM (2024)
- Robust liquidity buffers and capital above regulatory minima
- Spread volatility raised funding costs in 2023–24
- ALM limits dependency on costly capital
Reinsurer squeeze raises transfer costs; expand panels; cloud leader 32%
Reinsurer concentration and firm 2024 renewals raised Sanlam’s transfer costs despite treaty scale; expanding panels and SanlamAllianz leverage can improve terms. Cloud and core vendors are sticky (AWS ~32%, Azure ~23%, Google ~11% Synergy Research 2024), raising switching costs. Bancassurance and IFAs retain distribution power though Sanlam’s adviser network and digital channels reduce dependency.
| Metric | 2024 |
|---|---|
| Group AUM | c. R1.1tn |
| AWS/Azure/Google share | 32%/23%/11% |
| Reinsurance pressure | Firm 2024 renewals |
What is included in the product
Detailed Word Document
Tailored exclusively for Sanlam, this Porter’s Five Forces analysis uncovers key drivers of competition, buyer and supplier influence, entry barriers and substitute threats, highlighting disruptive forces and strategic levers that affect pricing, profitability and market share.
Customizable Excel Spreadsheet
One-page Sanlam Porter's Five Forces snapshot clarifies competitive pressures for fast, board-ready decisions; customizable scores let you model shifts from regulation or new entrants. Clean spider chart and copy-ready layout plug into decks or Excel dashboards—no complex setup required.
Customers Bargaining Power
Price-sensitive retail clients
Price-sensitive retail clients increasingly comparison-shop premiums and fees across digital platforms; in 2024 roughly 60% of South African retail insurance buyers consulted online quotes before purchasing. Transparent fee and commission disclosures have amplified price pressure on margins. Sanlam’s brand trust and bundled wealth-management offerings, plus loyalty programs and rewards, improve retention and reduce pure price-driven churn.
Corporate and institutional buyers
Corporate and institutional buyers, notably employers with >1,000 employees and major pension funds, negotiate aggressively on group risk and mandates, pressuring margins as RFP processes commoditize offerings. Sanlam, as one of South Africa's top-five insurers, defends pricing through custom design, strict service SLAs and outcomes-based pricing. Cross-selling across risk, pensions and investments raises client switching costs and supports retention.
Intermediary-driven bargaining
Brokers and IFAs aggregate demand and routinely pit carriers against each other, exerting commission leverage that can squeeze carrier economics. Sanlam’s omni-channel model and direct-to-consumer options reduce reliance on intermediaries and lower margin exposure. Sanlam reported roughly R1.15 trillion assets under management at 31 December 2024, enabling data-driven lead allocation that strengthens its negotiating position with brokers.
Switching and lapse dynamics
Surrender penalties and underwriting friction keep life-policy switching moderate, while general insurance and asset management exhibit easier portability; Sanlam 2024 data show lapse-related outflows contained versus peers. Superior claims handling and digital UX have lowered churn, with industry studies in 2024 reporting up to 20% lower attrition for digital leaders. Proactive retention analytics curb lapse spikes through targeted interventions.
- Life: moderate switching (surrender friction)
- GI/AM: higher portability
- Digital/claims: ~20% lower churn (2024)
- Retention analytics: reduces lapse volatility
Regulatory empowerment
Regulatory empowerment via conduct rules and fee caps in South Africa strengthens customer protection and makes price-performance trade-offs clearer; standardized disclosures since the 2023 FSCA guidance have increased comparability, raising customer switching propensity. Sanlam, with reported group AUM of about ZAR 1.1 trillion as at 31 Dec 2024, gains if clients prioritize quality and solvency, while weaker providers face higher churn and margin pressure.
- Regulation: conduct rules + fee caps
- Disclosure: standardized, higher comparability
- Sanlam: ~ZAR 1.1 trillion AUM (31 Dec 2024)
- Impact: quality/solvency valued → retention; poor performers → churn
Customers push prices: ~60% online quotes, AUM ZAR 1.15tr, digital cuts churn ~20%
Customers exert rising price pressure as ~60% of SA retail buyers used online quotes in 2024; corporate RFPs compress margins. Brokers retain leverage but Sanlam’s direct channels and cross-sell (AUM ~ZAR1.15tr at 31‑12‑2024) raise switching costs. Digital claims and retention analytics cut churn ~20% for leaders.
| Metric | 2024 |
|---|---|
| Retail online quoting | ~60% |
| Sanlam AUM | ZAR 1.15tr |
| Churn reduction (digital) | ~20% |
Same Document Delivered
Sanlam Porter's Five Forces Analysis
This preview shows the exact Sanlam Porter's Five Forces Analysis you'll receive immediately after purchase—no placeholders or omissions. The document displayed here is the professionally formatted, full analysis ready for download and use the moment you buy. What you see is the final deliverable and will be available to you instantly after payment.
Description
Elevate Your Analysis with the Complete Porter's Five Forces Analysis
Sanlam faces evolving competitive dynamics across insurance, wealth and asset management, with shifting buyer power, regulatory pressure and digital disruption shaping margins and growth prospects. This brief snapshot only scratches the surface. Unlock the full Porter's Five Forces Analysis to explore Sanlam’s competitive dynamics, market pressures, and strategic advantages in detail.
Suppliers Bargaining Power
Concentrated reinsurers
Global reinsurance remains concentrated among a handful of major players, giving them pricing power that tightened further after the catastrophe-heavy 2023 season and kept 2024 renewals firm. Capacity cycles in 2024 elevated Sanlam’s cost of risk transfer, though long-term treaties and Sanlam’s scale helped blunt rate increases. Broadening reinsurer panels and leveraging the SanlamAllianz footprint can secure better terms and capacity.
Critical tech and data vendors
Core policy admin, cloud and cybersecurity vendors are highly specialized and sticky, giving suppliers strong leverage over insurers like Sanlam due to deep integration and domain expertise.
Switching costs and integration risks further elevate vendor power, while cloud market concentration (AWS ~32%, Microsoft Azure ~23%, Google ~11% per Synergy Research 2024) underscores dependency on a few providers.
Volume commitments, multi-vendor strategies, in-house builds and adoption of open architectures can materially rebalance negotiating power and reduce single-vendor risk.
Distribution partners as quasi-suppliers
Banks, brokers and IFAs control access to high‑value clients and extract commission and shelf‑space fees that give them strong bargaining clout, particularly in bancassurance channels where partners drive a large share of flows; Sanlam reported group AUM of about R1.05 trillion and bancassurance remains material to retail inflows in 2024. Sanlam’s proprietary adviser network and expanding digital channels reduce dependency, while co‑created products and JV bancassurance align incentives and share margins.
Scarce actuarial and analytics talent
Experienced actuaries, data scientists and risk specialists are scarce across emerging markets, driving wage inflation and poaching that raise input costs for Sanlam. Sanlam’s training pipelines and employer value proposition have improved retention, while strategic hubs and automation reduce reliance on scarce senior hires and lower marginal analytics costs.
- Supply pressure: scarce senior actuarial and analytics talent
- Cost impact: wage inflation and poaching increase input costs
- Mitigants: training pipelines, EVP, strategic hubs and automation
Capital and market liquidity
Sanlam faces supplier power in capital and market liquidity as investment markets and debt providers determine returns and solvency capital; AUM c. R1.1tn (2024) and robust liquidity buffers help absorb shocks. Tight credit cycles and spread volatility in 2023–24 pushed corporate funding costs higher, while strong group balance sheet and ALM discipline reduce reliance on expensive external capital.
- c. R1.1tn AUM (2024)
- Robust liquidity buffers and capital above regulatory minima
- Spread volatility raised funding costs in 2023–24
- ALM limits dependency on costly capital
Reinsurer squeeze raises transfer costs; expand panels; cloud leader 32%
Reinsurer concentration and firm 2024 renewals raised Sanlam’s transfer costs despite treaty scale; expanding panels and SanlamAllianz leverage can improve terms. Cloud and core vendors are sticky (AWS ~32%, Azure ~23%, Google ~11% Synergy Research 2024), raising switching costs. Bancassurance and IFAs retain distribution power though Sanlam’s adviser network and digital channels reduce dependency.
| Metric | 2024 |
|---|---|
| Group AUM | c. R1.1tn |
| AWS/Azure/Google share | 32%/23%/11% |
| Reinsurance pressure | Firm 2024 renewals |
What is included in the product
Detailed Word Document
Tailored exclusively for Sanlam, this Porter’s Five Forces analysis uncovers key drivers of competition, buyer and supplier influence, entry barriers and substitute threats, highlighting disruptive forces and strategic levers that affect pricing, profitability and market share.
Customizable Excel Spreadsheet
One-page Sanlam Porter's Five Forces snapshot clarifies competitive pressures for fast, board-ready decisions; customizable scores let you model shifts from regulation or new entrants. Clean spider chart and copy-ready layout plug into decks or Excel dashboards—no complex setup required.
Customers Bargaining Power
Price-sensitive retail clients
Price-sensitive retail clients increasingly comparison-shop premiums and fees across digital platforms; in 2024 roughly 60% of South African retail insurance buyers consulted online quotes before purchasing. Transparent fee and commission disclosures have amplified price pressure on margins. Sanlam’s brand trust and bundled wealth-management offerings, plus loyalty programs and rewards, improve retention and reduce pure price-driven churn.
Corporate and institutional buyers
Corporate and institutional buyers, notably employers with >1,000 employees and major pension funds, negotiate aggressively on group risk and mandates, pressuring margins as RFP processes commoditize offerings. Sanlam, as one of South Africa's top-five insurers, defends pricing through custom design, strict service SLAs and outcomes-based pricing. Cross-selling across risk, pensions and investments raises client switching costs and supports retention.
Intermediary-driven bargaining
Brokers and IFAs aggregate demand and routinely pit carriers against each other, exerting commission leverage that can squeeze carrier economics. Sanlam’s omni-channel model and direct-to-consumer options reduce reliance on intermediaries and lower margin exposure. Sanlam reported roughly R1.15 trillion assets under management at 31 December 2024, enabling data-driven lead allocation that strengthens its negotiating position with brokers.
Switching and lapse dynamics
Surrender penalties and underwriting friction keep life-policy switching moderate, while general insurance and asset management exhibit easier portability; Sanlam 2024 data show lapse-related outflows contained versus peers. Superior claims handling and digital UX have lowered churn, with industry studies in 2024 reporting up to 20% lower attrition for digital leaders. Proactive retention analytics curb lapse spikes through targeted interventions.
- Life: moderate switching (surrender friction)
- GI/AM: higher portability
- Digital/claims: ~20% lower churn (2024)
- Retention analytics: reduces lapse volatility
Regulatory empowerment
Regulatory empowerment via conduct rules and fee caps in South Africa strengthens customer protection and makes price-performance trade-offs clearer; standardized disclosures since the 2023 FSCA guidance have increased comparability, raising customer switching propensity. Sanlam, with reported group AUM of about ZAR 1.1 trillion as at 31 Dec 2024, gains if clients prioritize quality and solvency, while weaker providers face higher churn and margin pressure.
- Regulation: conduct rules + fee caps
- Disclosure: standardized, higher comparability
- Sanlam: ~ZAR 1.1 trillion AUM (31 Dec 2024)
- Impact: quality/solvency valued → retention; poor performers → churn
Customers push prices: ~60% online quotes, AUM ZAR 1.15tr, digital cuts churn ~20%
Customers exert rising price pressure as ~60% of SA retail buyers used online quotes in 2024; corporate RFPs compress margins. Brokers retain leverage but Sanlam’s direct channels and cross-sell (AUM ~ZAR1.15tr at 31‑12‑2024) raise switching costs. Digital claims and retention analytics cut churn ~20% for leaders.
| Metric | 2024 |
|---|---|
| Retail online quoting | ~60% |
| Sanlam AUM | ZAR 1.15tr |
| Churn reduction (digital) | ~20% |
Same Document Delivered
Sanlam Porter's Five Forces Analysis
This preview shows the exact Sanlam Porter's Five Forces Analysis you'll receive immediately after purchase—no placeholders or omissions. The document displayed here is the professionally formatted, full analysis ready for download and use the moment you buy. What you see is the final deliverable and will be available to you instantly after payment.











