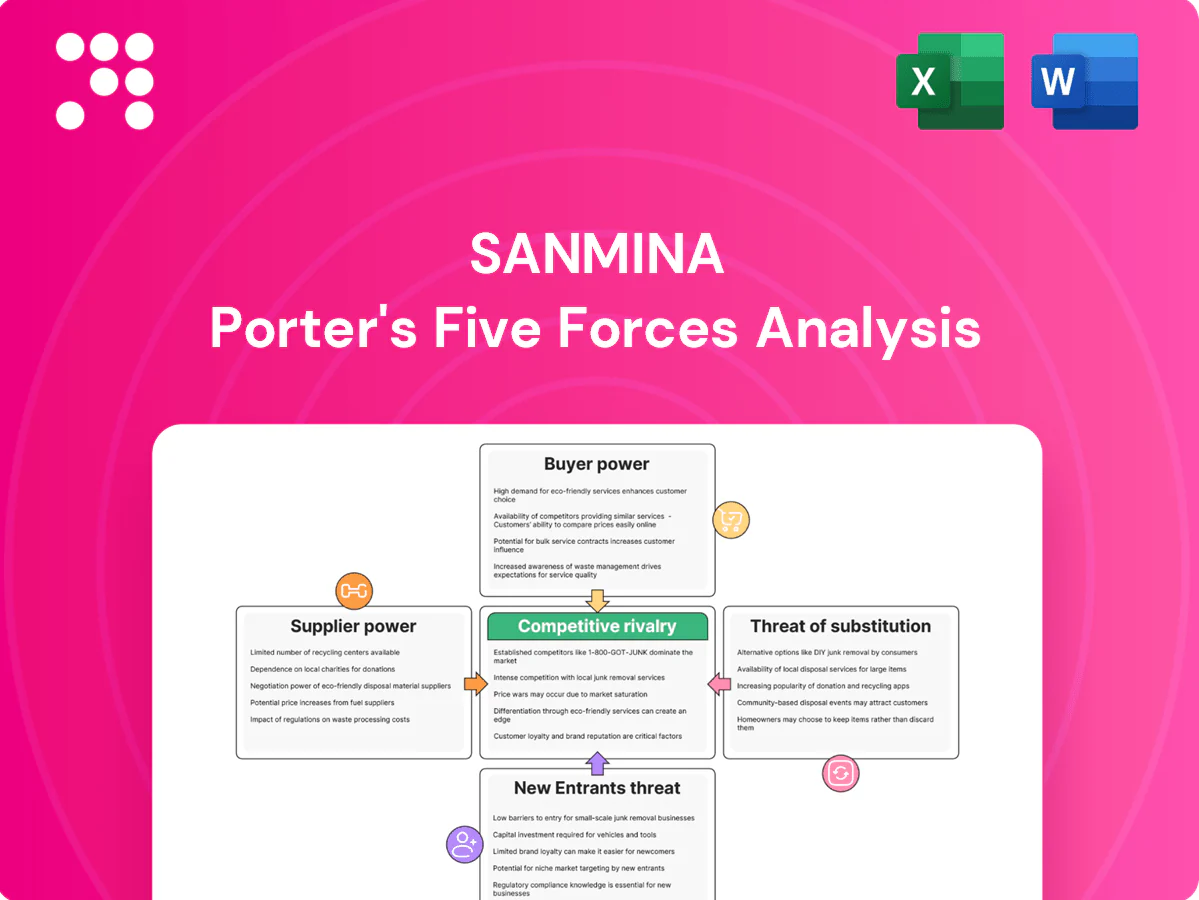
Sanmina Porter's Five Forces Analysis

Elevate Your Analysis with the Complete Porter's Five Forces Analysis
Sanmina faces intense EMS competition, moderate supplier bargaining, strong buyer power from OEMs, technological substitution risks, and significant scale barriers to new entrants. Our snapshot highlights strategic pressures and growth levers for management and investors. This brief snapshot only scratches the surface. Unlock the full Porter's Five Forces Analysis to explore Sanmina’s competitive dynamics, market pressures, and strategic advantages in detail.
Suppliers Bargaining Power

Concentrated advanced component sources
Semiconductors, advanced optics and specialized interconnects are supplied by a small set of tier-1 firms—notably TSMC and Samsung Foundry for advanced nodes, ASML for EUV tools, and large interconnect suppliers like Amphenol and TE Connectivity—giving these suppliers strong pricing and allocation power. For Sanmina’s complex builds, narrow approved‑vendor lists and design specifications that mandate particular parts amplify dependence on those suppliers. Periodic consolidation in these supplier segments further increases their leverage during allocation or pricing tightness.
Commodity inputs partially offset leverage
For metals, standard PCBs and passive components, broad supplier pools enable competitive bidding and price pressure, while Sanmina’s global scale—with roughly $7.5 billion revenue in 2024—lets it aggregate spend to extract better terms. Multi-sourcing and alternate-part qualification cut single-source risk and improve negotiation leverage. Rapid demand swings, evidenced by supply-chain volatility in 2023–24, can still compress supplier options and spike lead times.

Long lead times and allocation risk
Extended chip lead times of roughly 20–30 weeks and optics delays of 10–20 weeks force Sanmina into rigid planning and larger buffer inventories, raising working capital needs. In tight cycles suppliers allocate to strategic customers, disrupting EMS schedules and driving capacity reorders. Sanmina must deploy real-time visibility and supply-chain control towers to reduce shortages, as allocation risk can trigger redesigns or costly expedited logistics.

Strategic supplier partnerships
Strategic supplier partnerships at Sanmina—leveraging long-term agreements, vendor-managed inventory (VMI) and co-forecasting—temper supplier power by smoothing demand and reducing volatility; 2024 studies show VMI can cut inventory ~20% and stockouts ~30%. Joint NPI support and DFM/DFX collaboration align incentives on ramp speed and yield, while Sanmina’s end-to-end model increases supplier relevance but raises switching frictions.
- Long-term agreements: stabilize supply and pricing
- VMI/co-forecasting: ~20% lower inventory, ~30% fewer stockouts (2024)
- Joint NPI & DFM/DFX: faster ramps, higher yield
- End-to-end model: strengthens ties but creates switching costs
Regional and geopolitical exposure
Regional trade policies and 2023–24 export controls on advanced semiconductors have constrained component flows and prompted suppliers to add risk surcharges; compliance burdens further narrow eligible vendors. Suppliers may raise prices or impose surcharges reflecting geopolitical risk, but Sanmina’s multi-region footprint—47 manufacturing sites in 19 countries—enables re-routing and dual-sourcing where feasible.
- Trade controls: tighter 2023–24 semiconductor export rules
- Supplier response: price surcharges, allocation
- Sanmina mitigation: 47 sites in 19 countries
- Compliance impact: smaller approved supplier pool
Global scale and footprint turn lead times into supplier leverage
Suppliers of advanced semiconductors, optics and interconnects hold high leverage (chip lead times 20–30 wks) while commoditized components exert low power; Sanmina’s $7.5B 2024 scale and 47 sites in 19 countries improve negotiation and re‑routing. Long‑term agreements, VMI (~20% inventory, ~30% fewer stockouts) and co‑engineering reduce supplier risk amid 2023–24 export controls.
| Metric | Value |
|---|---|
| Revenue (2024) | $7.5B |
| Sites/Countries | 47 / 19 |
| Chip lead times | 20–30 wks |
| VMI impact | -20% inventory, -30% stockouts |
What is included in the product
 Detailed Word Document
Uncovers key drivers of competition, supplier and buyer power, threat of substitutes and new entrants, and intra-industry rivalry shaping Sanmina’s pricing, margins, and strategic positioning; identifies disruptive technologies and market dynamics to inform strategic defenses and growth opportunities.

 Customizable Excel Spreadsheet
A clear, one-sheet summary of all five forces for Sanmina—perfect for quick strategic decisions and supplier/customer negotiations.
Customers Bargaining Power

Large OEMs with scale bargaining
Large enterprise tech, networking, medical and industrial OEMs buy at scale and negotiate aggressively; in 2024 Sanmina reported roughly $7.2 billion in revenue, with its largest OEM customers concentrating a substantial share of sales, driving material pricing pressure and tighter contract terms. Sanmina must justify premium through higher yield, faster time-to-market and comprehensive lifecycle services, where volume commitments often trade off against per-unit margin.
Switching costs from validation
Process qualifications, tooling and regulatory validations create moderate-to-high switching costs, often requiring 3–12 months for line transfers in regulated verticals with significant audit overhead. Sanmina leverages quality and compliance to build customer stickiness, supported by its global certifications and controlled manufacturing footprint. Determined OEMs, however, can still re-source over longer procurement cycles.

Dual-sourcing and frequent rebids
Over half of OEMs maintain dual EMS sources to keep pricing competitive and reduce supply risk; regular RFQs and benchmarking—used by more than 50% of buyers—sustain buyer leverage. Sanmina must compete on total cost of ownership, not unit price alone, demonstrating lifecycle cost savings in bids. Performance SLAs and KPI metrics drive renewals and are often decisive in contract awards.

Service-level and quality demands
Buyers demand strict OTIF of 95–99%, ppm defect targets often below 100 ppm, and rapid NPI ramps of 4–12 weeks; failure to meet metrics can trigger penalties or re-sourcing. Sanmina’s integrated design-to-logistics span enables end-to-end accountability and faster corrective action. Continuous improvement and full traceability are baseline expectations in 2024 manufacturing contracts.
Demand cyclicality and inventory terms
Volatile end markets push inventory and flexibility burdens onto EMS providers, and Sanmina reported roughly $8.0 billion revenue in FY2024 while managing elevated supply-chain volatility; buyers frequently negotiate consignment, hubbing, and liability caps that shift working capital risk to suppliers. Sanmina’s supply-visibility tools reduce excess and obsolescence but cannot eliminate risk, leaving cash conversion sensitive to contractual terms and demand swings.
- Sanmina FY2024 revenue ~8.0B
- Buyers use consignment/hubbing/liability caps to reduce their inventory risk
- Supply-visibility reduces obsolescence but cash conversion remains vulnerable
OEM buying power strains suppliers; OTIF 95–99%, rev 8.0B
Large enterprise OEMs concentrate procurement, driving strong price/term leverage despite Sanmina FY2024 revenue ~8.0B.
Buyers use dual-sourcing and regular RFQs (>50%); consignment/hubbing shift working-capital risk to suppliers.
Customers demand OTIF 95–99%, ppm <100 and NPI ramps 4–12 weeks; SLAs determine renewals.
Process qualifications create 3–12 month switching costs, tempering but not eliminating buyer power.
| Metric | 2024 |
|---|---|
| Revenue | ~8.0B |
| OTIF | 95–99% |
| ppm target | <100 |
Full Version Awaits
Sanmina Porter's Five Forces Analysis
This preview shows the exact Sanmina Porter's Five Forces analysis you'll receive immediately after purchase—no placeholders or mockups. The document is the final, professionally formatted file, ready for download and use upon payment. It covers supplier power, buyer power, competitive rivalry, threat of substitution, and barriers to entry with actionable insights.

Elevate Your Analysis with the Complete Porter's Five Forces Analysis
Sanmina faces intense EMS competition, moderate supplier bargaining, strong buyer power from OEMs, technological substitution risks, and significant scale barriers to new entrants. Our snapshot highlights strategic pressures and growth levers for management and investors. This brief snapshot only scratches the surface. Unlock the full Porter's Five Forces Analysis to explore Sanmina’s competitive dynamics, market pressures, and strategic advantages in detail.
Suppliers Bargaining Power
Concentrated advanced component sources
Semiconductors, advanced optics and specialized interconnects are supplied by a small set of tier-1 firms—notably TSMC and Samsung Foundry for advanced nodes, ASML for EUV tools, and large interconnect suppliers like Amphenol and TE Connectivity—giving these suppliers strong pricing and allocation power. For Sanmina’s complex builds, narrow approved‑vendor lists and design specifications that mandate particular parts amplify dependence on those suppliers. Periodic consolidation in these supplier segments further increases their leverage during allocation or pricing tightness.
Commodity inputs partially offset leverage
For metals, standard PCBs and passive components, broad supplier pools enable competitive bidding and price pressure, while Sanmina’s global scale—with roughly $7.5 billion revenue in 2024—lets it aggregate spend to extract better terms. Multi-sourcing and alternate-part qualification cut single-source risk and improve negotiation leverage. Rapid demand swings, evidenced by supply-chain volatility in 2023–24, can still compress supplier options and spike lead times.
Long lead times and allocation risk
Extended chip lead times of roughly 20–30 weeks and optics delays of 10–20 weeks force Sanmina into rigid planning and larger buffer inventories, raising working capital needs. In tight cycles suppliers allocate to strategic customers, disrupting EMS schedules and driving capacity reorders. Sanmina must deploy real-time visibility and supply-chain control towers to reduce shortages, as allocation risk can trigger redesigns or costly expedited logistics.
Strategic supplier partnerships
Strategic supplier partnerships at Sanmina—leveraging long-term agreements, vendor-managed inventory (VMI) and co-forecasting—temper supplier power by smoothing demand and reducing volatility; 2024 studies show VMI can cut inventory ~20% and stockouts ~30%. Joint NPI support and DFM/DFX collaboration align incentives on ramp speed and yield, while Sanmina’s end-to-end model increases supplier relevance but raises switching frictions.
- Long-term agreements: stabilize supply and pricing
- VMI/co-forecasting: ~20% lower inventory, ~30% fewer stockouts (2024)
- Joint NPI & DFM/DFX: faster ramps, higher yield
- End-to-end model: strengthens ties but creates switching costs
Regional and geopolitical exposure
Regional trade policies and 2023–24 export controls on advanced semiconductors have constrained component flows and prompted suppliers to add risk surcharges; compliance burdens further narrow eligible vendors. Suppliers may raise prices or impose surcharges reflecting geopolitical risk, but Sanmina’s multi-region footprint—47 manufacturing sites in 19 countries—enables re-routing and dual-sourcing where feasible.
- Trade controls: tighter 2023–24 semiconductor export rules
- Supplier response: price surcharges, allocation
- Sanmina mitigation: 47 sites in 19 countries
- Compliance impact: smaller approved supplier pool
Global scale and footprint turn lead times into supplier leverage
Suppliers of advanced semiconductors, optics and interconnects hold high leverage (chip lead times 20–30 wks) while commoditized components exert low power; Sanmina’s $7.5B 2024 scale and 47 sites in 19 countries improve negotiation and re‑routing. Long‑term agreements, VMI (~20% inventory, ~30% fewer stockouts) and co‑engineering reduce supplier risk amid 2023–24 export controls.
| Metric | Value |
|---|---|
| Revenue (2024) | $7.5B |
| Sites/Countries | 47 / 19 |
| Chip lead times | 20–30 wks |
| VMI impact | -20% inventory, -30% stockouts |
What is included in the product
Detailed Word Document
Uncovers key drivers of competition, supplier and buyer power, threat of substitutes and new entrants, and intra-industry rivalry shaping Sanmina’s pricing, margins, and strategic positioning; identifies disruptive technologies and market dynamics to inform strategic defenses and growth opportunities.
Customizable Excel Spreadsheet
A clear, one-sheet summary of all five forces for Sanmina—perfect for quick strategic decisions and supplier/customer negotiations.
Customers Bargaining Power
Large OEMs with scale bargaining
Large enterprise tech, networking, medical and industrial OEMs buy at scale and negotiate aggressively; in 2024 Sanmina reported roughly $7.2 billion in revenue, with its largest OEM customers concentrating a substantial share of sales, driving material pricing pressure and tighter contract terms. Sanmina must justify premium through higher yield, faster time-to-market and comprehensive lifecycle services, where volume commitments often trade off against per-unit margin.
Switching costs from validation
Process qualifications, tooling and regulatory validations create moderate-to-high switching costs, often requiring 3–12 months for line transfers in regulated verticals with significant audit overhead. Sanmina leverages quality and compliance to build customer stickiness, supported by its global certifications and controlled manufacturing footprint. Determined OEMs, however, can still re-source over longer procurement cycles.
Dual-sourcing and frequent rebids
Over half of OEMs maintain dual EMS sources to keep pricing competitive and reduce supply risk; regular RFQs and benchmarking—used by more than 50% of buyers—sustain buyer leverage. Sanmina must compete on total cost of ownership, not unit price alone, demonstrating lifecycle cost savings in bids. Performance SLAs and KPI metrics drive renewals and are often decisive in contract awards.
Service-level and quality demands
Buyers demand strict OTIF of 95–99%, ppm defect targets often below 100 ppm, and rapid NPI ramps of 4–12 weeks; failure to meet metrics can trigger penalties or re-sourcing. Sanmina’s integrated design-to-logistics span enables end-to-end accountability and faster corrective action. Continuous improvement and full traceability are baseline expectations in 2024 manufacturing contracts.
Demand cyclicality and inventory terms
Volatile end markets push inventory and flexibility burdens onto EMS providers, and Sanmina reported roughly $8.0 billion revenue in FY2024 while managing elevated supply-chain volatility; buyers frequently negotiate consignment, hubbing, and liability caps that shift working capital risk to suppliers. Sanmina’s supply-visibility tools reduce excess and obsolescence but cannot eliminate risk, leaving cash conversion sensitive to contractual terms and demand swings.
- Sanmina FY2024 revenue ~8.0B
- Buyers use consignment/hubbing/liability caps to reduce their inventory risk
- Supply-visibility reduces obsolescence but cash conversion remains vulnerable
OEM buying power strains suppliers; OTIF 95–99%, rev 8.0B
Large enterprise OEMs concentrate procurement, driving strong price/term leverage despite Sanmina FY2024 revenue ~8.0B.
Buyers use dual-sourcing and regular RFQs (>50%); consignment/hubbing shift working-capital risk to suppliers.
Customers demand OTIF 95–99%, ppm <100 and NPI ramps 4–12 weeks; SLAs determine renewals.
Process qualifications create 3–12 month switching costs, tempering but not eliminating buyer power.
| Metric | 2024 |
|---|---|
| Revenue | ~8.0B |
| OTIF | 95–99% |
| ppm target | <100 |
Full Version Awaits
Sanmina Porter's Five Forces Analysis
This preview shows the exact Sanmina Porter's Five Forces analysis you'll receive immediately after purchase—no placeholders or mockups. The document is the final, professionally formatted file, ready for download and use upon payment. It covers supplier power, buyer power, competitive rivalry, threat of substitution, and barriers to entry with actionable insights.
Original: $10.00
-65%$10.00
$3.50Description
Elevate Your Analysis with the Complete Porter's Five Forces Analysis
Sanmina faces intense EMS competition, moderate supplier bargaining, strong buyer power from OEMs, technological substitution risks, and significant scale barriers to new entrants. Our snapshot highlights strategic pressures and growth levers for management and investors. This brief snapshot only scratches the surface. Unlock the full Porter's Five Forces Analysis to explore Sanmina’s competitive dynamics, market pressures, and strategic advantages in detail.
Suppliers Bargaining Power
Concentrated advanced component sources
Semiconductors, advanced optics and specialized interconnects are supplied by a small set of tier-1 firms—notably TSMC and Samsung Foundry for advanced nodes, ASML for EUV tools, and large interconnect suppliers like Amphenol and TE Connectivity—giving these suppliers strong pricing and allocation power. For Sanmina’s complex builds, narrow approved‑vendor lists and design specifications that mandate particular parts amplify dependence on those suppliers. Periodic consolidation in these supplier segments further increases their leverage during allocation or pricing tightness.
Commodity inputs partially offset leverage
For metals, standard PCBs and passive components, broad supplier pools enable competitive bidding and price pressure, while Sanmina’s global scale—with roughly $7.5 billion revenue in 2024—lets it aggregate spend to extract better terms. Multi-sourcing and alternate-part qualification cut single-source risk and improve negotiation leverage. Rapid demand swings, evidenced by supply-chain volatility in 2023–24, can still compress supplier options and spike lead times.
Long lead times and allocation risk
Extended chip lead times of roughly 20–30 weeks and optics delays of 10–20 weeks force Sanmina into rigid planning and larger buffer inventories, raising working capital needs. In tight cycles suppliers allocate to strategic customers, disrupting EMS schedules and driving capacity reorders. Sanmina must deploy real-time visibility and supply-chain control towers to reduce shortages, as allocation risk can trigger redesigns or costly expedited logistics.
Strategic supplier partnerships
Strategic supplier partnerships at Sanmina—leveraging long-term agreements, vendor-managed inventory (VMI) and co-forecasting—temper supplier power by smoothing demand and reducing volatility; 2024 studies show VMI can cut inventory ~20% and stockouts ~30%. Joint NPI support and DFM/DFX collaboration align incentives on ramp speed and yield, while Sanmina’s end-to-end model increases supplier relevance but raises switching frictions.
- Long-term agreements: stabilize supply and pricing
- VMI/co-forecasting: ~20% lower inventory, ~30% fewer stockouts (2024)
- Joint NPI & DFM/DFX: faster ramps, higher yield
- End-to-end model: strengthens ties but creates switching costs
Regional and geopolitical exposure
Regional trade policies and 2023–24 export controls on advanced semiconductors have constrained component flows and prompted suppliers to add risk surcharges; compliance burdens further narrow eligible vendors. Suppliers may raise prices or impose surcharges reflecting geopolitical risk, but Sanmina’s multi-region footprint—47 manufacturing sites in 19 countries—enables re-routing and dual-sourcing where feasible.
- Trade controls: tighter 2023–24 semiconductor export rules
- Supplier response: price surcharges, allocation
- Sanmina mitigation: 47 sites in 19 countries
- Compliance impact: smaller approved supplier pool
Global scale and footprint turn lead times into supplier leverage
Suppliers of advanced semiconductors, optics and interconnects hold high leverage (chip lead times 20–30 wks) while commoditized components exert low power; Sanmina’s $7.5B 2024 scale and 47 sites in 19 countries improve negotiation and re‑routing. Long‑term agreements, VMI (~20% inventory, ~30% fewer stockouts) and co‑engineering reduce supplier risk amid 2023–24 export controls.
| Metric | Value |
|---|---|
| Revenue (2024) | $7.5B |
| Sites/Countries | 47 / 19 |
| Chip lead times | 20–30 wks |
| VMI impact | -20% inventory, -30% stockouts |
What is included in the product
Detailed Word Document
Uncovers key drivers of competition, supplier and buyer power, threat of substitutes and new entrants, and intra-industry rivalry shaping Sanmina’s pricing, margins, and strategic positioning; identifies disruptive technologies and market dynamics to inform strategic defenses and growth opportunities.
Customizable Excel Spreadsheet
A clear, one-sheet summary of all five forces for Sanmina—perfect for quick strategic decisions and supplier/customer negotiations.
Customers Bargaining Power
Large OEMs with scale bargaining
Large enterprise tech, networking, medical and industrial OEMs buy at scale and negotiate aggressively; in 2024 Sanmina reported roughly $7.2 billion in revenue, with its largest OEM customers concentrating a substantial share of sales, driving material pricing pressure and tighter contract terms. Sanmina must justify premium through higher yield, faster time-to-market and comprehensive lifecycle services, where volume commitments often trade off against per-unit margin.
Switching costs from validation
Process qualifications, tooling and regulatory validations create moderate-to-high switching costs, often requiring 3–12 months for line transfers in regulated verticals with significant audit overhead. Sanmina leverages quality and compliance to build customer stickiness, supported by its global certifications and controlled manufacturing footprint. Determined OEMs, however, can still re-source over longer procurement cycles.
Dual-sourcing and frequent rebids
Over half of OEMs maintain dual EMS sources to keep pricing competitive and reduce supply risk; regular RFQs and benchmarking—used by more than 50% of buyers—sustain buyer leverage. Sanmina must compete on total cost of ownership, not unit price alone, demonstrating lifecycle cost savings in bids. Performance SLAs and KPI metrics drive renewals and are often decisive in contract awards.
Service-level and quality demands
Buyers demand strict OTIF of 95–99%, ppm defect targets often below 100 ppm, and rapid NPI ramps of 4–12 weeks; failure to meet metrics can trigger penalties or re-sourcing. Sanmina’s integrated design-to-logistics span enables end-to-end accountability and faster corrective action. Continuous improvement and full traceability are baseline expectations in 2024 manufacturing contracts.
Demand cyclicality and inventory terms
Volatile end markets push inventory and flexibility burdens onto EMS providers, and Sanmina reported roughly $8.0 billion revenue in FY2024 while managing elevated supply-chain volatility; buyers frequently negotiate consignment, hubbing, and liability caps that shift working capital risk to suppliers. Sanmina’s supply-visibility tools reduce excess and obsolescence but cannot eliminate risk, leaving cash conversion sensitive to contractual terms and demand swings.
- Sanmina FY2024 revenue ~8.0B
- Buyers use consignment/hubbing/liability caps to reduce their inventory risk
- Supply-visibility reduces obsolescence but cash conversion remains vulnerable
OEM buying power strains suppliers; OTIF 95–99%, rev 8.0B
Large enterprise OEMs concentrate procurement, driving strong price/term leverage despite Sanmina FY2024 revenue ~8.0B.
Buyers use dual-sourcing and regular RFQs (>50%); consignment/hubbing shift working-capital risk to suppliers.
Customers demand OTIF 95–99%, ppm <100 and NPI ramps 4–12 weeks; SLAs determine renewals.
Process qualifications create 3–12 month switching costs, tempering but not eliminating buyer power.
| Metric | 2024 |
|---|---|
| Revenue | ~8.0B |
| OTIF | 95–99% |
| ppm target | <100 |
Full Version Awaits
Sanmina Porter's Five Forces Analysis
This preview shows the exact Sanmina Porter's Five Forces analysis you'll receive immediately after purchase—no placeholders or mockups. The document is the final, professionally formatted file, ready for download and use upon payment. It covers supplier power, buyer power, competitive rivalry, threat of substitution, and barriers to entry with actionable insights.











