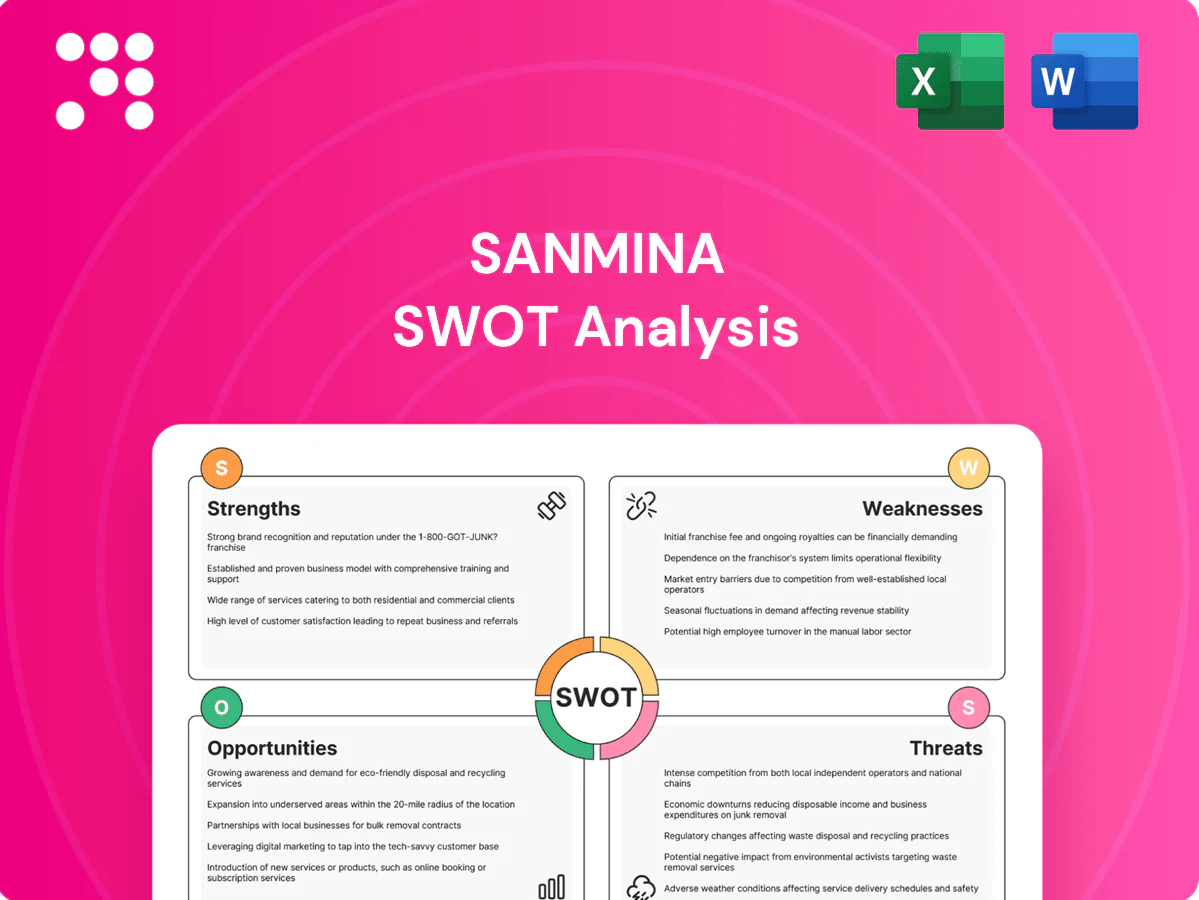
Sanmina SWOT Analysis

Elevate Your Analysis with the Complete SWOT Report
Explore Sanmina’s competitive edge, operational risks, and market opportunities with our concise SWOT overview—highlighting strengths like diversified manufacturing and weaknesses such as supply-chain exposure. For actionable strategies, financial context, and editable deliverables, purchase the full SWOT analysis to inform investment, planning, and presentations.
Strengths

End-to-end EMS scope
Sanmina’s end-to-end EMS model—covering design, engineering, manufacturing and logistics—reduces handoffs and shortens time-to-market, supporting faster new product introduction and greater accountability. By simplifying vendor management and lowering total cost of ownership, the integrated footprint (FY2024 revenue $7.2B) enables cross-functional optimization from DFM to after-market support.
Deep engineering expertise
Strong optical, electronic and mechanical design capabilities let Sanmina influence product architecture early, shaping form, test and manufacturability decisions. Engineering-led engagement raises switching costs and embeds Sanmina in customer roadmaps. This supports complex, high-reliability products and wins higher-value programs beyond build-to-print. Backed by a global EMS platform with annual revenue exceeding $6 billion (FY2024).

Interconnect and PCB strength
Sanmina’s proprietary interconnect, PCB, and backplane solutions create vertical-integration advantages that boost signal integrity and throughput for high-speed systems. In-house fabrication shortens lead times and mitigates supply volatility, supporting mission-critical data center, telecom, and defense programs. These capabilities underpin scale for a company with $7.43 billion revenue in 2023.

Supply chain visibility & control
End-to-end visibility at Sanmina improves planning, traceability, and compliance across multi-tier supply chains and enables proactive risk management during shortages and logistics disruptions. OEMs gain real-time insights into materials, yields, and quality, accelerating issue resolution and sustaining uptime for mission-critical programs. Sanmina operates 35 manufacturing sites in 14 countries and holds ISO 13485 and AS9100 certifications, making this capability a key differentiator in regulated markets.
- End-to-end planning, traceability, compliance
- Proactive risk management during shortages/logistics
- Real-time materials, yield, quality insights for OEMs
- 35 sites in 14 countries; ISO 13485, AS9100
Global footprint & certifications
Sanmina's diversified manufacturing network supports regionalization, resiliency and cost optimization while enabling local-for-local production to meet tariff and lead-time targets. Its sites hold ISO 13485, AS9100 and ITAR registrations, supporting medical, aerospace and defense contracts and consistent cross-site transfers. Scale enables repeatable execution and rapid customer transfers across facilities.
- Regionalized footprint reduces tariff exposure
- ISO 13485 / AS9100 / ITAR for regulated sectors
- Local-for-local shortens lead times
- Scale enables consistent site-to-site transfers
Engineering-led EMS shortens time-to-market, lowers TCO; vertical PCB integration lowers supply risk
Sanmina’s end-to-end EMS model (FY2024 revenue $7.2B) shortens time-to-market and lowers TCO. Engineering-led design capabilities win higher-value, complex programs (revenue $7.43B in 2023). Vertical integration in PCBs/backplanes reduces lead times and supply risk. A 35-site, 14-country footprint with ISO 13485, AS9100 and ITAR supports regulated markets.
| Metric | Value |
|---|---|
| FY2024 Revenue | $7.2B |
| 2023 Revenue | $7.43B |
| Sites / Countries | 35 / 14 |
| Certifications | ISO 13485, AS9100, ITAR |
What is included in the product
 Detailed Word Document
Delivers a strategic overview of Sanmina’s internal capabilities and external market factors, outlining strengths, weaknesses, opportunities, and threats to assess competitive position and inform growth and risk-management strategies.

 Customizable Excel Spreadsheet
Provides a concise Sanmina SWOT matrix for fast, visual alignment of manufacturing, supply‑chain and technology risks and opportunities to speed strategic decisions.
Weaknesses

Low-margin EMS profile
Sanmina faces a low-margin EMS profile: industry gross margins ran roughly 4–8% in 2024, reflecting tight pricing and limited differentiation on commoditized builds. Margins are volatile from input-cost swings and frequent price-downs, pressuring operating profit. Value capture hinges on shifting mix to higher-complexity, higher-margin programs and disciplined program selection. Sustained profitability requires rigorous cost control and portfolio discipline.
Customer concentration risk
Sanmina faces pronounced customer concentration risk: large OEMs drive a substantial portion of revenue (FY2024 revenue roughly $7.8 billion), so program wins or losses can materially swing plant utilization and quarterly results. High concentration weakens pricing leverage at renewals, and diversification across end markets and customers remains a persistent strategic challenge.

Working capital intensity
Working capital intensity is a key weakness for Sanmina (NASDAQ: SANM), as high inventory and receivables—especially for long lead-time components—tie up cash and raise the risk of excess and obsolete write-downs when demand shifts; cash conversion cycles remain highly sensitive to supplier and customer terms, so tight working-capital management is essential to fund growth without diluting returns.

Exposure to cyclicality
Exposure to cyclicality: end markets such as networking, industrial and semiconductor‑equipment are highly cyclical; downturns can sharply reduce volumes and leave Sanmina's fixed-cost base under‑absorbed, pressuring margins. Forecast misses cascade through the supply chain, limiting revenue visibility despite long customer relationships; Sanmina reported revenue of about $8.9B in FY2023, highlighting scale but not immunity.
- Vulnerability: networking/industrial/semicap cyclical demand
- Margin risk: fixed-cost under‑absorption
- Forecast risk: cascading supply‑chain impacts
- Revenue visibility: limited despite long relationships
Limited brand pull
Sanmina’s limited brand pull leaves it dependent on OEM brands that drive end-customer demand, constraining its ability to pass through costs or upsell without demonstrable value-add; FY2024 revenue was about $7.3 billion, yet marketing leverage remains weaker than product-owning OEMs. Differentiation must come from engineering, quality and execution to capture margin and win OEM-design wins.
- OEM-driven demand limits pricing power
- FY2024 revenue ~ $7.3B
- Must compete on engineering/quality
- Weaker marketing leverage vs OEMs
EMS margins tight; FY2024 revenue $7.8B, margins 4–8%
Low-margin EMS profile (industry gross margins ~4–8% in 2024) and volatile input costs compress operating profit. High customer concentration means program swings materially affect utilization; FY2024 revenue ~ $7.8B vs FY2023 ~$8.9B. Working-capital intensity and cyclical end markets raise forecast and margin risk.
| Metric | Value |
|---|---|
| FY2024 revenue | $7.8B |
| FY2023 revenue | $8.9B |
| Industry gross margin (2024) | 4–8% |
Same Document Delivered
Sanmina SWOT Analysis
This is the actual Sanmina SWOT analysis document you’ll receive upon purchase—no surprises, just professional quality. The preview below is taken directly from the full report and reflects the same structure, insights, and data you’ll download after checkout. Purchase unlocks the complete, editable version for immediate use.

Elevate Your Analysis with the Complete SWOT Report
Explore Sanmina’s competitive edge, operational risks, and market opportunities with our concise SWOT overview—highlighting strengths like diversified manufacturing and weaknesses such as supply-chain exposure. For actionable strategies, financial context, and editable deliverables, purchase the full SWOT analysis to inform investment, planning, and presentations.
Strengths
End-to-end EMS scope
Sanmina’s end-to-end EMS model—covering design, engineering, manufacturing and logistics—reduces handoffs and shortens time-to-market, supporting faster new product introduction and greater accountability. By simplifying vendor management and lowering total cost of ownership, the integrated footprint (FY2024 revenue $7.2B) enables cross-functional optimization from DFM to after-market support.
Deep engineering expertise
Strong optical, electronic and mechanical design capabilities let Sanmina influence product architecture early, shaping form, test and manufacturability decisions. Engineering-led engagement raises switching costs and embeds Sanmina in customer roadmaps. This supports complex, high-reliability products and wins higher-value programs beyond build-to-print. Backed by a global EMS platform with annual revenue exceeding $6 billion (FY2024).
Interconnect and PCB strength
Sanmina’s proprietary interconnect, PCB, and backplane solutions create vertical-integration advantages that boost signal integrity and throughput for high-speed systems. In-house fabrication shortens lead times and mitigates supply volatility, supporting mission-critical data center, telecom, and defense programs. These capabilities underpin scale for a company with $7.43 billion revenue in 2023.
Supply chain visibility & control
End-to-end visibility at Sanmina improves planning, traceability, and compliance across multi-tier supply chains and enables proactive risk management during shortages and logistics disruptions. OEMs gain real-time insights into materials, yields, and quality, accelerating issue resolution and sustaining uptime for mission-critical programs. Sanmina operates 35 manufacturing sites in 14 countries and holds ISO 13485 and AS9100 certifications, making this capability a key differentiator in regulated markets.
- End-to-end planning, traceability, compliance
- Proactive risk management during shortages/logistics
- Real-time materials, yield, quality insights for OEMs
- 35 sites in 14 countries; ISO 13485, AS9100
Global footprint & certifications
Sanmina's diversified manufacturing network supports regionalization, resiliency and cost optimization while enabling local-for-local production to meet tariff and lead-time targets. Its sites hold ISO 13485, AS9100 and ITAR registrations, supporting medical, aerospace and defense contracts and consistent cross-site transfers. Scale enables repeatable execution and rapid customer transfers across facilities.
- Regionalized footprint reduces tariff exposure
- ISO 13485 / AS9100 / ITAR for regulated sectors
- Local-for-local shortens lead times
- Scale enables consistent site-to-site transfers
Engineering-led EMS shortens time-to-market, lowers TCO; vertical PCB integration lowers supply risk
Sanmina’s end-to-end EMS model (FY2024 revenue $7.2B) shortens time-to-market and lowers TCO. Engineering-led design capabilities win higher-value, complex programs (revenue $7.43B in 2023). Vertical integration in PCBs/backplanes reduces lead times and supply risk. A 35-site, 14-country footprint with ISO 13485, AS9100 and ITAR supports regulated markets.
| Metric | Value |
|---|---|
| FY2024 Revenue | $7.2B |
| 2023 Revenue | $7.43B |
| Sites / Countries | 35 / 14 |
| Certifications | ISO 13485, AS9100, ITAR |
What is included in the product
Detailed Word Document
Delivers a strategic overview of Sanmina’s internal capabilities and external market factors, outlining strengths, weaknesses, opportunities, and threats to assess competitive position and inform growth and risk-management strategies.
Customizable Excel Spreadsheet
Provides a concise Sanmina SWOT matrix for fast, visual alignment of manufacturing, supply‑chain and technology risks and opportunities to speed strategic decisions.
Weaknesses
Low-margin EMS profile
Sanmina faces a low-margin EMS profile: industry gross margins ran roughly 4–8% in 2024, reflecting tight pricing and limited differentiation on commoditized builds. Margins are volatile from input-cost swings and frequent price-downs, pressuring operating profit. Value capture hinges on shifting mix to higher-complexity, higher-margin programs and disciplined program selection. Sustained profitability requires rigorous cost control and portfolio discipline.
Customer concentration risk
Sanmina faces pronounced customer concentration risk: large OEMs drive a substantial portion of revenue (FY2024 revenue roughly $7.8 billion), so program wins or losses can materially swing plant utilization and quarterly results. High concentration weakens pricing leverage at renewals, and diversification across end markets and customers remains a persistent strategic challenge.
Working capital intensity
Working capital intensity is a key weakness for Sanmina (NASDAQ: SANM), as high inventory and receivables—especially for long lead-time components—tie up cash and raise the risk of excess and obsolete write-downs when demand shifts; cash conversion cycles remain highly sensitive to supplier and customer terms, so tight working-capital management is essential to fund growth without diluting returns.
Exposure to cyclicality
Exposure to cyclicality: end markets such as networking, industrial and semiconductor‑equipment are highly cyclical; downturns can sharply reduce volumes and leave Sanmina's fixed-cost base under‑absorbed, pressuring margins. Forecast misses cascade through the supply chain, limiting revenue visibility despite long customer relationships; Sanmina reported revenue of about $8.9B in FY2023, highlighting scale but not immunity.
- Vulnerability: networking/industrial/semicap cyclical demand
- Margin risk: fixed-cost under‑absorption
- Forecast risk: cascading supply‑chain impacts
- Revenue visibility: limited despite long relationships
Limited brand pull
Sanmina’s limited brand pull leaves it dependent on OEM brands that drive end-customer demand, constraining its ability to pass through costs or upsell without demonstrable value-add; FY2024 revenue was about $7.3 billion, yet marketing leverage remains weaker than product-owning OEMs. Differentiation must come from engineering, quality and execution to capture margin and win OEM-design wins.
- OEM-driven demand limits pricing power
- FY2024 revenue ~ $7.3B
- Must compete on engineering/quality
- Weaker marketing leverage vs OEMs
EMS margins tight; FY2024 revenue $7.8B, margins 4–8%
Low-margin EMS profile (industry gross margins ~4–8% in 2024) and volatile input costs compress operating profit. High customer concentration means program swings materially affect utilization; FY2024 revenue ~ $7.8B vs FY2023 ~$8.9B. Working-capital intensity and cyclical end markets raise forecast and margin risk.
| Metric | Value |
|---|---|
| FY2024 revenue | $7.8B |
| FY2023 revenue | $8.9B |
| Industry gross margin (2024) | 4–8% |
Same Document Delivered
Sanmina SWOT Analysis
This is the actual Sanmina SWOT analysis document you’ll receive upon purchase—no surprises, just professional quality. The preview below is taken directly from the full report and reflects the same structure, insights, and data you’ll download after checkout. Purchase unlocks the complete, editable version for immediate use.
Original: $10.00
-65%$10.00
$3.50Description
Elevate Your Analysis with the Complete SWOT Report
Explore Sanmina’s competitive edge, operational risks, and market opportunities with our concise SWOT overview—highlighting strengths like diversified manufacturing and weaknesses such as supply-chain exposure. For actionable strategies, financial context, and editable deliverables, purchase the full SWOT analysis to inform investment, planning, and presentations.
Strengths
End-to-end EMS scope
Sanmina’s end-to-end EMS model—covering design, engineering, manufacturing and logistics—reduces handoffs and shortens time-to-market, supporting faster new product introduction and greater accountability. By simplifying vendor management and lowering total cost of ownership, the integrated footprint (FY2024 revenue $7.2B) enables cross-functional optimization from DFM to after-market support.
Deep engineering expertise
Strong optical, electronic and mechanical design capabilities let Sanmina influence product architecture early, shaping form, test and manufacturability decisions. Engineering-led engagement raises switching costs and embeds Sanmina in customer roadmaps. This supports complex, high-reliability products and wins higher-value programs beyond build-to-print. Backed by a global EMS platform with annual revenue exceeding $6 billion (FY2024).
Interconnect and PCB strength
Sanmina’s proprietary interconnect, PCB, and backplane solutions create vertical-integration advantages that boost signal integrity and throughput for high-speed systems. In-house fabrication shortens lead times and mitigates supply volatility, supporting mission-critical data center, telecom, and defense programs. These capabilities underpin scale for a company with $7.43 billion revenue in 2023.
Supply chain visibility & control
End-to-end visibility at Sanmina improves planning, traceability, and compliance across multi-tier supply chains and enables proactive risk management during shortages and logistics disruptions. OEMs gain real-time insights into materials, yields, and quality, accelerating issue resolution and sustaining uptime for mission-critical programs. Sanmina operates 35 manufacturing sites in 14 countries and holds ISO 13485 and AS9100 certifications, making this capability a key differentiator in regulated markets.
- End-to-end planning, traceability, compliance
- Proactive risk management during shortages/logistics
- Real-time materials, yield, quality insights for OEMs
- 35 sites in 14 countries; ISO 13485, AS9100
Global footprint & certifications
Sanmina's diversified manufacturing network supports regionalization, resiliency and cost optimization while enabling local-for-local production to meet tariff and lead-time targets. Its sites hold ISO 13485, AS9100 and ITAR registrations, supporting medical, aerospace and defense contracts and consistent cross-site transfers. Scale enables repeatable execution and rapid customer transfers across facilities.
- Regionalized footprint reduces tariff exposure
- ISO 13485 / AS9100 / ITAR for regulated sectors
- Local-for-local shortens lead times
- Scale enables consistent site-to-site transfers
Engineering-led EMS shortens time-to-market, lowers TCO; vertical PCB integration lowers supply risk
Sanmina’s end-to-end EMS model (FY2024 revenue $7.2B) shortens time-to-market and lowers TCO. Engineering-led design capabilities win higher-value, complex programs (revenue $7.43B in 2023). Vertical integration in PCBs/backplanes reduces lead times and supply risk. A 35-site, 14-country footprint with ISO 13485, AS9100 and ITAR supports regulated markets.
| Metric | Value |
|---|---|
| FY2024 Revenue | $7.2B |
| 2023 Revenue | $7.43B |
| Sites / Countries | 35 / 14 |
| Certifications | ISO 13485, AS9100, ITAR |
What is included in the product
Detailed Word Document
Delivers a strategic overview of Sanmina’s internal capabilities and external market factors, outlining strengths, weaknesses, opportunities, and threats to assess competitive position and inform growth and risk-management strategies.
Customizable Excel Spreadsheet
Provides a concise Sanmina SWOT matrix for fast, visual alignment of manufacturing, supply‑chain and technology risks and opportunities to speed strategic decisions.
Weaknesses
Low-margin EMS profile
Sanmina faces a low-margin EMS profile: industry gross margins ran roughly 4–8% in 2024, reflecting tight pricing and limited differentiation on commoditized builds. Margins are volatile from input-cost swings and frequent price-downs, pressuring operating profit. Value capture hinges on shifting mix to higher-complexity, higher-margin programs and disciplined program selection. Sustained profitability requires rigorous cost control and portfolio discipline.
Customer concentration risk
Sanmina faces pronounced customer concentration risk: large OEMs drive a substantial portion of revenue (FY2024 revenue roughly $7.8 billion), so program wins or losses can materially swing plant utilization and quarterly results. High concentration weakens pricing leverage at renewals, and diversification across end markets and customers remains a persistent strategic challenge.
Working capital intensity
Working capital intensity is a key weakness for Sanmina (NASDAQ: SANM), as high inventory and receivables—especially for long lead-time components—tie up cash and raise the risk of excess and obsolete write-downs when demand shifts; cash conversion cycles remain highly sensitive to supplier and customer terms, so tight working-capital management is essential to fund growth without diluting returns.
Exposure to cyclicality
Exposure to cyclicality: end markets such as networking, industrial and semiconductor‑equipment are highly cyclical; downturns can sharply reduce volumes and leave Sanmina's fixed-cost base under‑absorbed, pressuring margins. Forecast misses cascade through the supply chain, limiting revenue visibility despite long customer relationships; Sanmina reported revenue of about $8.9B in FY2023, highlighting scale but not immunity.
- Vulnerability: networking/industrial/semicap cyclical demand
- Margin risk: fixed-cost under‑absorption
- Forecast risk: cascading supply‑chain impacts
- Revenue visibility: limited despite long relationships
Limited brand pull
Sanmina’s limited brand pull leaves it dependent on OEM brands that drive end-customer demand, constraining its ability to pass through costs or upsell without demonstrable value-add; FY2024 revenue was about $7.3 billion, yet marketing leverage remains weaker than product-owning OEMs. Differentiation must come from engineering, quality and execution to capture margin and win OEM-design wins.
- OEM-driven demand limits pricing power
- FY2024 revenue ~ $7.3B
- Must compete on engineering/quality
- Weaker marketing leverage vs OEMs
EMS margins tight; FY2024 revenue $7.8B, margins 4–8%
Low-margin EMS profile (industry gross margins ~4–8% in 2024) and volatile input costs compress operating profit. High customer concentration means program swings materially affect utilization; FY2024 revenue ~ $7.8B vs FY2023 ~$8.9B. Working-capital intensity and cyclical end markets raise forecast and margin risk.
| Metric | Value |
|---|---|
| FY2024 revenue | $7.8B |
| FY2023 revenue | $8.9B |
| Industry gross margin (2024) | 4–8% |
Same Document Delivered
Sanmina SWOT Analysis
This is the actual Sanmina SWOT analysis document you’ll receive upon purchase—no surprises, just professional quality. The preview below is taken directly from the full report and reflects the same structure, insights, and data you’ll download after checkout. Purchase unlocks the complete, editable version for immediate use.











