SAP PESTLE Analysis

Your Competitive Advantage Starts with This Report
Discover how political, economic, social, technological, legal, and environmental forces are shaping SAP's strategy and growth prospects in our tailored PESTLE Analysis. Ideal for investors, consultants, and strategists, it translates external trends into actionable insight. Purchase the full report to access detailed, ready-to-use findings and forecasts.
Political factors

Data sovereignty and localization
Governments increasingly mandate that citizen and sensitive data stay within national borders, forcing SAP to architect cloud regions and choose hyperscaler partners to meet dozens of localization regimes; GDPR, HIPAA and sectoral rules plus region-specific laws in India and the Middle East drive this trend. GDPR fines exceeded roughly €2.1 billion by 2023, illustrating regulatory risk. Compliance alters latency, cost and availability trade-offs and can raise deployment complexity and TCO. To win public-sector and regulated-industry deals SAP must offer region-specific hosting, encryption and granular admin controls while divergent EU, US, Indian and Middle East rules complicate global rollouts and support models.
Public-sector digitalization spend
National modernization programs, backed by initiatives like the EU Recovery and Resilience Facility totaling €723.8 billion, drive large ERP, finance and HR transformations that form strategic pipelines for SAP. Procurement rules and local content requirements lengthen sales cycles—commonly 6 to 24 months—and shape partner selection. Budget resets after elections can re-prioritize projects within months, affecting backlog visibility, while strong government reference wins boost credibility across adjacent industries.

Geopolitical fragmentation and supply chain policy
Trade tensions and reshoring drive demand for resilient supply-chain suites, boosting the addressable market for SAP's SCM and cloud logistics as firms diversify suppliers; SAP serves ~440,000 customers across 180 countries. Sanctions and export controls increasingly restrict customers and components, forcing rigorous screening and partner vetting. Multi-country compliance modeling is a clear differentiator in SAP’s SCM and GRC portfolios. Political risk raises implementation complexity and total cost of ownership.

Tax and incentives for cloud infrastructure
Cloud-friendly tax credits and data-center incentives materially shape SAP’s cloud-region placement and TCO, while OECD Pillar Two 15% global minimum tax (effective 2023) and divergent VAT/GST rules shift pricing and margins across jurisdictions. UK digital services tax at 2% and country-level incentives (eg Ireland 12.5% corporate tax) change effective tax rates. Alignment with FedRAMP/Gaia-X-style frameworks eases entry to regulated markets; incentive volatility can swing long-term ROI.
- Tax credits reduce capex/OPEX for new regions
- Pillar Two 15% raises floor on profits
- UK DST 2% impacts cloud pricing
- Regulatory alignment speeds market access
- Incentive volatility alters IRR
Cyber sovereignty and national security mandates
Security certifications such as FedRAMP, BSI C5 and IRAP are de facto prerequisites for public-sector and defense workloads; FedRAMP lists over 500 authorized offerings as of June 2025. Governments now mandate auditable supply chains and secure-by-design software, forcing SAP to embed classification and access controls into roadmaps and operating models. Noncompliance risks exclusion from high-value public contracts and defense segments.
- Certifications: FedRAMP, BSI C5, IRAP required
- Mandate: auditable supply chains, secure-by-design
- Impact: shapes product roadmap & operating model
- Risk: exclusion from high-value public/defense deals
Data localization, FedRAMP 500+ and Pillar Two 15% reshape cloud-region strategy and margins
Rising data localization, sanctions and certification mandates (FedRAMP 500+ authorizations as of Jun 2025) increase SAP implementation complexity, TCO and sales cycle length; public-sector pipelines are fueled by EU Recovery & Resilience Facility €723.8B. Tax shifts (OECD Pillar Two 15%, UK DST 2%) and incentives shape cloud-region placement and margins.
| Metric | Value |
|---|---|
| SAP customers | ~440,000 (180 countries) |
| GDPR fines | €2.1B (by 2023) |
| FedRAMP | 500+ authorizations (Jun 2025) |
| Pillar Two | 15% global minimum tax (2023) |
What is included in the product
 Detailed Word Document
Explores how macro-environmental forces—Political, Economic, Social, Technological, Environmental, and Legal—specifically impact SAP, combining current data and trends with industry- and region-specific examples. Designed for executives and investors, it highlights risks, opportunities, and forward-looking insights to inform strategy, compliance, and growth planning.

 Customizable Excel Spreadsheet
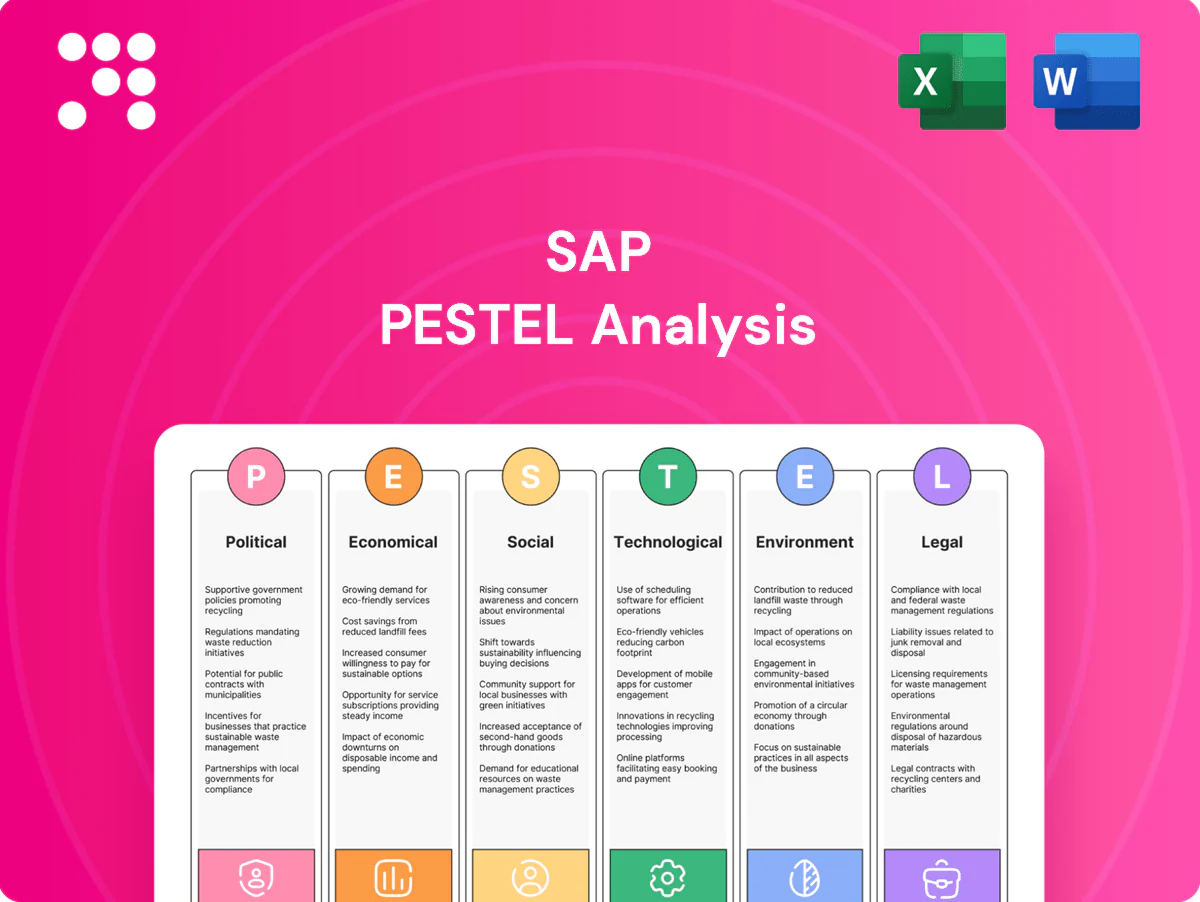
A condensed SAP PESTLE summary, visually segmented by category, that streamlines stakeholder briefings and supports rapid decision-making by highlighting key external risks and strategic implications for specific regions or business units.
Economic factors

Enterprise IT budget cycles
Macro slowdowns elongate sales cycles and push customers toward modular, proof-of-ROI purchases, while growth periods unlock multi-year transformation programs that favor SAP’s integrated suite; global IT spending exceeded 4 trillion USD in 2024, amplifying both dynamics. CFO scrutiny prioritizes cost-to-serve, automation, and consolidation benefits, driving demand for TCO reductions. Predictable subscription revenue smooths but does not eliminate cyclicality.
Currency volatility and global exposure
SAP’s multinational revenue—about €35.4 billion in FY2024—faces FX headwinds/tailwinds that materially affect reported results and pricing, with currency swings shifting cloud ARR and license conversions. Hedging programs reduce but do not fully neutralize volatility, leaving earnings exposure. Customers in high-inflation markets increasingly prefer consumption-based models to preserve cash flow. Local pricing and billing-currency strategies are used as competitive levers.

Cloud migration economics
Total cost of ownership and faster time-to-value drive cloud ERP and LOB adoption as enterprises shift spending to a public cloud market Gartner estimates at about 597.3 billion USD in 2024; customers balance opex subscriptions versus on-prem capex, shaping SAP’s cloud mix and margin profile. FinOps Foundation reports ~32% average cloud waste, so rightsizing and FinOps tools are essential to avoid overruns, while bundled suites improve unit economics and reduce churn.

Labor market and talent costs
Shortages of SAP-skilled consultants have pushed implementation rates and timelines higher, with labor arbitrage and partner networks increasingly used to fill gaps; delivery centers in cost-advantaged regions (often up to 60–70% lower base labor cost versus North America) help protect margins. Automation, low-code tools and prebuilt accelerators can cut manual effort by as much as 20–30%, partially offsetting wage inflation and rate variability from partners.
- Capacity risk: SAP consultant scarcity raises project costs and lead times
- Partner variability: ecosystems add capacity but widen rate ranges
- Automation offset: low-code/accelerators reduce labor intensity ~20–30%
- Offshoring benefit: delivery centers offer up to 60–70% labor cost savings
Industry-specific cycles
Industry-specific cycles mean SAP sees manufacturing and retail slow or accelerate transformations with demand swings; SAP reported FY2024 revenue of €36.6bn with cloud revenue ~€16.5bn, exposing cloud growth to cyclical end-markets. Regulated or countercyclical sectors like public utilities deliver steadier, multi-year contracts that stabilize cash flows. Industry cloud offerings—accounting for ~40% of new cloud bookings in 2024—embed SAP closer to vertical value creation, and diversified sector exposure reduces revenue volatility.
- Manufacturing/retail: cyclical transformation spend
- Public sector/utilities: stable, multi-year contracts
- Industry cloud: ~40% of 2024 new cloud bookings
- Diversification: lowers revenue volatility
Data localization, FedRAMP 500+ and Pillar Two 15% reshape cloud-region strategy and margins
Macro slowdowns lengthen sales cycles while global IT spend topped 4 trillion USD in 2024, favoring modular buys; SAP reported €36.6bn revenue in FY2024 with cloud ~€16.5bn. FX, hedging and consumption models shape ARR and TCO decisions; Gartner estimated public cloud market ~597.3bn USD in 2024. Consultant shortages raise implementation costs; offshoring can cut base labor by 60–70%.
| Metric | 2024 value |
|---|---|
| Global IT spend | 4+ trillion USD |
| SAP FY2024 revenue | €36.6bn |
| SAP cloud revenue | €16.5bn |
| Public cloud market (Gartner) | 597.3bn USD |
| FinOps avg cloud waste | ~32% |
| Offshore labor savings | 60–70% |
| Industry cloud new bookings | ~40% |
What You See Is What You Get
SAP PESTLE Analysis
The preview shown here is the exact SAP PESTLE Analysis document you’ll receive after purchase—fully formatted and ready to use. This file contains the complete political, economic, social, technological, legal, and environmental assessment for SAP as displayed. No placeholders or teasers—what you see is the final, downloadable report. Instantly available upon payment.

Your Competitive Advantage Starts with This Report
Discover how political, economic, social, technological, legal, and environmental forces are shaping SAP's strategy and growth prospects in our tailored PESTLE Analysis. Ideal for investors, consultants, and strategists, it translates external trends into actionable insight. Purchase the full report to access detailed, ready-to-use findings and forecasts.
Political factors
Data sovereignty and localization
Governments increasingly mandate that citizen and sensitive data stay within national borders, forcing SAP to architect cloud regions and choose hyperscaler partners to meet dozens of localization regimes; GDPR, HIPAA and sectoral rules plus region-specific laws in India and the Middle East drive this trend. GDPR fines exceeded roughly €2.1 billion by 2023, illustrating regulatory risk. Compliance alters latency, cost and availability trade-offs and can raise deployment complexity and TCO. To win public-sector and regulated-industry deals SAP must offer region-specific hosting, encryption and granular admin controls while divergent EU, US, Indian and Middle East rules complicate global rollouts and support models.
Public-sector digitalization spend
National modernization programs, backed by initiatives like the EU Recovery and Resilience Facility totaling €723.8 billion, drive large ERP, finance and HR transformations that form strategic pipelines for SAP. Procurement rules and local content requirements lengthen sales cycles—commonly 6 to 24 months—and shape partner selection. Budget resets after elections can re-prioritize projects within months, affecting backlog visibility, while strong government reference wins boost credibility across adjacent industries.
Geopolitical fragmentation and supply chain policy
Trade tensions and reshoring drive demand for resilient supply-chain suites, boosting the addressable market for SAP's SCM and cloud logistics as firms diversify suppliers; SAP serves ~440,000 customers across 180 countries. Sanctions and export controls increasingly restrict customers and components, forcing rigorous screening and partner vetting. Multi-country compliance modeling is a clear differentiator in SAP’s SCM and GRC portfolios. Political risk raises implementation complexity and total cost of ownership.
Tax and incentives for cloud infrastructure
Cloud-friendly tax credits and data-center incentives materially shape SAP’s cloud-region placement and TCO, while OECD Pillar Two 15% global minimum tax (effective 2023) and divergent VAT/GST rules shift pricing and margins across jurisdictions. UK digital services tax at 2% and country-level incentives (eg Ireland 12.5% corporate tax) change effective tax rates. Alignment with FedRAMP/Gaia-X-style frameworks eases entry to regulated markets; incentive volatility can swing long-term ROI.
- Tax credits reduce capex/OPEX for new regions
- Pillar Two 15% raises floor on profits
- UK DST 2% impacts cloud pricing
- Regulatory alignment speeds market access
- Incentive volatility alters IRR
Cyber sovereignty and national security mandates
Security certifications such as FedRAMP, BSI C5 and IRAP are de facto prerequisites for public-sector and defense workloads; FedRAMP lists over 500 authorized offerings as of June 2025. Governments now mandate auditable supply chains and secure-by-design software, forcing SAP to embed classification and access controls into roadmaps and operating models. Noncompliance risks exclusion from high-value public contracts and defense segments.
- Certifications: FedRAMP, BSI C5, IRAP required
- Mandate: auditable supply chains, secure-by-design
- Impact: shapes product roadmap & operating model
- Risk: exclusion from high-value public/defense deals
Data localization, FedRAMP 500+ and Pillar Two 15% reshape cloud-region strategy and margins
Rising data localization, sanctions and certification mandates (FedRAMP 500+ authorizations as of Jun 2025) increase SAP implementation complexity, TCO and sales cycle length; public-sector pipelines are fueled by EU Recovery & Resilience Facility €723.8B. Tax shifts (OECD Pillar Two 15%, UK DST 2%) and incentives shape cloud-region placement and margins.
| Metric | Value |
|---|---|
| SAP customers | ~440,000 (180 countries) |
| GDPR fines | €2.1B (by 2023) |
| FedRAMP | 500+ authorizations (Jun 2025) |
| Pillar Two | 15% global minimum tax (2023) |
What is included in the product
Detailed Word Document
Explores how macro-environmental forces—Political, Economic, Social, Technological, Environmental, and Legal—specifically impact SAP, combining current data and trends with industry- and region-specific examples. Designed for executives and investors, it highlights risks, opportunities, and forward-looking insights to inform strategy, compliance, and growth planning.
Customizable Excel Spreadsheet
A condensed SAP PESTLE summary, visually segmented by category, that streamlines stakeholder briefings and supports rapid decision-making by highlighting key external risks and strategic implications for specific regions or business units.
Economic factors
Enterprise IT budget cycles
Macro slowdowns elongate sales cycles and push customers toward modular, proof-of-ROI purchases, while growth periods unlock multi-year transformation programs that favor SAP’s integrated suite; global IT spending exceeded 4 trillion USD in 2024, amplifying both dynamics. CFO scrutiny prioritizes cost-to-serve, automation, and consolidation benefits, driving demand for TCO reductions. Predictable subscription revenue smooths but does not eliminate cyclicality.
Currency volatility and global exposure
SAP’s multinational revenue—about €35.4 billion in FY2024—faces FX headwinds/tailwinds that materially affect reported results and pricing, with currency swings shifting cloud ARR and license conversions. Hedging programs reduce but do not fully neutralize volatility, leaving earnings exposure. Customers in high-inflation markets increasingly prefer consumption-based models to preserve cash flow. Local pricing and billing-currency strategies are used as competitive levers.
Cloud migration economics
Total cost of ownership and faster time-to-value drive cloud ERP and LOB adoption as enterprises shift spending to a public cloud market Gartner estimates at about 597.3 billion USD in 2024; customers balance opex subscriptions versus on-prem capex, shaping SAP’s cloud mix and margin profile. FinOps Foundation reports ~32% average cloud waste, so rightsizing and FinOps tools are essential to avoid overruns, while bundled suites improve unit economics and reduce churn.
Labor market and talent costs
Shortages of SAP-skilled consultants have pushed implementation rates and timelines higher, with labor arbitrage and partner networks increasingly used to fill gaps; delivery centers in cost-advantaged regions (often up to 60–70% lower base labor cost versus North America) help protect margins. Automation, low-code tools and prebuilt accelerators can cut manual effort by as much as 20–30%, partially offsetting wage inflation and rate variability from partners.
- Capacity risk: SAP consultant scarcity raises project costs and lead times
- Partner variability: ecosystems add capacity but widen rate ranges
- Automation offset: low-code/accelerators reduce labor intensity ~20–30%
- Offshoring benefit: delivery centers offer up to 60–70% labor cost savings
Industry-specific cycles
Industry-specific cycles mean SAP sees manufacturing and retail slow or accelerate transformations with demand swings; SAP reported FY2024 revenue of €36.6bn with cloud revenue ~€16.5bn, exposing cloud growth to cyclical end-markets. Regulated or countercyclical sectors like public utilities deliver steadier, multi-year contracts that stabilize cash flows. Industry cloud offerings—accounting for ~40% of new cloud bookings in 2024—embed SAP closer to vertical value creation, and diversified sector exposure reduces revenue volatility.
- Manufacturing/retail: cyclical transformation spend
- Public sector/utilities: stable, multi-year contracts
- Industry cloud: ~40% of 2024 new cloud bookings
- Diversification: lowers revenue volatility
Data localization, FedRAMP 500+ and Pillar Two 15% reshape cloud-region strategy and margins
Macro slowdowns lengthen sales cycles while global IT spend topped 4 trillion USD in 2024, favoring modular buys; SAP reported €36.6bn revenue in FY2024 with cloud ~€16.5bn. FX, hedging and consumption models shape ARR and TCO decisions; Gartner estimated public cloud market ~597.3bn USD in 2024. Consultant shortages raise implementation costs; offshoring can cut base labor by 60–70%.
| Metric | 2024 value |
|---|---|
| Global IT spend | 4+ trillion USD |
| SAP FY2024 revenue | €36.6bn |
| SAP cloud revenue | €16.5bn |
| Public cloud market (Gartner) | 597.3bn USD |
| FinOps avg cloud waste | ~32% |
| Offshore labor savings | 60–70% |
| Industry cloud new bookings | ~40% |
What You See Is What You Get
SAP PESTLE Analysis
The preview shown here is the exact SAP PESTLE Analysis document you’ll receive after purchase—fully formatted and ready to use. This file contains the complete political, economic, social, technological, legal, and environmental assessment for SAP as displayed. No placeholders or teasers—what you see is the final, downloadable report. Instantly available upon payment.
Original: $10.00
-65%$10.00
$3.50Description
Your Competitive Advantage Starts with This Report
Discover how political, economic, social, technological, legal, and environmental forces are shaping SAP's strategy and growth prospects in our tailored PESTLE Analysis. Ideal for investors, consultants, and strategists, it translates external trends into actionable insight. Purchase the full report to access detailed, ready-to-use findings and forecasts.
Political factors
Data sovereignty and localization
Governments increasingly mandate that citizen and sensitive data stay within national borders, forcing SAP to architect cloud regions and choose hyperscaler partners to meet dozens of localization regimes; GDPR, HIPAA and sectoral rules plus region-specific laws in India and the Middle East drive this trend. GDPR fines exceeded roughly €2.1 billion by 2023, illustrating regulatory risk. Compliance alters latency, cost and availability trade-offs and can raise deployment complexity and TCO. To win public-sector and regulated-industry deals SAP must offer region-specific hosting, encryption and granular admin controls while divergent EU, US, Indian and Middle East rules complicate global rollouts and support models.
Public-sector digitalization spend
National modernization programs, backed by initiatives like the EU Recovery and Resilience Facility totaling €723.8 billion, drive large ERP, finance and HR transformations that form strategic pipelines for SAP. Procurement rules and local content requirements lengthen sales cycles—commonly 6 to 24 months—and shape partner selection. Budget resets after elections can re-prioritize projects within months, affecting backlog visibility, while strong government reference wins boost credibility across adjacent industries.
Geopolitical fragmentation and supply chain policy
Trade tensions and reshoring drive demand for resilient supply-chain suites, boosting the addressable market for SAP's SCM and cloud logistics as firms diversify suppliers; SAP serves ~440,000 customers across 180 countries. Sanctions and export controls increasingly restrict customers and components, forcing rigorous screening and partner vetting. Multi-country compliance modeling is a clear differentiator in SAP’s SCM and GRC portfolios. Political risk raises implementation complexity and total cost of ownership.
Tax and incentives for cloud infrastructure
Cloud-friendly tax credits and data-center incentives materially shape SAP’s cloud-region placement and TCO, while OECD Pillar Two 15% global minimum tax (effective 2023) and divergent VAT/GST rules shift pricing and margins across jurisdictions. UK digital services tax at 2% and country-level incentives (eg Ireland 12.5% corporate tax) change effective tax rates. Alignment with FedRAMP/Gaia-X-style frameworks eases entry to regulated markets; incentive volatility can swing long-term ROI.
- Tax credits reduce capex/OPEX for new regions
- Pillar Two 15% raises floor on profits
- UK DST 2% impacts cloud pricing
- Regulatory alignment speeds market access
- Incentive volatility alters IRR
Cyber sovereignty and national security mandates
Security certifications such as FedRAMP, BSI C5 and IRAP are de facto prerequisites for public-sector and defense workloads; FedRAMP lists over 500 authorized offerings as of June 2025. Governments now mandate auditable supply chains and secure-by-design software, forcing SAP to embed classification and access controls into roadmaps and operating models. Noncompliance risks exclusion from high-value public contracts and defense segments.
- Certifications: FedRAMP, BSI C5, IRAP required
- Mandate: auditable supply chains, secure-by-design
- Impact: shapes product roadmap & operating model
- Risk: exclusion from high-value public/defense deals
Data localization, FedRAMP 500+ and Pillar Two 15% reshape cloud-region strategy and margins
Rising data localization, sanctions and certification mandates (FedRAMP 500+ authorizations as of Jun 2025) increase SAP implementation complexity, TCO and sales cycle length; public-sector pipelines are fueled by EU Recovery & Resilience Facility €723.8B. Tax shifts (OECD Pillar Two 15%, UK DST 2%) and incentives shape cloud-region placement and margins.
| Metric | Value |
|---|---|
| SAP customers | ~440,000 (180 countries) |
| GDPR fines | €2.1B (by 2023) |
| FedRAMP | 500+ authorizations (Jun 2025) |
| Pillar Two | 15% global minimum tax (2023) |
What is included in the product
Detailed Word Document
Explores how macro-environmental forces—Political, Economic, Social, Technological, Environmental, and Legal—specifically impact SAP, combining current data and trends with industry- and region-specific examples. Designed for executives and investors, it highlights risks, opportunities, and forward-looking insights to inform strategy, compliance, and growth planning.
Customizable Excel Spreadsheet
A condensed SAP PESTLE summary, visually segmented by category, that streamlines stakeholder briefings and supports rapid decision-making by highlighting key external risks and strategic implications for specific regions or business units.
Economic factors
Enterprise IT budget cycles
Macro slowdowns elongate sales cycles and push customers toward modular, proof-of-ROI purchases, while growth periods unlock multi-year transformation programs that favor SAP’s integrated suite; global IT spending exceeded 4 trillion USD in 2024, amplifying both dynamics. CFO scrutiny prioritizes cost-to-serve, automation, and consolidation benefits, driving demand for TCO reductions. Predictable subscription revenue smooths but does not eliminate cyclicality.
Currency volatility and global exposure
SAP’s multinational revenue—about €35.4 billion in FY2024—faces FX headwinds/tailwinds that materially affect reported results and pricing, with currency swings shifting cloud ARR and license conversions. Hedging programs reduce but do not fully neutralize volatility, leaving earnings exposure. Customers in high-inflation markets increasingly prefer consumption-based models to preserve cash flow. Local pricing and billing-currency strategies are used as competitive levers.
Cloud migration economics
Total cost of ownership and faster time-to-value drive cloud ERP and LOB adoption as enterprises shift spending to a public cloud market Gartner estimates at about 597.3 billion USD in 2024; customers balance opex subscriptions versus on-prem capex, shaping SAP’s cloud mix and margin profile. FinOps Foundation reports ~32% average cloud waste, so rightsizing and FinOps tools are essential to avoid overruns, while bundled suites improve unit economics and reduce churn.
Labor market and talent costs
Shortages of SAP-skilled consultants have pushed implementation rates and timelines higher, with labor arbitrage and partner networks increasingly used to fill gaps; delivery centers in cost-advantaged regions (often up to 60–70% lower base labor cost versus North America) help protect margins. Automation, low-code tools and prebuilt accelerators can cut manual effort by as much as 20–30%, partially offsetting wage inflation and rate variability from partners.
- Capacity risk: SAP consultant scarcity raises project costs and lead times
- Partner variability: ecosystems add capacity but widen rate ranges
- Automation offset: low-code/accelerators reduce labor intensity ~20–30%
- Offshoring benefit: delivery centers offer up to 60–70% labor cost savings
Industry-specific cycles
Industry-specific cycles mean SAP sees manufacturing and retail slow or accelerate transformations with demand swings; SAP reported FY2024 revenue of €36.6bn with cloud revenue ~€16.5bn, exposing cloud growth to cyclical end-markets. Regulated or countercyclical sectors like public utilities deliver steadier, multi-year contracts that stabilize cash flows. Industry cloud offerings—accounting for ~40% of new cloud bookings in 2024—embed SAP closer to vertical value creation, and diversified sector exposure reduces revenue volatility.
- Manufacturing/retail: cyclical transformation spend
- Public sector/utilities: stable, multi-year contracts
- Industry cloud: ~40% of 2024 new cloud bookings
- Diversification: lowers revenue volatility
Data localization, FedRAMP 500+ and Pillar Two 15% reshape cloud-region strategy and margins
Macro slowdowns lengthen sales cycles while global IT spend topped 4 trillion USD in 2024, favoring modular buys; SAP reported €36.6bn revenue in FY2024 with cloud ~€16.5bn. FX, hedging and consumption models shape ARR and TCO decisions; Gartner estimated public cloud market ~597.3bn USD in 2024. Consultant shortages raise implementation costs; offshoring can cut base labor by 60–70%.
| Metric | 2024 value |
|---|---|
| Global IT spend | 4+ trillion USD |
| SAP FY2024 revenue | €36.6bn |
| SAP cloud revenue | €16.5bn |
| Public cloud market (Gartner) | 597.3bn USD |
| FinOps avg cloud waste | ~32% |
| Offshore labor savings | 60–70% |
| Industry cloud new bookings | ~40% |
What You See Is What You Get
SAP PESTLE Analysis
The preview shown here is the exact SAP PESTLE Analysis document you’ll receive after purchase—fully formatted and ready to use. This file contains the complete political, economic, social, technological, legal, and environmental assessment for SAP as displayed. No placeholders or teasers—what you see is the final, downloadable report. Instantly available upon payment.











