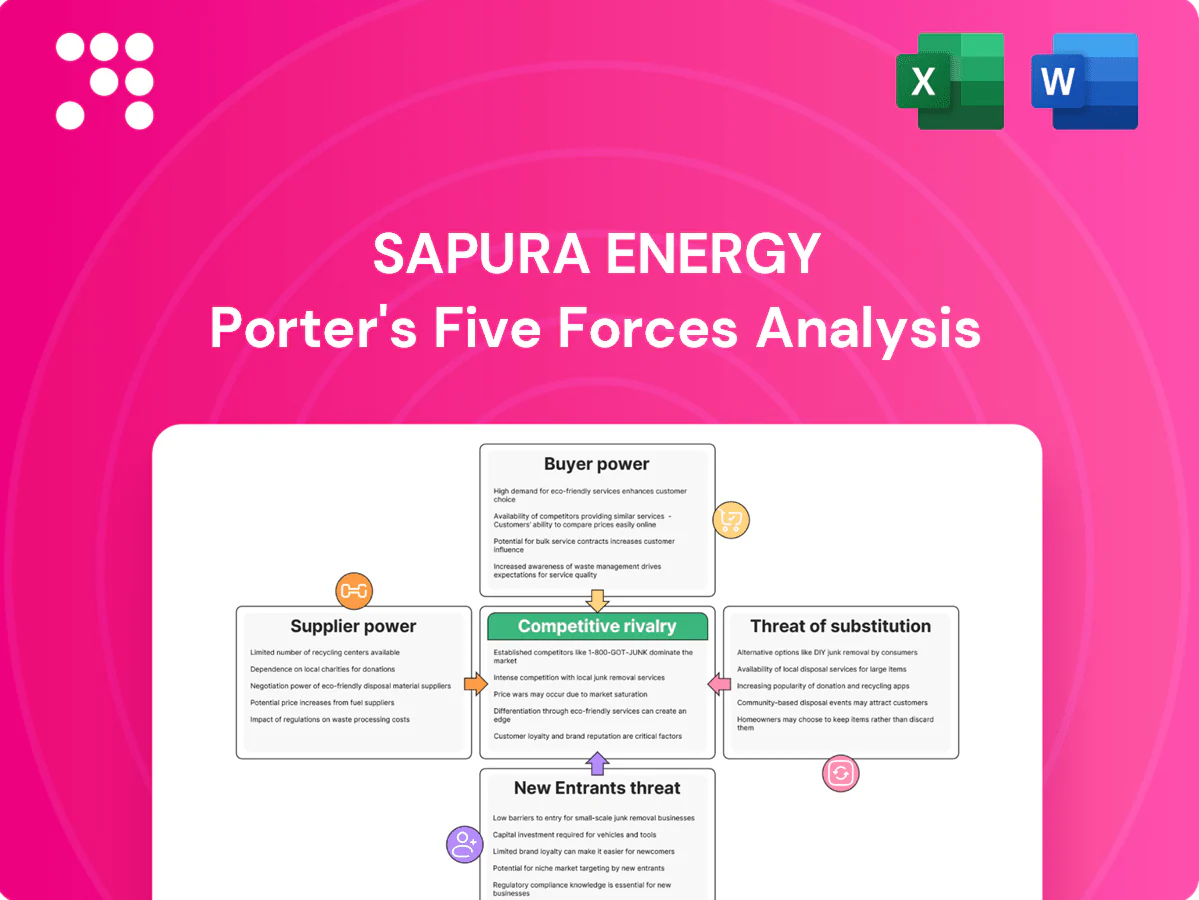
Sapura Energy Porter's Five Forces Analysis

Don't Miss the Bigger Picture
Sapura Energy faces intense competitive rivalry driven by project tendering, asset cycles and price-sensitive clients. Supplier power is moderated by specialist equipment vendors while buyer bargaining and geopolitical risks heighten margin pressure. Threats from new entrants and substitutes are limited but technological shifts and the energy transition create strategic uncertainty. This brief snapshot only scratches the surface. Unlock the full Porter's Five Forces Analysis to explore Sapura Energy’s competitive dynamics, market pressures, and strategic advantages in detail.
Suppliers Bargaining Power

Concentrated specialty equipment vendors
High-spec rigs, subsea trees and SURF gear come from a handful of OEMs (Aker Solutions, TechnipFMC, Baker Hughes, OneSubsea), giving suppliers pricing and delivery leverage; Rystad Energy 2024 noted subsea tree lead times commonly of 18–24 months. Long lead times and certification needs curtail mid‑project switching. Sapura mitigates via framework agreements and multi‑vendor qualification, but bespoke project specs still create supplier lock‑in.
Marine assets and vessel charters
Heavy-lift, pipelay and DSV charters tightened in 2024 as demand outstripped supply, with industry reports noting pipelay rates around $300,000/day and DSVs typically $80,000–120,000/day, pushing charter costs up roughly 25–40% YoY (Clarksons/industry 2024), shifting schedule and standby risk onto contractors.

Skilled labor and niche subcontractors
In 2024 experienced offshore crews, welders and engineers remain scarce during peak cycles, raising supplier leverage over Sapura Energy; unions, certifications and stringent HSE rules drive wage pressure and higher compliance costs. Critical subcontractors for ROV, NDT and geotech command premium pricing, while targeted talent-retention programs partially mitigate churn and blunt short-term cost spikes.

Raw materials and steel-intensive inputs
Steel plate, line pipe and alloy inputs expose Sapura Energy projects to commodity volatility: 2024 HRC averaged about $750/t while line-pipe-grade steels traded near $900–1,200/t, allowing suppliers to pass through escalations late in EPCIC with limited hedging options; early procurement and index-linked clauses materially cut exposure, though logistics bottlenecks still shift 5–15% cost and delay risk to owners.
- Price volatility: HRC ~750/t (2024)
- Line pipe: ~900–1,200/t (2024)
- Mitigation: early procurement, index clauses
- Residual risk: logistics add 5–15% cost/delay
Local content and regulatory gatekeepers
Local content mandates and licensing bodies such as PETRONAS act as de facto suppliers of market access for Sapura Energy, with PETRONAS approvals required for major upstream contracts in 2024. Compliance often mandates use of certified local vendors, narrowing sourcing flexibility and weakening Sapura's bargaining stance with equipment and service providers. Strategic joint ventures with local firms align incentives, expand capacity and partially restore procurement leverage.
- Regulatory gatekeeper: PETRONAS (2024)
- Effect: mandated local vendors reduce sourcing flexibility
- Mitigation: JV partnerships improve capacity and alignment
Concentrated OEM supply, 18–24m subsea-tree LTs and $300k/day pipelay tighten supplier power
Supplier concentration in OEMs (Aker, TechnipFMC, Baker Hughes, OneSubsea) gives strong pricing/delivery leverage; subsea tree lead times 18–24 months (Rystad 2024) limit switching. Charter shortages pushed pipelay ~$300k/day and DSVs $80–120k/day in 2024, transferring schedule risk. Commodity-driven input costs (HRC ~$750/t; line pipe $900–1,200/t) plus logistics (5–15% impact) sustain supplier power.
| Metric | 2024 |
|---|---|
| Subsea tree LT | 18–24m |
| Pipelay rate | $300k/day |
| DSV rate | $80–120k/day |
| HRC | $750/t |
| Line pipe | $900–1,200/t |
| Logistics impact | 5–15% |
What is included in the product
 Detailed Word Document
Tailored Porter’s Five Forces analysis of Sapura Energy uncovering competitive intensity, supplier and buyer power, entry barriers, substitute threats, and disruptive forces shaping its pricing, profitability and strategic positioning.

 Customizable Excel Spreadsheet
One-sheet Porter's Five Forces for Sapura Energy—quickly spot supplier/customer leverage, rival intensity, and regulatory or entrant threats to unblock strategic decisions and paste straight into pitch decks or boardroom slides.
Customers Bargaining Power

Concentrated NOCs and IOCs
Concentrated buyers such as PETRONAS and major IOCs are few, large, and highly sophisticated, creating strong buyer power that forces Sapura Energy into fiercely competitive tendering processes.
These buyers increasingly demand lump-sum or risk-sharing contracts and use stringent vendor lists and prequalification gates to compress margins and limit supplier options.
Consequently, relationship depth, certified past performance, and proven execution on similar projects are decisive differentiators when competing for awarded work.
Price sensitivity and budget cycles
Capex deferrals during oil price dips—Brent averaged about $86/bbl in 2024—have amplified pricing pressure on contractors, forcing Sapura to absorb tighter bids and longer receivable cycles. Clients increasingly demand detailed cost breakdowns, value engineering proposals and schedule accelerations to unlock spends. Framework rates are renegotiated frequently, so Sapura must prove total cost-of-ownership benefits to defend margins.

Technical specification control
Clients enforce API/ISO and project-specific specs, plus change orders that shift up to 15–25% of scope risk onto contractors; extensive documentation and QA/assurance raise bid costs materially (often adding mid-single-digit percentage to capex). Performance bonds and liquidated damages, commonly 0.1–0.5% per day, increase downside exposure. Digital traceability can improve trust and reduce disputes but adds compliance and OPEX overhead.

Backward integration and multi-sourcing
In 2024 buyers accelerated backward integration, developing in-house engineering and project management to shrink supplier scope and reduce dependence. They routinely split packages across 3–5 contractors to maintain leverage while umbrella agreements enable switching within 30–90 days if performance lags. Adherence to strict KPIs and SLAs is essential for Sapura Energy to retain share.
- In-house engineering reduces outsourced scope
- Split packages: 3–5 contractors
- Umbrella agreements: 30–90 day switch
- Strict KPIs/SLA adherence required
Global sourcing reach
Clients can source regionally or globally, arbitraging price and capacity across markets which intensifies price pressure on Sapura Energy; Brent averaged about US$83/bbl in 2024, keeping major clients cost-focused. Local content rules in Malaysia and other jurisdictions temper but do not eliminate cross-border sourcing. Continuous benchmarking across peers compresses margins, while integrated EPCIC-plus-drilling packages raise switching costs and improve bid competitiveness.
- Global sourcing enables price arbitrage
- Local content limits but doesn't prevent switching
- Peer benchmarking tightens margins
- EPCIC+drilling increases switching costs
Concentrated buyers drive aggressive tendering, margin compression and higher bid costs
Concentrated buyers (PETRONAS, major IOCs) exert strong bargaining power, driving aggressive tendering and margin compression for Sapura Energy.
Buyers demand lump-sum/risk-share contracts, strict specs and shift 15–25% scope risk, raising bid costs by mid-single-digit percent and exposing contractors to 0.1–0.5%/day liquidated damages.
Backward integration, split packages (3–5 contractors), 30–90 day umbrella switching and global sourcing—with Brent ≈ US$86/bbl in 2024—keep clients intensely cost-focused.
| Metric | 2024 Value | Impact |
|---|---|---|
| Brent | US$86/bbl | Maintains buyer cost focus |
| Scope risk shifted | 15–25% | Higher bid contingency |
| Liquidated damages | 0.1–0.5%/day | Downside exposure |
| Contract splitting | 3–5 contractors | Increases competition |
| Umbrella switch | 30–90 days | Reduces supplier stickiness |
What You See Is What You Get
Sapura Energy Porter's Five Forces Analysis
This preview shows the exact Sapura Energy Porter’s Five Forces analysis you’ll receive immediately after purchase—no placeholders or samples. The full document is professionally formatted, ready for download and use the moment you buy. What you see here is the actual deliverable, available instantly upon payment.

Don't Miss the Bigger Picture
Sapura Energy faces intense competitive rivalry driven by project tendering, asset cycles and price-sensitive clients. Supplier power is moderated by specialist equipment vendors while buyer bargaining and geopolitical risks heighten margin pressure. Threats from new entrants and substitutes are limited but technological shifts and the energy transition create strategic uncertainty. This brief snapshot only scratches the surface. Unlock the full Porter's Five Forces Analysis to explore Sapura Energy’s competitive dynamics, market pressures, and strategic advantages in detail.
Suppliers Bargaining Power
Concentrated specialty equipment vendors
High-spec rigs, subsea trees and SURF gear come from a handful of OEMs (Aker Solutions, TechnipFMC, Baker Hughes, OneSubsea), giving suppliers pricing and delivery leverage; Rystad Energy 2024 noted subsea tree lead times commonly of 18–24 months. Long lead times and certification needs curtail mid‑project switching. Sapura mitigates via framework agreements and multi‑vendor qualification, but bespoke project specs still create supplier lock‑in.
Marine assets and vessel charters
Heavy-lift, pipelay and DSV charters tightened in 2024 as demand outstripped supply, with industry reports noting pipelay rates around $300,000/day and DSVs typically $80,000–120,000/day, pushing charter costs up roughly 25–40% YoY (Clarksons/industry 2024), shifting schedule and standby risk onto contractors.
Skilled labor and niche subcontractors
In 2024 experienced offshore crews, welders and engineers remain scarce during peak cycles, raising supplier leverage over Sapura Energy; unions, certifications and stringent HSE rules drive wage pressure and higher compliance costs. Critical subcontractors for ROV, NDT and geotech command premium pricing, while targeted talent-retention programs partially mitigate churn and blunt short-term cost spikes.
Raw materials and steel-intensive inputs
Steel plate, line pipe and alloy inputs expose Sapura Energy projects to commodity volatility: 2024 HRC averaged about $750/t while line-pipe-grade steels traded near $900–1,200/t, allowing suppliers to pass through escalations late in EPCIC with limited hedging options; early procurement and index-linked clauses materially cut exposure, though logistics bottlenecks still shift 5–15% cost and delay risk to owners.
- Price volatility: HRC ~750/t (2024)
- Line pipe: ~900–1,200/t (2024)
- Mitigation: early procurement, index clauses
- Residual risk: logistics add 5–15% cost/delay
Local content and regulatory gatekeepers
Local content mandates and licensing bodies such as PETRONAS act as de facto suppliers of market access for Sapura Energy, with PETRONAS approvals required for major upstream contracts in 2024. Compliance often mandates use of certified local vendors, narrowing sourcing flexibility and weakening Sapura's bargaining stance with equipment and service providers. Strategic joint ventures with local firms align incentives, expand capacity and partially restore procurement leverage.
- Regulatory gatekeeper: PETRONAS (2024)
- Effect: mandated local vendors reduce sourcing flexibility
- Mitigation: JV partnerships improve capacity and alignment
Concentrated OEM supply, 18–24m subsea-tree LTs and $300k/day pipelay tighten supplier power
Supplier concentration in OEMs (Aker, TechnipFMC, Baker Hughes, OneSubsea) gives strong pricing/delivery leverage; subsea tree lead times 18–24 months (Rystad 2024) limit switching. Charter shortages pushed pipelay ~$300k/day and DSVs $80–120k/day in 2024, transferring schedule risk. Commodity-driven input costs (HRC ~$750/t; line pipe $900–1,200/t) plus logistics (5–15% impact) sustain supplier power.
| Metric | 2024 |
|---|---|
| Subsea tree LT | 18–24m |
| Pipelay rate | $300k/day |
| DSV rate | $80–120k/day |
| HRC | $750/t |
| Line pipe | $900–1,200/t |
| Logistics impact | 5–15% |
What is included in the product
Detailed Word Document
Tailored Porter’s Five Forces analysis of Sapura Energy uncovering competitive intensity, supplier and buyer power, entry barriers, substitute threats, and disruptive forces shaping its pricing, profitability and strategic positioning.
Customizable Excel Spreadsheet
One-sheet Porter's Five Forces for Sapura Energy—quickly spot supplier/customer leverage, rival intensity, and regulatory or entrant threats to unblock strategic decisions and paste straight into pitch decks or boardroom slides.
Customers Bargaining Power
Concentrated NOCs and IOCs
Concentrated buyers such as PETRONAS and major IOCs are few, large, and highly sophisticated, creating strong buyer power that forces Sapura Energy into fiercely competitive tendering processes.
These buyers increasingly demand lump-sum or risk-sharing contracts and use stringent vendor lists and prequalification gates to compress margins and limit supplier options.
Consequently, relationship depth, certified past performance, and proven execution on similar projects are decisive differentiators when competing for awarded work.
Price sensitivity and budget cycles
Capex deferrals during oil price dips—Brent averaged about $86/bbl in 2024—have amplified pricing pressure on contractors, forcing Sapura to absorb tighter bids and longer receivable cycles. Clients increasingly demand detailed cost breakdowns, value engineering proposals and schedule accelerations to unlock spends. Framework rates are renegotiated frequently, so Sapura must prove total cost-of-ownership benefits to defend margins.
Technical specification control
Clients enforce API/ISO and project-specific specs, plus change orders that shift up to 15–25% of scope risk onto contractors; extensive documentation and QA/assurance raise bid costs materially (often adding mid-single-digit percentage to capex). Performance bonds and liquidated damages, commonly 0.1–0.5% per day, increase downside exposure. Digital traceability can improve trust and reduce disputes but adds compliance and OPEX overhead.
Backward integration and multi-sourcing
In 2024 buyers accelerated backward integration, developing in-house engineering and project management to shrink supplier scope and reduce dependence. They routinely split packages across 3–5 contractors to maintain leverage while umbrella agreements enable switching within 30–90 days if performance lags. Adherence to strict KPIs and SLAs is essential for Sapura Energy to retain share.
- In-house engineering reduces outsourced scope
- Split packages: 3–5 contractors
- Umbrella agreements: 30–90 day switch
- Strict KPIs/SLA adherence required
Global sourcing reach
Clients can source regionally or globally, arbitraging price and capacity across markets which intensifies price pressure on Sapura Energy; Brent averaged about US$83/bbl in 2024, keeping major clients cost-focused. Local content rules in Malaysia and other jurisdictions temper but do not eliminate cross-border sourcing. Continuous benchmarking across peers compresses margins, while integrated EPCIC-plus-drilling packages raise switching costs and improve bid competitiveness.
- Global sourcing enables price arbitrage
- Local content limits but doesn't prevent switching
- Peer benchmarking tightens margins
- EPCIC+drilling increases switching costs
Concentrated buyers drive aggressive tendering, margin compression and higher bid costs
Concentrated buyers (PETRONAS, major IOCs) exert strong bargaining power, driving aggressive tendering and margin compression for Sapura Energy.
Buyers demand lump-sum/risk-share contracts, strict specs and shift 15–25% scope risk, raising bid costs by mid-single-digit percent and exposing contractors to 0.1–0.5%/day liquidated damages.
Backward integration, split packages (3–5 contractors), 30–90 day umbrella switching and global sourcing—with Brent ≈ US$86/bbl in 2024—keep clients intensely cost-focused.
| Metric | 2024 Value | Impact |
|---|---|---|
| Brent | US$86/bbl | Maintains buyer cost focus |
| Scope risk shifted | 15–25% | Higher bid contingency |
| Liquidated damages | 0.1–0.5%/day | Downside exposure |
| Contract splitting | 3–5 contractors | Increases competition |
| Umbrella switch | 30–90 days | Reduces supplier stickiness |
What You See Is What You Get
Sapura Energy Porter's Five Forces Analysis
This preview shows the exact Sapura Energy Porter’s Five Forces analysis you’ll receive immediately after purchase—no placeholders or samples. The full document is professionally formatted, ready for download and use the moment you buy. What you see here is the actual deliverable, available instantly upon payment.
Original: $10.00
-65%$10.00
$3.50Description
Don't Miss the Bigger Picture
Sapura Energy faces intense competitive rivalry driven by project tendering, asset cycles and price-sensitive clients. Supplier power is moderated by specialist equipment vendors while buyer bargaining and geopolitical risks heighten margin pressure. Threats from new entrants and substitutes are limited but technological shifts and the energy transition create strategic uncertainty. This brief snapshot only scratches the surface. Unlock the full Porter's Five Forces Analysis to explore Sapura Energy’s competitive dynamics, market pressures, and strategic advantages in detail.
Suppliers Bargaining Power
Concentrated specialty equipment vendors
High-spec rigs, subsea trees and SURF gear come from a handful of OEMs (Aker Solutions, TechnipFMC, Baker Hughes, OneSubsea), giving suppliers pricing and delivery leverage; Rystad Energy 2024 noted subsea tree lead times commonly of 18–24 months. Long lead times and certification needs curtail mid‑project switching. Sapura mitigates via framework agreements and multi‑vendor qualification, but bespoke project specs still create supplier lock‑in.
Marine assets and vessel charters
Heavy-lift, pipelay and DSV charters tightened in 2024 as demand outstripped supply, with industry reports noting pipelay rates around $300,000/day and DSVs typically $80,000–120,000/day, pushing charter costs up roughly 25–40% YoY (Clarksons/industry 2024), shifting schedule and standby risk onto contractors.
Skilled labor and niche subcontractors
In 2024 experienced offshore crews, welders and engineers remain scarce during peak cycles, raising supplier leverage over Sapura Energy; unions, certifications and stringent HSE rules drive wage pressure and higher compliance costs. Critical subcontractors for ROV, NDT and geotech command premium pricing, while targeted talent-retention programs partially mitigate churn and blunt short-term cost spikes.
Raw materials and steel-intensive inputs
Steel plate, line pipe and alloy inputs expose Sapura Energy projects to commodity volatility: 2024 HRC averaged about $750/t while line-pipe-grade steels traded near $900–1,200/t, allowing suppliers to pass through escalations late in EPCIC with limited hedging options; early procurement and index-linked clauses materially cut exposure, though logistics bottlenecks still shift 5–15% cost and delay risk to owners.
- Price volatility: HRC ~750/t (2024)
- Line pipe: ~900–1,200/t (2024)
- Mitigation: early procurement, index clauses
- Residual risk: logistics add 5–15% cost/delay
Local content and regulatory gatekeepers
Local content mandates and licensing bodies such as PETRONAS act as de facto suppliers of market access for Sapura Energy, with PETRONAS approvals required for major upstream contracts in 2024. Compliance often mandates use of certified local vendors, narrowing sourcing flexibility and weakening Sapura's bargaining stance with equipment and service providers. Strategic joint ventures with local firms align incentives, expand capacity and partially restore procurement leverage.
- Regulatory gatekeeper: PETRONAS (2024)
- Effect: mandated local vendors reduce sourcing flexibility
- Mitigation: JV partnerships improve capacity and alignment
Concentrated OEM supply, 18–24m subsea-tree LTs and $300k/day pipelay tighten supplier power
Supplier concentration in OEMs (Aker, TechnipFMC, Baker Hughes, OneSubsea) gives strong pricing/delivery leverage; subsea tree lead times 18–24 months (Rystad 2024) limit switching. Charter shortages pushed pipelay ~$300k/day and DSVs $80–120k/day in 2024, transferring schedule risk. Commodity-driven input costs (HRC ~$750/t; line pipe $900–1,200/t) plus logistics (5–15% impact) sustain supplier power.
| Metric | 2024 |
|---|---|
| Subsea tree LT | 18–24m |
| Pipelay rate | $300k/day |
| DSV rate | $80–120k/day |
| HRC | $750/t |
| Line pipe | $900–1,200/t |
| Logistics impact | 5–15% |
What is included in the product
Detailed Word Document
Tailored Porter’s Five Forces analysis of Sapura Energy uncovering competitive intensity, supplier and buyer power, entry barriers, substitute threats, and disruptive forces shaping its pricing, profitability and strategic positioning.
Customizable Excel Spreadsheet
One-sheet Porter's Five Forces for Sapura Energy—quickly spot supplier/customer leverage, rival intensity, and regulatory or entrant threats to unblock strategic decisions and paste straight into pitch decks or boardroom slides.
Customers Bargaining Power
Concentrated NOCs and IOCs
Concentrated buyers such as PETRONAS and major IOCs are few, large, and highly sophisticated, creating strong buyer power that forces Sapura Energy into fiercely competitive tendering processes.
These buyers increasingly demand lump-sum or risk-sharing contracts and use stringent vendor lists and prequalification gates to compress margins and limit supplier options.
Consequently, relationship depth, certified past performance, and proven execution on similar projects are decisive differentiators when competing for awarded work.
Price sensitivity and budget cycles
Capex deferrals during oil price dips—Brent averaged about $86/bbl in 2024—have amplified pricing pressure on contractors, forcing Sapura to absorb tighter bids and longer receivable cycles. Clients increasingly demand detailed cost breakdowns, value engineering proposals and schedule accelerations to unlock spends. Framework rates are renegotiated frequently, so Sapura must prove total cost-of-ownership benefits to defend margins.
Technical specification control
Clients enforce API/ISO and project-specific specs, plus change orders that shift up to 15–25% of scope risk onto contractors; extensive documentation and QA/assurance raise bid costs materially (often adding mid-single-digit percentage to capex). Performance bonds and liquidated damages, commonly 0.1–0.5% per day, increase downside exposure. Digital traceability can improve trust and reduce disputes but adds compliance and OPEX overhead.
Backward integration and multi-sourcing
In 2024 buyers accelerated backward integration, developing in-house engineering and project management to shrink supplier scope and reduce dependence. They routinely split packages across 3–5 contractors to maintain leverage while umbrella agreements enable switching within 30–90 days if performance lags. Adherence to strict KPIs and SLAs is essential for Sapura Energy to retain share.
- In-house engineering reduces outsourced scope
- Split packages: 3–5 contractors
- Umbrella agreements: 30–90 day switch
- Strict KPIs/SLA adherence required
Global sourcing reach
Clients can source regionally or globally, arbitraging price and capacity across markets which intensifies price pressure on Sapura Energy; Brent averaged about US$83/bbl in 2024, keeping major clients cost-focused. Local content rules in Malaysia and other jurisdictions temper but do not eliminate cross-border sourcing. Continuous benchmarking across peers compresses margins, while integrated EPCIC-plus-drilling packages raise switching costs and improve bid competitiveness.
- Global sourcing enables price arbitrage
- Local content limits but doesn't prevent switching
- Peer benchmarking tightens margins
- EPCIC+drilling increases switching costs
Concentrated buyers drive aggressive tendering, margin compression and higher bid costs
Concentrated buyers (PETRONAS, major IOCs) exert strong bargaining power, driving aggressive tendering and margin compression for Sapura Energy.
Buyers demand lump-sum/risk-share contracts, strict specs and shift 15–25% scope risk, raising bid costs by mid-single-digit percent and exposing contractors to 0.1–0.5%/day liquidated damages.
Backward integration, split packages (3–5 contractors), 30–90 day umbrella switching and global sourcing—with Brent ≈ US$86/bbl in 2024—keep clients intensely cost-focused.
| Metric | 2024 Value | Impact |
|---|---|---|
| Brent | US$86/bbl | Maintains buyer cost focus |
| Scope risk shifted | 15–25% | Higher bid contingency |
| Liquidated damages | 0.1–0.5%/day | Downside exposure |
| Contract splitting | 3–5 contractors | Increases competition |
| Umbrella switch | 30–90 days | Reduces supplier stickiness |
What You See Is What You Get
Sapura Energy Porter's Five Forces Analysis
This preview shows the exact Sapura Energy Porter’s Five Forces analysis you’ll receive immediately after purchase—no placeholders or samples. The full document is professionally formatted, ready for download and use the moment you buy. What you see here is the actual deliverable, available instantly upon payment.











