Savannah Energy Boston Consulting Group Matrix

Visual. Strategic. Downloadable.
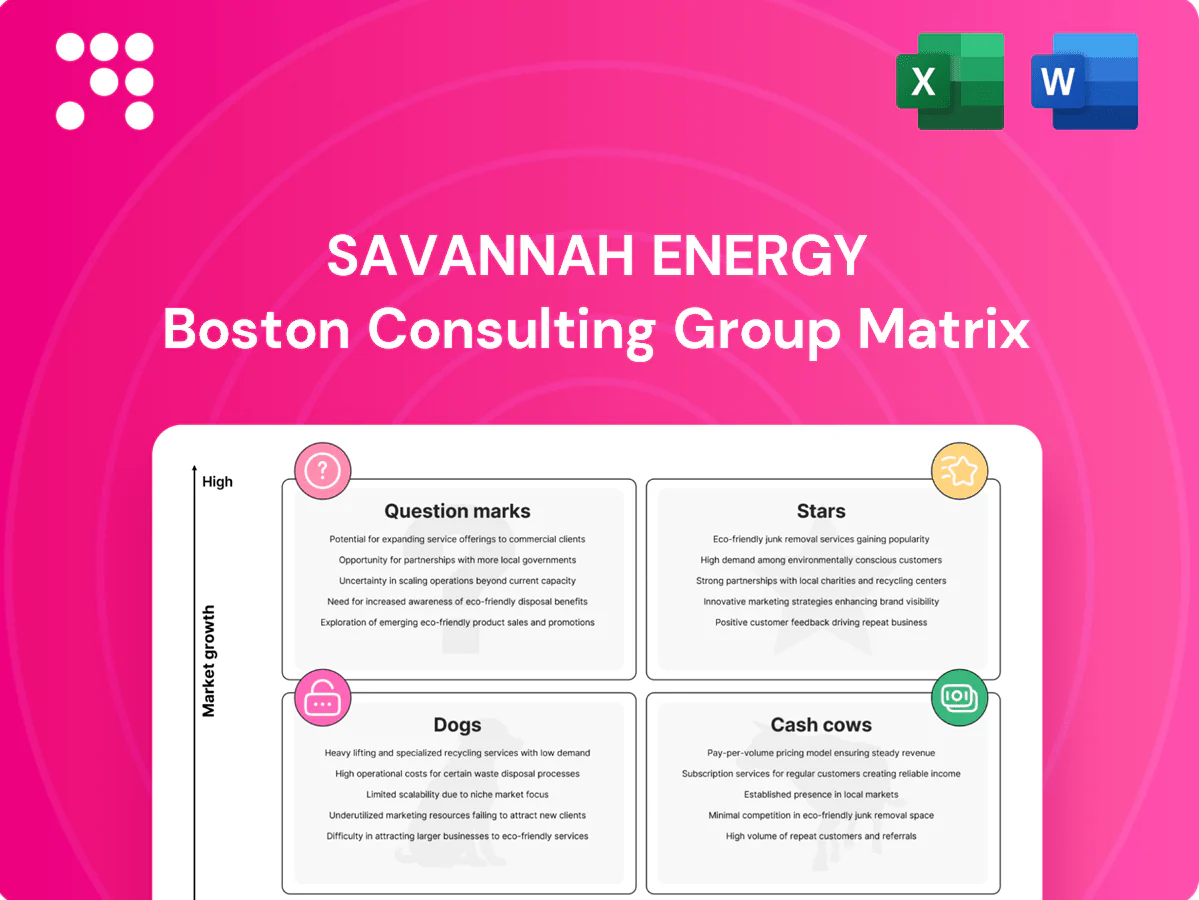
Savannah Energy’s BCG Matrix preview shows where its assets sit in a shifting energy landscape — which units are Stars, which are Cash Cows, and where Question Marks hide opportunity. Want the full picture with quadrant-by-quadrant analysis, clear strategic moves, and numbers that back every recommendation? Purchase the complete BCG Matrix (Word + Excel) for an immediately actionable roadmap to optimize investment and sharpen your portfolio decisions.
Stars

Core gas-to-power leadership
High-growth African electricity demand — IEA projects roughly a 50% rise by 2040 — meets Savannah Energy’s strong gas position, giving high share and momentum. Embedded offtakes and proven reliability make its gas-to-power the go-to supply for utilities. It soaks up capex for drilling and compression, but project returns track reinvestment, so keep feeding it to mature into sustained cash flow.
Leading producing hubs in demand centers
Savannah’s flagship producing assets, supplying roughly 600 MW into fast-growing urban and industrial demand centers, capture scale and pricing power that underpin resilient market share. Regional power demand grew about 5% year-on-year in 2024, keeping reinvestment needs elevated. Priority is to hold share and sustain >95% uptime; with disciplined capex these assets can convert growth into the next cash cows, supporting ~20% reinvestment of EBITDA.

Operator reputation and stakeholder access
Being the reliable African operator, Savannah Energy in 2024 converted reputation into accelerated acreage awards, regulatory approvals and joint-venture partners, creating barriers competitors cannot replicate quickly. That soft power is increasing Savannah’s share as African gas and power markets expand. It requires sustained relationship management and elevated ESG spend; net effect keeps Savannah in a star position worth backing.

Integrated gas marketing and offtake contracts
Long-term offtake contracts lock in volumes as regional markets ramp, converting scale into predictable revenue streams; IEA projects global natural gas demand growth of about 1% in 2024, supporting secured sales momentum.
That blend of scale and contracted demand pushes a high-market-share, high-growth classification in the BCG matrix for Savannah Energy, despite tying up working capital and requiring rigorous operational diligence.
The capital and diligence demands are offset by compounding leadership effects: secured cash flows enable reinvestment and market consolidation, reinforcing durable competitive advantage.
- Secured demand via long-term contracts — supports high share in high-growth markets
- 2024 IEA gas demand +1% — macro tailwind
- Requires working capital and diligence — trade-off for durable leadership
Early mover in utility-scale renewables where active
In a handful of target countries Savannah Energy holds first-wave wind and solar sites with grid access and secured land, converting interconnection viability into meaningful market share and brisk capacity growth as projects advance toward COD. Development burn is material across permitting, environmental and grid studies, and equipment reservations, so targeted equity through COD is required to cement star status. Active sites are positioned to become market-leading utility-scale assets where permitted and contracted.
- Position: early mover in select markets
- Risk: high development burn (permits, studies, equipment locks)
- Action: invest through COD to lock star trajectory
- Outcome: meaningful share and brisk post-COD growth
~600 MW gas fleet, >95% uptime and +5% demand — predictable revenues, ~20% reinvested
Savannah’s gas-to-power Stars combine ~600 MW operating capacity, >95% uptime and regional demand growth ~5% YoY in 2024, giving high share in high-growth markets. Long-term offtakes and IEA 2024 gas +1% underpin predictable revenues but require ~20% EBITDA reinvestment and elevated development capex. Early-stage wind/solar sites need targeted equity through COD to convert into utility-scale Stars.
| Metric | Value | Note |
|---|---|---|
| Operating capacity | ~600 MW | 2024 produced |
| Regional demand | +5% YoY | 2024 |
| Uptime | >95% | operational target |
| Reinvestment | ~20% EBITDA | to sustain growth |
| IEA gas | +1% (2024) | macro tailwind |
What is included in the product
 Detailed Word Document
Comprehensive BCG analysis of Savannah Energy’s units, highlighting Stars, Cash Cows, Question Marks, Dogs and strategic recommendations.

 Customizable Excel Spreadsheet
One-page Savannah Energy BCG Matrix mapping each business unit to quadrants; export-ready for slides and C-level printing.
Cash Cows

Mature oil fields with stable decline
Mature oil fields with stable decline deliver low growth but high share, producing ~29,000 boepd in 2024 and acting as classic milkers with predictable barrels and ~5% annual decline. Minimal promo spend is required—just steady opex and routine workovers—keeping lifting costs near $8/boe. Margins remain attractive if discipline holds, letting cash fund growth projects and service debt.
Tariff-based midstream access
Savannah Energy’s tariff-based midstream access, anchored since its 2021 LSE listing, delivers steady fee income from existing pipeline and processing capacity, with industry-standard uptime above 99% and maintenance capex typically low (around 5–8% of midstream revenues in 2024). Market growth is modest but Savannah’s share is entrenched regionally, so predictable tariffs drive recurring EBITDA. Keeping uptime high and quietly collecting fees preserves cash cow margins.

Legacy gas contracts with bankable counterparties
Legacy gas contracts with bankable counterparties provide Savannah Energy with locked-in pricing and take-or-pay terms that continue to generate predictable cash even in flat 2024 markets. Administration is lighter than upstream development, allowing reinvestment focus on renewals and indexation rather than expansion. Managing contract renewals and CPI/energy-index clauses is more value-accretive than new capex. Maintain performance guarantees to preserve cash flow certainty.

Brownfield infill and debottlenecking
Brownfield infill and debottlenecking are low-risk, short-cycle wins that typically deliver measurable recovery and throughput uplift without altering long-term growth curves; for Savannah Energy these projects prioritize quick paybacks and chunky returns relative to small capital checks.
Maintain a rolling queue of such projects to smooth cash generation and optimize operational cashflow in 2024 market conditions.
- Short-cycle wins: months to ~1–2 years
- High ROI per spend: outsized returns vs capex
- Improves recovery and throughput
- Rolling project queue smooths cash
Ancillary services from existing footprint
Ancillary services using Savannah Energy’s owned power, water and logistics convert sunk infrastructure into steady, low-growth cash cows by delivering incremental revenue with minimal incremental capex; competition rarely challenges the installed base, preserving pricing and utilization. Margins on these services are typically tidy, supporting working capital and covering fixed overhead while operations focus on core production.
- Low-growth, stable revenue stream
- Minimal competition for installed assets
- Sunk costs keep incremental capex low
- Healthy margins that cover fixed costs
- Maintain service levels to sustain cash flow
Mature oil cashflow: 29,000 boepd, 5% decline, lifting ~$8/boe
Mature oil fields: ~29,000 boepd in 2024, ~5% annual decline, lifting cost ~$8/boe, strong free cash. Tariffed midstream: >99% uptime, maintenance capex ~5–8% of midstream revenue, steady fees. Legacy gas contracts: take-or-pay with bankable counterparties, predictable cash. Brownfield/ancillary services: low incremental capex, healthy margins supporting working capital.
| Asset | 2024 metric | Margin/notes |
|---|---|---|
| Upstream | 29,000 boepd; 5% decline | Lifting ~$8/boe |
| Midstream | >99% uptime; m-capex 5–8% | Stable tariffs |
| Gas contracts | Take-or-pay | Predictable cash |
What You’re Viewing Is Included
Savannah Energy BCG Matrix
The file you're previewing is the exact Savannah Energy BCG Matrix you'll receive after purchase. No watermarks or demo text — just a fully formatted, analysis-ready report tailored for strategic clarity. Once bought, the same editable, print-ready document is yours to download and share with your team or investors. Built by strategy experts, it plugs straight into planning, presentations, or board decks with no surprises.

Visual. Strategic. Downloadable.
Savannah Energy’s BCG Matrix preview shows where its assets sit in a shifting energy landscape — which units are Stars, which are Cash Cows, and where Question Marks hide opportunity. Want the full picture with quadrant-by-quadrant analysis, clear strategic moves, and numbers that back every recommendation? Purchase the complete BCG Matrix (Word + Excel) for an immediately actionable roadmap to optimize investment and sharpen your portfolio decisions.
Stars
Core gas-to-power leadership
High-growth African electricity demand — IEA projects roughly a 50% rise by 2040 — meets Savannah Energy’s strong gas position, giving high share and momentum. Embedded offtakes and proven reliability make its gas-to-power the go-to supply for utilities. It soaks up capex for drilling and compression, but project returns track reinvestment, so keep feeding it to mature into sustained cash flow.
Leading producing hubs in demand centers
Savannah’s flagship producing assets, supplying roughly 600 MW into fast-growing urban and industrial demand centers, capture scale and pricing power that underpin resilient market share. Regional power demand grew about 5% year-on-year in 2024, keeping reinvestment needs elevated. Priority is to hold share and sustain >95% uptime; with disciplined capex these assets can convert growth into the next cash cows, supporting ~20% reinvestment of EBITDA.
Operator reputation and stakeholder access
Being the reliable African operator, Savannah Energy in 2024 converted reputation into accelerated acreage awards, regulatory approvals and joint-venture partners, creating barriers competitors cannot replicate quickly. That soft power is increasing Savannah’s share as African gas and power markets expand. It requires sustained relationship management and elevated ESG spend; net effect keeps Savannah in a star position worth backing.
Integrated gas marketing and offtake contracts
Long-term offtake contracts lock in volumes as regional markets ramp, converting scale into predictable revenue streams; IEA projects global natural gas demand growth of about 1% in 2024, supporting secured sales momentum.
That blend of scale and contracted demand pushes a high-market-share, high-growth classification in the BCG matrix for Savannah Energy, despite tying up working capital and requiring rigorous operational diligence.
The capital and diligence demands are offset by compounding leadership effects: secured cash flows enable reinvestment and market consolidation, reinforcing durable competitive advantage.
- Secured demand via long-term contracts — supports high share in high-growth markets
- 2024 IEA gas demand +1% — macro tailwind
- Requires working capital and diligence — trade-off for durable leadership
Early mover in utility-scale renewables where active
In a handful of target countries Savannah Energy holds first-wave wind and solar sites with grid access and secured land, converting interconnection viability into meaningful market share and brisk capacity growth as projects advance toward COD. Development burn is material across permitting, environmental and grid studies, and equipment reservations, so targeted equity through COD is required to cement star status. Active sites are positioned to become market-leading utility-scale assets where permitted and contracted.
- Position: early mover in select markets
- Risk: high development burn (permits, studies, equipment locks)
- Action: invest through COD to lock star trajectory
- Outcome: meaningful share and brisk post-COD growth
~600 MW gas fleet, >95% uptime and +5% demand — predictable revenues, ~20% reinvested
Savannah’s gas-to-power Stars combine ~600 MW operating capacity, >95% uptime and regional demand growth ~5% YoY in 2024, giving high share in high-growth markets. Long-term offtakes and IEA 2024 gas +1% underpin predictable revenues but require ~20% EBITDA reinvestment and elevated development capex. Early-stage wind/solar sites need targeted equity through COD to convert into utility-scale Stars.
| Metric | Value | Note |
|---|---|---|
| Operating capacity | ~600 MW | 2024 produced |
| Regional demand | +5% YoY | 2024 |
| Uptime | >95% | operational target |
| Reinvestment | ~20% EBITDA | to sustain growth |
| IEA gas | +1% (2024) | macro tailwind |
What is included in the product
Detailed Word Document
Comprehensive BCG analysis of Savannah Energy’s units, highlighting Stars, Cash Cows, Question Marks, Dogs and strategic recommendations.
Customizable Excel Spreadsheet
One-page Savannah Energy BCG Matrix mapping each business unit to quadrants; export-ready for slides and C-level printing.
Cash Cows
Mature oil fields with stable decline
Mature oil fields with stable decline deliver low growth but high share, producing ~29,000 boepd in 2024 and acting as classic milkers with predictable barrels and ~5% annual decline. Minimal promo spend is required—just steady opex and routine workovers—keeping lifting costs near $8/boe. Margins remain attractive if discipline holds, letting cash fund growth projects and service debt.
Tariff-based midstream access
Savannah Energy’s tariff-based midstream access, anchored since its 2021 LSE listing, delivers steady fee income from existing pipeline and processing capacity, with industry-standard uptime above 99% and maintenance capex typically low (around 5–8% of midstream revenues in 2024). Market growth is modest but Savannah’s share is entrenched regionally, so predictable tariffs drive recurring EBITDA. Keeping uptime high and quietly collecting fees preserves cash cow margins.
Legacy gas contracts with bankable counterparties
Legacy gas contracts with bankable counterparties provide Savannah Energy with locked-in pricing and take-or-pay terms that continue to generate predictable cash even in flat 2024 markets. Administration is lighter than upstream development, allowing reinvestment focus on renewals and indexation rather than expansion. Managing contract renewals and CPI/energy-index clauses is more value-accretive than new capex. Maintain performance guarantees to preserve cash flow certainty.
Brownfield infill and debottlenecking
Brownfield infill and debottlenecking are low-risk, short-cycle wins that typically deliver measurable recovery and throughput uplift without altering long-term growth curves; for Savannah Energy these projects prioritize quick paybacks and chunky returns relative to small capital checks.
Maintain a rolling queue of such projects to smooth cash generation and optimize operational cashflow in 2024 market conditions.
- Short-cycle wins: months to ~1–2 years
- High ROI per spend: outsized returns vs capex
- Improves recovery and throughput
- Rolling project queue smooths cash
Ancillary services from existing footprint
Ancillary services using Savannah Energy’s owned power, water and logistics convert sunk infrastructure into steady, low-growth cash cows by delivering incremental revenue with minimal incremental capex; competition rarely challenges the installed base, preserving pricing and utilization. Margins on these services are typically tidy, supporting working capital and covering fixed overhead while operations focus on core production.
- Low-growth, stable revenue stream
- Minimal competition for installed assets
- Sunk costs keep incremental capex low
- Healthy margins that cover fixed costs
- Maintain service levels to sustain cash flow
Mature oil cashflow: 29,000 boepd, 5% decline, lifting ~$8/boe
Mature oil fields: ~29,000 boepd in 2024, ~5% annual decline, lifting cost ~$8/boe, strong free cash. Tariffed midstream: >99% uptime, maintenance capex ~5–8% of midstream revenue, steady fees. Legacy gas contracts: take-or-pay with bankable counterparties, predictable cash. Brownfield/ancillary services: low incremental capex, healthy margins supporting working capital.
| Asset | 2024 metric | Margin/notes |
|---|---|---|
| Upstream | 29,000 boepd; 5% decline | Lifting ~$8/boe |
| Midstream | >99% uptime; m-capex 5–8% | Stable tariffs |
| Gas contracts | Take-or-pay | Predictable cash |
What You’re Viewing Is Included
Savannah Energy BCG Matrix
The file you're previewing is the exact Savannah Energy BCG Matrix you'll receive after purchase. No watermarks or demo text — just a fully formatted, analysis-ready report tailored for strategic clarity. Once bought, the same editable, print-ready document is yours to download and share with your team or investors. Built by strategy experts, it plugs straight into planning, presentations, or board decks with no surprises.
Original: $10.00
-65%$10.00
$3.50Description
Visual. Strategic. Downloadable.
Savannah Energy’s BCG Matrix preview shows where its assets sit in a shifting energy landscape — which units are Stars, which are Cash Cows, and where Question Marks hide opportunity. Want the full picture with quadrant-by-quadrant analysis, clear strategic moves, and numbers that back every recommendation? Purchase the complete BCG Matrix (Word + Excel) for an immediately actionable roadmap to optimize investment and sharpen your portfolio decisions.
Stars
Core gas-to-power leadership
High-growth African electricity demand — IEA projects roughly a 50% rise by 2040 — meets Savannah Energy’s strong gas position, giving high share and momentum. Embedded offtakes and proven reliability make its gas-to-power the go-to supply for utilities. It soaks up capex for drilling and compression, but project returns track reinvestment, so keep feeding it to mature into sustained cash flow.
Leading producing hubs in demand centers
Savannah’s flagship producing assets, supplying roughly 600 MW into fast-growing urban and industrial demand centers, capture scale and pricing power that underpin resilient market share. Regional power demand grew about 5% year-on-year in 2024, keeping reinvestment needs elevated. Priority is to hold share and sustain >95% uptime; with disciplined capex these assets can convert growth into the next cash cows, supporting ~20% reinvestment of EBITDA.
Operator reputation and stakeholder access
Being the reliable African operator, Savannah Energy in 2024 converted reputation into accelerated acreage awards, regulatory approvals and joint-venture partners, creating barriers competitors cannot replicate quickly. That soft power is increasing Savannah’s share as African gas and power markets expand. It requires sustained relationship management and elevated ESG spend; net effect keeps Savannah in a star position worth backing.
Integrated gas marketing and offtake contracts
Long-term offtake contracts lock in volumes as regional markets ramp, converting scale into predictable revenue streams; IEA projects global natural gas demand growth of about 1% in 2024, supporting secured sales momentum.
That blend of scale and contracted demand pushes a high-market-share, high-growth classification in the BCG matrix for Savannah Energy, despite tying up working capital and requiring rigorous operational diligence.
The capital and diligence demands are offset by compounding leadership effects: secured cash flows enable reinvestment and market consolidation, reinforcing durable competitive advantage.
- Secured demand via long-term contracts — supports high share in high-growth markets
- 2024 IEA gas demand +1% — macro tailwind
- Requires working capital and diligence — trade-off for durable leadership
Early mover in utility-scale renewables where active
In a handful of target countries Savannah Energy holds first-wave wind and solar sites with grid access and secured land, converting interconnection viability into meaningful market share and brisk capacity growth as projects advance toward COD. Development burn is material across permitting, environmental and grid studies, and equipment reservations, so targeted equity through COD is required to cement star status. Active sites are positioned to become market-leading utility-scale assets where permitted and contracted.
- Position: early mover in select markets
- Risk: high development burn (permits, studies, equipment locks)
- Action: invest through COD to lock star trajectory
- Outcome: meaningful share and brisk post-COD growth
~600 MW gas fleet, >95% uptime and +5% demand — predictable revenues, ~20% reinvested
Savannah’s gas-to-power Stars combine ~600 MW operating capacity, >95% uptime and regional demand growth ~5% YoY in 2024, giving high share in high-growth markets. Long-term offtakes and IEA 2024 gas +1% underpin predictable revenues but require ~20% EBITDA reinvestment and elevated development capex. Early-stage wind/solar sites need targeted equity through COD to convert into utility-scale Stars.
| Metric | Value | Note |
|---|---|---|
| Operating capacity | ~600 MW | 2024 produced |
| Regional demand | +5% YoY | 2024 |
| Uptime | >95% | operational target |
| Reinvestment | ~20% EBITDA | to sustain growth |
| IEA gas | +1% (2024) | macro tailwind |
What is included in the product
Detailed Word Document
Comprehensive BCG analysis of Savannah Energy’s units, highlighting Stars, Cash Cows, Question Marks, Dogs and strategic recommendations.
Customizable Excel Spreadsheet
One-page Savannah Energy BCG Matrix mapping each business unit to quadrants; export-ready for slides and C-level printing.
Cash Cows
Mature oil fields with stable decline
Mature oil fields with stable decline deliver low growth but high share, producing ~29,000 boepd in 2024 and acting as classic milkers with predictable barrels and ~5% annual decline. Minimal promo spend is required—just steady opex and routine workovers—keeping lifting costs near $8/boe. Margins remain attractive if discipline holds, letting cash fund growth projects and service debt.
Tariff-based midstream access
Savannah Energy’s tariff-based midstream access, anchored since its 2021 LSE listing, delivers steady fee income from existing pipeline and processing capacity, with industry-standard uptime above 99% and maintenance capex typically low (around 5–8% of midstream revenues in 2024). Market growth is modest but Savannah’s share is entrenched regionally, so predictable tariffs drive recurring EBITDA. Keeping uptime high and quietly collecting fees preserves cash cow margins.
Legacy gas contracts with bankable counterparties
Legacy gas contracts with bankable counterparties provide Savannah Energy with locked-in pricing and take-or-pay terms that continue to generate predictable cash even in flat 2024 markets. Administration is lighter than upstream development, allowing reinvestment focus on renewals and indexation rather than expansion. Managing contract renewals and CPI/energy-index clauses is more value-accretive than new capex. Maintain performance guarantees to preserve cash flow certainty.
Brownfield infill and debottlenecking
Brownfield infill and debottlenecking are low-risk, short-cycle wins that typically deliver measurable recovery and throughput uplift without altering long-term growth curves; for Savannah Energy these projects prioritize quick paybacks and chunky returns relative to small capital checks.
Maintain a rolling queue of such projects to smooth cash generation and optimize operational cashflow in 2024 market conditions.
- Short-cycle wins: months to ~1–2 years
- High ROI per spend: outsized returns vs capex
- Improves recovery and throughput
- Rolling project queue smooths cash
Ancillary services from existing footprint
Ancillary services using Savannah Energy’s owned power, water and logistics convert sunk infrastructure into steady, low-growth cash cows by delivering incremental revenue with minimal incremental capex; competition rarely challenges the installed base, preserving pricing and utilization. Margins on these services are typically tidy, supporting working capital and covering fixed overhead while operations focus on core production.
- Low-growth, stable revenue stream
- Minimal competition for installed assets
- Sunk costs keep incremental capex low
- Healthy margins that cover fixed costs
- Maintain service levels to sustain cash flow
Mature oil cashflow: 29,000 boepd, 5% decline, lifting ~$8/boe
Mature oil fields: ~29,000 boepd in 2024, ~5% annual decline, lifting cost ~$8/boe, strong free cash. Tariffed midstream: >99% uptime, maintenance capex ~5–8% of midstream revenue, steady fees. Legacy gas contracts: take-or-pay with bankable counterparties, predictable cash. Brownfield/ancillary services: low incremental capex, healthy margins supporting working capital.
| Asset | 2024 metric | Margin/notes |
|---|---|---|
| Upstream | 29,000 boepd; 5% decline | Lifting ~$8/boe |
| Midstream | >99% uptime; m-capex 5–8% | Stable tariffs |
| Gas contracts | Take-or-pay | Predictable cash |
What You’re Viewing Is Included
Savannah Energy BCG Matrix
The file you're previewing is the exact Savannah Energy BCG Matrix you'll receive after purchase. No watermarks or demo text — just a fully formatted, analysis-ready report tailored for strategic clarity. Once bought, the same editable, print-ready document is yours to download and share with your team or investors. Built by strategy experts, it plugs straight into planning, presentations, or board decks with no surprises.











