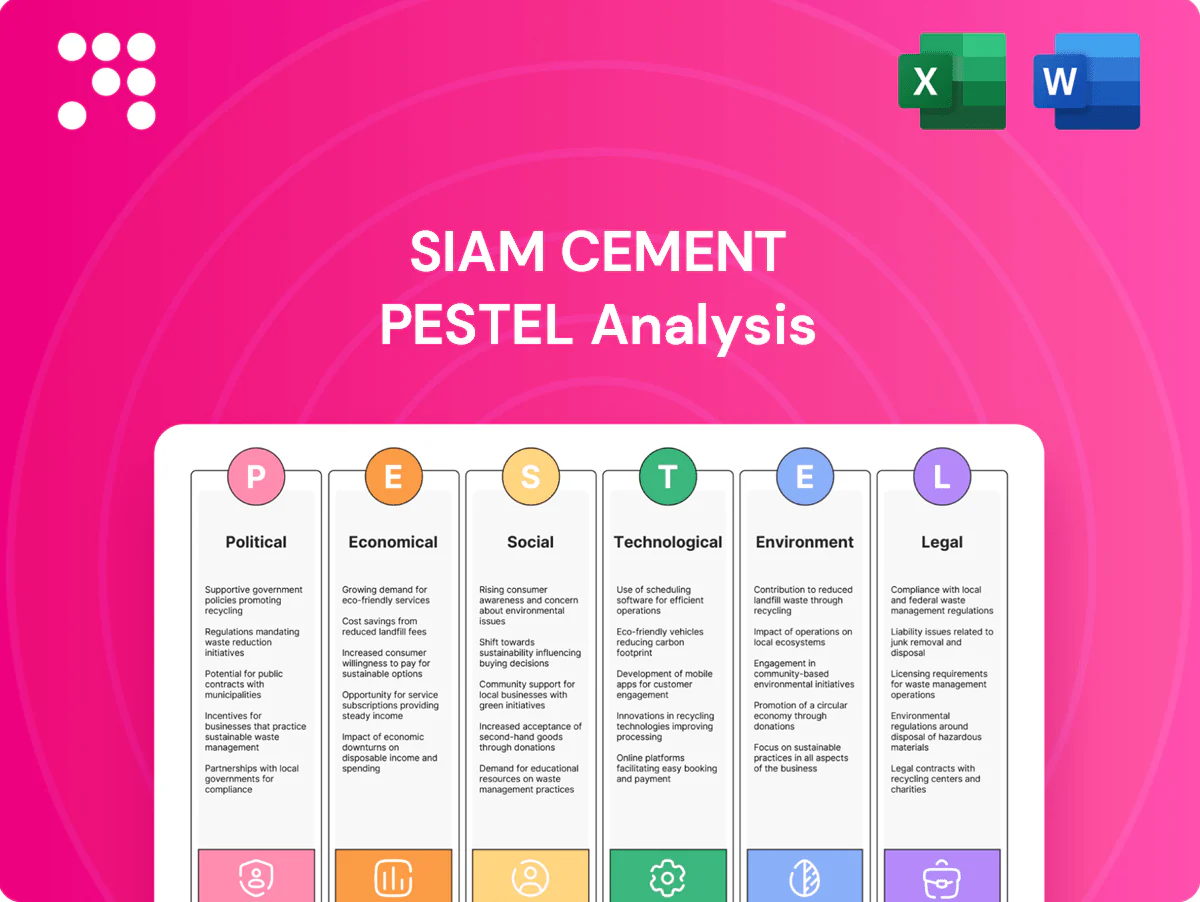
Siam Cement PESTLE Analysis

Plan Smarter. Present Sharper. Compete Stronger.
Discover how political shifts, economic cycles, and sustainability trends are reshaping Siam Cement’s competitive landscape. Our concise PESTLE highlights risks and opportunities for investors, strategists, and managers. Buy the full analysis to access actionable insights, data-driven forecasts, and editable charts ready for immediate use.
Political factors

Thai policy stability
Government stability in Thailand directly affects approvals, public spending and infrastructure timelines that drive cement demand; major initiatives like the Eastern Economic Corridor carry roughly 1.5 trillion THB in planned investment. Cabinet changes can reallocate priorities for housing, transport and industrial zones, altering project timing. SCG, with operations across about 30 countries, hedges policy swings via regional diversification. Proactive government relations and scenario planning cut project pipeline volatility.
ASEAN trade integration
ASEAN trade integration via ATIGA and RCEP (RCEP in force 2022 covering 15 members and ~30% of global GDP) lowers tariffs and streamlines customs, aiding cross-border flow of SCG raw materials. Rules of origin critically shape sourcing of chemicals and packaging feedstocks. Harmonized standards expand SCG’s ASEAN export addressable market. Supply-chain design should exploit tariff elimination on most lines while reducing non-tariff frictions.

Public infrastructure agendas
Public infrastructure stimulus across Thailand, Vietnam and Indonesia can lift cement and building-materials volumes, with the ADB estimating Southeast Asia needs about $210 billion per year in infrastructure investment to 2030. Election cycles and budget reallocations can delay tendering and cashflows, so SCG’s contract mix should balance public and private projects. Strategic bidding and capacity readiness enable SCG to capture upcycles when stimulus accelerates.

Energy and subsidy policies
Fuel, electricity and gas pricing directly reshape SCC kiln and cracker margins: Thailand industrial electricity averaged ~4.5 THB/kWh in 2024 and diesel ~38–40 THB/liter, while EU carbon traded near €90/tCO2 (2024), so subsidy removals or carbon pricing materially shift clinker and petrochemical cost curves. Long-term PPAs and alternative fuels reduce exposure to spot LNG and oil volatility, and active policy monitoring enables timely cost pass-through and product-mix shifts.
- Energy cost sensitivity: high
- Carbon price impact: €90/tCO2 (EU, 2024)
- Thailand industrial power: ~4.5 THB/kWh (2024)
- Mitigation: long-term PPAs, alternative fuels, policy monitoring
Geopolitics and supply security
Global tensions along Red Sea and Strait of Hormuz routes have repeatedly disrupted naphtha and LPG feedstock flows and raised freight rates, while sanctions and export controls since 2022 have tightened specialty-chemical availability for Asian processors. SCG must expand multi-origin procurement and logistics redundancies, use political-risk insurance and maintain inventory buffers to limit margin volatility.
- diversify suppliers
- logistics redundancy
- political risk insurance
- multi-origin procurement
EEC, ASEAN trade and energy/carbon costs lift cement demand; $210bn/yr
Government stability and projects like the Eastern Economic Corridor (≈1.5 trillion THB) drive cement demand; cabinet shifts can re-prioritize housing and transport. ASEAN integration (RCEP, ATIGA) and infrastructure need (~$210bn/yr to 2030) expand markets but shift rules of origin. Energy & carbon costs (Thailand industrial ~4.5 THB/kWh; EU carbon ~€90/tCO2) plus Red Sea shipping risks raise input-price volatility.
| Factor | Key 2024–25 Data |
|---|---|
| Eastern Corridor | ≈1.5 trillion THB |
| Infra need SE Asia | ~$210bn/yr to 2030 |
| Power price (TH) | ~4.5 THB/kWh (2024) |
| Carbon price (EU) | ~€90/tCO2 (2024) |
What is included in the product
 Detailed Word Document
Explores how Political, Economic, Social, Technological, Environmental and Legal forces uniquely impact Siam Cement, using current data and sector trends to identify threats and growth opportunities. Designed for executives and investors, it includes actionable, forward-looking insights and detailed subpoints ready for reports.

 Customizable Excel Spreadsheet
A concise, visually segmented PESTLE summary of Siam Cement that can be dropped into presentations, edited with notes for regional or business-line context, and easily shared across teams to streamline external-risk discussions and strategic planning.
Economic factors

Construction cycle sensitivity
Urbanization in Thailand reached about 52.8% (World Bank) and urban housing demand remains the main driver of bulk cement consumption—Thailand cement demand was roughly 45 million tonnes in 2023. Interest rates and mortgage availability materially affect residential starts, so SCG must align capacity and pricing to local cycle strength, while timing counter-cyclical maintenance and capex preserves margins through downcycles.
Petrochemical margin volatility
Petrochemical spreads for SCG swing with Brent/naphtha moves—Brent averaged about 85 USD/bbl in 2024, driving naphtha-linked margins and compressing US$/ton spreads. China demand and inventory cycles caused polyethylene spot prices to vary over 20% in 2023–24, amplifying margin volatility. SCG manages this via dynamic operating rates, product-slate optimization, hedging programs and feedstock flexibility to stabilize earnings.

Currency fluctuations
THB and regional FX swings—USD/THB around 36.5 in mid-2025—directly raise import costs and alter export competitiveness for SCG, especially in petrochemicals and building materials. USD-linked feedstocks (eg naphtha) create translation and transaction risk for margins. SCG offsets exposure with USD revenues/liabilities as natural hedges and by using prudent FX hedging programs and pricing clauses to protect margins.

Inflation and input costs
Rising energy, freight and labor costs continue to pressure EBITDA in heavy industries, forcing Siam Cement to rely on price discipline and portfolio shift toward value-added products to preserve margins.
Operational efficiency programs and automation projects reduce unit costs, while SCC’s procurement scale aims to secure improved supplier terms and passthrough of input inflation.
- Cost pressure: energy, freight, labor
- Mitigation: price discipline, value-added mix
- Efficiency: automation lowers unit costs
- Procurement: scale for better terms
Regional growth diversification
ASEAN’s differing growth rates create a portfolio effect for Siam Cement, with regional GDP dispersion—Indonesia ~5.1% and Vietnam ~5.6% in 2024—offsetting softness in slower markets and smoothing group revenue volatility. Vietnam and Indonesia infrastructure demand, fueled by sustained public capex, can counter weaker demand elsewhere, supporting SCG’s materials and cement segments. Balanced capital allocation across these markets and local partnerships accelerate penetration and share risk, enhancing resilience.
- ASEAN growth dispersion: Indonesia ~5.1% (2024)
- Vietnam growth: ~5.6% (2024)
- Infrastructure demand offsets cyclical weakness
- Local partnerships enhance market entry and risk sharing
EEC, ASEAN trade and energy/carbon costs lift cement demand; $210bn/yr
Urbanization ~52.8% and Thailand cement demand ~45 Mt (2023) keep residential construction central to SCG volumes, while mortgage rates drive cyclicality. Petrochemical margins tracked Brent ~85 USD/bbl (2024) and polyethylene spot swings >20% (2023–24), raising earnings volatility. FX (USD/THB ~36.5 mid‑2025), rising energy/freight/labor costs and ASEAN GDP dispersion (ID 5.1%, VN 5.6% in 2024) shape pricing, hedging and portfolio shifts.
| Metric | Value |
|---|---|
| Thailand urbanization | 52.8% |
| Cement demand (2023) | 45 Mt |
| Brent (2024 avg) | 85 USD/bbl |
| PE spot volatility (2023–24) | >20% |
| USD/THB (mid‑2025) | 36.5 |
| Indonesia GDP (2024) | 5.1% |
| Vietnam GDP (2024) | 5.6% |
Full Version Awaits
Siam Cement PESTLE Analysis
The preview shown here is the exact Siam Cement PESTLE Analysis you’ll receive after purchase—fully formatted and ready to use. The layout, content, and structure visible are identical to the downloadable file, with no placeholders or teasers. After payment you’ll instantly get this same professional, final document.

Plan Smarter. Present Sharper. Compete Stronger.
Discover how political shifts, economic cycles, and sustainability trends are reshaping Siam Cement’s competitive landscape. Our concise PESTLE highlights risks and opportunities for investors, strategists, and managers. Buy the full analysis to access actionable insights, data-driven forecasts, and editable charts ready for immediate use.
Political factors
Thai policy stability
Government stability in Thailand directly affects approvals, public spending and infrastructure timelines that drive cement demand; major initiatives like the Eastern Economic Corridor carry roughly 1.5 trillion THB in planned investment. Cabinet changes can reallocate priorities for housing, transport and industrial zones, altering project timing. SCG, with operations across about 30 countries, hedges policy swings via regional diversification. Proactive government relations and scenario planning cut project pipeline volatility.
ASEAN trade integration
ASEAN trade integration via ATIGA and RCEP (RCEP in force 2022 covering 15 members and ~30% of global GDP) lowers tariffs and streamlines customs, aiding cross-border flow of SCG raw materials. Rules of origin critically shape sourcing of chemicals and packaging feedstocks. Harmonized standards expand SCG’s ASEAN export addressable market. Supply-chain design should exploit tariff elimination on most lines while reducing non-tariff frictions.
Public infrastructure agendas
Public infrastructure stimulus across Thailand, Vietnam and Indonesia can lift cement and building-materials volumes, with the ADB estimating Southeast Asia needs about $210 billion per year in infrastructure investment to 2030. Election cycles and budget reallocations can delay tendering and cashflows, so SCG’s contract mix should balance public and private projects. Strategic bidding and capacity readiness enable SCG to capture upcycles when stimulus accelerates.
Energy and subsidy policies
Fuel, electricity and gas pricing directly reshape SCC kiln and cracker margins: Thailand industrial electricity averaged ~4.5 THB/kWh in 2024 and diesel ~38–40 THB/liter, while EU carbon traded near €90/tCO2 (2024), so subsidy removals or carbon pricing materially shift clinker and petrochemical cost curves. Long-term PPAs and alternative fuels reduce exposure to spot LNG and oil volatility, and active policy monitoring enables timely cost pass-through and product-mix shifts.
- Energy cost sensitivity: high
- Carbon price impact: €90/tCO2 (EU, 2024)
- Thailand industrial power: ~4.5 THB/kWh (2024)
- Mitigation: long-term PPAs, alternative fuels, policy monitoring
Geopolitics and supply security
Global tensions along Red Sea and Strait of Hormuz routes have repeatedly disrupted naphtha and LPG feedstock flows and raised freight rates, while sanctions and export controls since 2022 have tightened specialty-chemical availability for Asian processors. SCG must expand multi-origin procurement and logistics redundancies, use political-risk insurance and maintain inventory buffers to limit margin volatility.
- diversify suppliers
- logistics redundancy
- political risk insurance
- multi-origin procurement
EEC, ASEAN trade and energy/carbon costs lift cement demand; $210bn/yr
Government stability and projects like the Eastern Economic Corridor (≈1.5 trillion THB) drive cement demand; cabinet shifts can re-prioritize housing and transport. ASEAN integration (RCEP, ATIGA) and infrastructure need (~$210bn/yr to 2030) expand markets but shift rules of origin. Energy & carbon costs (Thailand industrial ~4.5 THB/kWh; EU carbon ~€90/tCO2) plus Red Sea shipping risks raise input-price volatility.
| Factor | Key 2024–25 Data |
|---|---|
| Eastern Corridor | ≈1.5 trillion THB |
| Infra need SE Asia | ~$210bn/yr to 2030 |
| Power price (TH) | ~4.5 THB/kWh (2024) |
| Carbon price (EU) | ~€90/tCO2 (2024) |
What is included in the product
Detailed Word Document
Explores how Political, Economic, Social, Technological, Environmental and Legal forces uniquely impact Siam Cement, using current data and sector trends to identify threats and growth opportunities. Designed for executives and investors, it includes actionable, forward-looking insights and detailed subpoints ready for reports.
Customizable Excel Spreadsheet
A concise, visually segmented PESTLE summary of Siam Cement that can be dropped into presentations, edited with notes for regional or business-line context, and easily shared across teams to streamline external-risk discussions and strategic planning.
Economic factors
Construction cycle sensitivity
Urbanization in Thailand reached about 52.8% (World Bank) and urban housing demand remains the main driver of bulk cement consumption—Thailand cement demand was roughly 45 million tonnes in 2023. Interest rates and mortgage availability materially affect residential starts, so SCG must align capacity and pricing to local cycle strength, while timing counter-cyclical maintenance and capex preserves margins through downcycles.
Petrochemical margin volatility
Petrochemical spreads for SCG swing with Brent/naphtha moves—Brent averaged about 85 USD/bbl in 2024, driving naphtha-linked margins and compressing US$/ton spreads. China demand and inventory cycles caused polyethylene spot prices to vary over 20% in 2023–24, amplifying margin volatility. SCG manages this via dynamic operating rates, product-slate optimization, hedging programs and feedstock flexibility to stabilize earnings.
Currency fluctuations
THB and regional FX swings—USD/THB around 36.5 in mid-2025—directly raise import costs and alter export competitiveness for SCG, especially in petrochemicals and building materials. USD-linked feedstocks (eg naphtha) create translation and transaction risk for margins. SCG offsets exposure with USD revenues/liabilities as natural hedges and by using prudent FX hedging programs and pricing clauses to protect margins.
Inflation and input costs
Rising energy, freight and labor costs continue to pressure EBITDA in heavy industries, forcing Siam Cement to rely on price discipline and portfolio shift toward value-added products to preserve margins.
Operational efficiency programs and automation projects reduce unit costs, while SCC’s procurement scale aims to secure improved supplier terms and passthrough of input inflation.
- Cost pressure: energy, freight, labor
- Mitigation: price discipline, value-added mix
- Efficiency: automation lowers unit costs
- Procurement: scale for better terms
Regional growth diversification
ASEAN’s differing growth rates create a portfolio effect for Siam Cement, with regional GDP dispersion—Indonesia ~5.1% and Vietnam ~5.6% in 2024—offsetting softness in slower markets and smoothing group revenue volatility. Vietnam and Indonesia infrastructure demand, fueled by sustained public capex, can counter weaker demand elsewhere, supporting SCG’s materials and cement segments. Balanced capital allocation across these markets and local partnerships accelerate penetration and share risk, enhancing resilience.
- ASEAN growth dispersion: Indonesia ~5.1% (2024)
- Vietnam growth: ~5.6% (2024)
- Infrastructure demand offsets cyclical weakness
- Local partnerships enhance market entry and risk sharing
EEC, ASEAN trade and energy/carbon costs lift cement demand; $210bn/yr
Urbanization ~52.8% and Thailand cement demand ~45 Mt (2023) keep residential construction central to SCG volumes, while mortgage rates drive cyclicality. Petrochemical margins tracked Brent ~85 USD/bbl (2024) and polyethylene spot swings >20% (2023–24), raising earnings volatility. FX (USD/THB ~36.5 mid‑2025), rising energy/freight/labor costs and ASEAN GDP dispersion (ID 5.1%, VN 5.6% in 2024) shape pricing, hedging and portfolio shifts.
| Metric | Value |
|---|---|
| Thailand urbanization | 52.8% |
| Cement demand (2023) | 45 Mt |
| Brent (2024 avg) | 85 USD/bbl |
| PE spot volatility (2023–24) | >20% |
| USD/THB (mid‑2025) | 36.5 |
| Indonesia GDP (2024) | 5.1% |
| Vietnam GDP (2024) | 5.6% |
Full Version Awaits
Siam Cement PESTLE Analysis
The preview shown here is the exact Siam Cement PESTLE Analysis you’ll receive after purchase—fully formatted and ready to use. The layout, content, and structure visible are identical to the downloadable file, with no placeholders or teasers. After payment you’ll instantly get this same professional, final document.
Original: $10.00
-65%$10.00
$3.50Description
Plan Smarter. Present Sharper. Compete Stronger.
Discover how political shifts, economic cycles, and sustainability trends are reshaping Siam Cement’s competitive landscape. Our concise PESTLE highlights risks and opportunities for investors, strategists, and managers. Buy the full analysis to access actionable insights, data-driven forecasts, and editable charts ready for immediate use.
Political factors
Thai policy stability
Government stability in Thailand directly affects approvals, public spending and infrastructure timelines that drive cement demand; major initiatives like the Eastern Economic Corridor carry roughly 1.5 trillion THB in planned investment. Cabinet changes can reallocate priorities for housing, transport and industrial zones, altering project timing. SCG, with operations across about 30 countries, hedges policy swings via regional diversification. Proactive government relations and scenario planning cut project pipeline volatility.
ASEAN trade integration
ASEAN trade integration via ATIGA and RCEP (RCEP in force 2022 covering 15 members and ~30% of global GDP) lowers tariffs and streamlines customs, aiding cross-border flow of SCG raw materials. Rules of origin critically shape sourcing of chemicals and packaging feedstocks. Harmonized standards expand SCG’s ASEAN export addressable market. Supply-chain design should exploit tariff elimination on most lines while reducing non-tariff frictions.
Public infrastructure agendas
Public infrastructure stimulus across Thailand, Vietnam and Indonesia can lift cement and building-materials volumes, with the ADB estimating Southeast Asia needs about $210 billion per year in infrastructure investment to 2030. Election cycles and budget reallocations can delay tendering and cashflows, so SCG’s contract mix should balance public and private projects. Strategic bidding and capacity readiness enable SCG to capture upcycles when stimulus accelerates.
Energy and subsidy policies
Fuel, electricity and gas pricing directly reshape SCC kiln and cracker margins: Thailand industrial electricity averaged ~4.5 THB/kWh in 2024 and diesel ~38–40 THB/liter, while EU carbon traded near €90/tCO2 (2024), so subsidy removals or carbon pricing materially shift clinker and petrochemical cost curves. Long-term PPAs and alternative fuels reduce exposure to spot LNG and oil volatility, and active policy monitoring enables timely cost pass-through and product-mix shifts.
- Energy cost sensitivity: high
- Carbon price impact: €90/tCO2 (EU, 2024)
- Thailand industrial power: ~4.5 THB/kWh (2024)
- Mitigation: long-term PPAs, alternative fuels, policy monitoring
Geopolitics and supply security
Global tensions along Red Sea and Strait of Hormuz routes have repeatedly disrupted naphtha and LPG feedstock flows and raised freight rates, while sanctions and export controls since 2022 have tightened specialty-chemical availability for Asian processors. SCG must expand multi-origin procurement and logistics redundancies, use political-risk insurance and maintain inventory buffers to limit margin volatility.
- diversify suppliers
- logistics redundancy
- political risk insurance
- multi-origin procurement
EEC, ASEAN trade and energy/carbon costs lift cement demand; $210bn/yr
Government stability and projects like the Eastern Economic Corridor (≈1.5 trillion THB) drive cement demand; cabinet shifts can re-prioritize housing and transport. ASEAN integration (RCEP, ATIGA) and infrastructure need (~$210bn/yr to 2030) expand markets but shift rules of origin. Energy & carbon costs (Thailand industrial ~4.5 THB/kWh; EU carbon ~€90/tCO2) plus Red Sea shipping risks raise input-price volatility.
| Factor | Key 2024–25 Data |
|---|---|
| Eastern Corridor | ≈1.5 trillion THB |
| Infra need SE Asia | ~$210bn/yr to 2030 |
| Power price (TH) | ~4.5 THB/kWh (2024) |
| Carbon price (EU) | ~€90/tCO2 (2024) |
What is included in the product
Detailed Word Document
Explores how Political, Economic, Social, Technological, Environmental and Legal forces uniquely impact Siam Cement, using current data and sector trends to identify threats and growth opportunities. Designed for executives and investors, it includes actionable, forward-looking insights and detailed subpoints ready for reports.
Customizable Excel Spreadsheet
A concise, visually segmented PESTLE summary of Siam Cement that can be dropped into presentations, edited with notes for regional or business-line context, and easily shared across teams to streamline external-risk discussions and strategic planning.
Economic factors
Construction cycle sensitivity
Urbanization in Thailand reached about 52.8% (World Bank) and urban housing demand remains the main driver of bulk cement consumption—Thailand cement demand was roughly 45 million tonnes in 2023. Interest rates and mortgage availability materially affect residential starts, so SCG must align capacity and pricing to local cycle strength, while timing counter-cyclical maintenance and capex preserves margins through downcycles.
Petrochemical margin volatility
Petrochemical spreads for SCG swing with Brent/naphtha moves—Brent averaged about 85 USD/bbl in 2024, driving naphtha-linked margins and compressing US$/ton spreads. China demand and inventory cycles caused polyethylene spot prices to vary over 20% in 2023–24, amplifying margin volatility. SCG manages this via dynamic operating rates, product-slate optimization, hedging programs and feedstock flexibility to stabilize earnings.
Currency fluctuations
THB and regional FX swings—USD/THB around 36.5 in mid-2025—directly raise import costs and alter export competitiveness for SCG, especially in petrochemicals and building materials. USD-linked feedstocks (eg naphtha) create translation and transaction risk for margins. SCG offsets exposure with USD revenues/liabilities as natural hedges and by using prudent FX hedging programs and pricing clauses to protect margins.
Inflation and input costs
Rising energy, freight and labor costs continue to pressure EBITDA in heavy industries, forcing Siam Cement to rely on price discipline and portfolio shift toward value-added products to preserve margins.
Operational efficiency programs and automation projects reduce unit costs, while SCC’s procurement scale aims to secure improved supplier terms and passthrough of input inflation.
- Cost pressure: energy, freight, labor
- Mitigation: price discipline, value-added mix
- Efficiency: automation lowers unit costs
- Procurement: scale for better terms
Regional growth diversification
ASEAN’s differing growth rates create a portfolio effect for Siam Cement, with regional GDP dispersion—Indonesia ~5.1% and Vietnam ~5.6% in 2024—offsetting softness in slower markets and smoothing group revenue volatility. Vietnam and Indonesia infrastructure demand, fueled by sustained public capex, can counter weaker demand elsewhere, supporting SCG’s materials and cement segments. Balanced capital allocation across these markets and local partnerships accelerate penetration and share risk, enhancing resilience.
- ASEAN growth dispersion: Indonesia ~5.1% (2024)
- Vietnam growth: ~5.6% (2024)
- Infrastructure demand offsets cyclical weakness
- Local partnerships enhance market entry and risk sharing
EEC, ASEAN trade and energy/carbon costs lift cement demand; $210bn/yr
Urbanization ~52.8% and Thailand cement demand ~45 Mt (2023) keep residential construction central to SCG volumes, while mortgage rates drive cyclicality. Petrochemical margins tracked Brent ~85 USD/bbl (2024) and polyethylene spot swings >20% (2023–24), raising earnings volatility. FX (USD/THB ~36.5 mid‑2025), rising energy/freight/labor costs and ASEAN GDP dispersion (ID 5.1%, VN 5.6% in 2024) shape pricing, hedging and portfolio shifts.
| Metric | Value |
|---|---|
| Thailand urbanization | 52.8% |
| Cement demand (2023) | 45 Mt |
| Brent (2024 avg) | 85 USD/bbl |
| PE spot volatility (2023–24) | >20% |
| USD/THB (mid‑2025) | 36.5 |
| Indonesia GDP (2024) | 5.1% |
| Vietnam GDP (2024) | 5.6% |
Full Version Awaits
Siam Cement PESTLE Analysis
The preview shown here is the exact Siam Cement PESTLE Analysis you’ll receive after purchase—fully formatted and ready to use. The layout, content, and structure visible are identical to the downloadable file, with no placeholders or teasers. After payment you’ll instantly get this same professional, final document.











