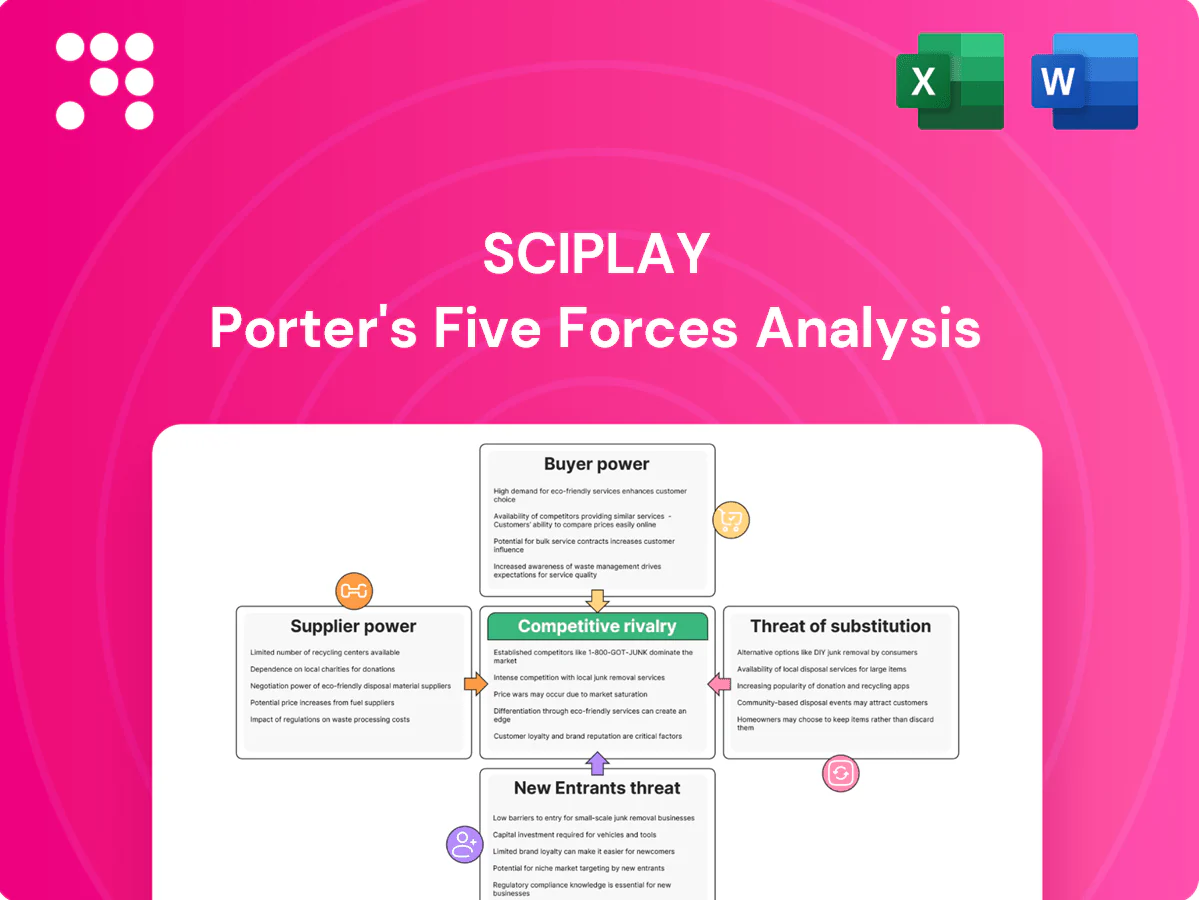
SciPlay Porter's Five Forces Analysis

Go Beyond the Preview—Access the Full Strategic Report
SciPlay faces intense competitive rivalry in mobile and social gaming, moderate supplier bargaining power, and evolving buyer expectations driven by free-to-play models. Threat of new entrants is tempered by IP and scale, while substitutes and platform control pose ongoing risks. This snapshot highlights key dynamics. Unlock the full Porter's Five Forces Analysis to explore SciPlay’s competitive dynamics, market pressures, and strategic advantages in detail.
Suppliers Bargaining Power

Platform Gatekeepers
Platform gatekeepers like Apple and Google concentrate power by controlling distribution and charging standard commissions of 30%, with reduced 15% rates under programs for developers earning up to $1 million annually. Policy shifts such as Apple's ATT/IDFA rollout (2021) have materially raised user acquisition costs and limited targeting precision for ad-driven games. App store featuring and ranking decisions can sharply affect installs and revenue, and SciPlay must meet platform guidelines, timelines, and technical requirements to maintain visibility and monetization.
User Acquisition Channels
Ad networks and major social platforms wield significant leverage over SciPlays user acquisition, with Google and Meta capturing roughly 58% of US digital ad spend in 2024 (Insider Intelligence), constraining scale options. Auction dynamics and post-IDFA signal loss raise CPIs, often causing double-digit CPI spikes during major campaigns. Preferential access to inventory or optimization tools is monetized via premium deals and higher CPMs, and dependence intensifies around new game launches and live events.

Game Engines & Cloud
Reliance on engines like Unity (runtime-fee policy announced Sept 2023) and major cloud providers creates high switching costs for SciPlay, tying long-term live-ops to specific runtimes and APIs. Cloud concentration (2024 market shares roughly AWS 31%, Azure 23%, GCP 12%) means pricing or fee changes can compress margins materially. Stable technical support and roadmap alignment are critical for live-ops uptime, and vendor concentration raises outage and cost risks.

Content & IP Licensors
Licensed slot themes and brand partnerships command royalties commonly in the 5–25% range and require licensor approvals; scarce, recognizable IP materially increases supplier bargaining power and can raise engagement metrics by 15–25%. Negotiations often add 3–12 months to time-to-market and determine promotional rights; losing a license can drive 10–30% churn among themed-slot players.
- royalties: 5–25%
- engagement lift: 15–25%
- negotiation delay: 3–12 months
- churn risk: 10–30%
Payments & Ad Mediation
Payment processors, mediation layers and measurement partners set terms and fees that materially affect SciPlay’s margins; Apple and Google take up to 30% of in-app purchases (with reduced 15% tiers for qualifying small developers), while ad mediation and measurement contracts determine revenue splits and data access. Compliance, anti-fraud controls and SDK integrations add operational friction and can lock SciPlay into vendors via historical data and proprietary SDKs.
Suppliers hold sway: app store fees, ad-platform dominance, cloud concentration, royalties
Suppliers (app stores, ad platforms, cloud/engines, licensors, processors) exert high bargaining power: Apple/Google fees 15–30% and featuring control; Meta+Google ~58% US ad spend (2024); cloud concentration AWS 31%/Azure 23%/GCP 12% (2024); licensed IP royalties 5–25% raising churn and time-to-market.
| Supplier | Key metric (2024) |
|---|---|
| App stores | Fees 15–30% |
| Ad platforms | Meta+Google ~58% US spend |
| Cloud | AWS31%/Azure23%/GCP12% |
| Licenses | Royalties 5–25% |
What is included in the product
 Detailed Word Document
Tailored Porter's Five Forces analysis for SciPlay that uncovers key drivers of competition, buyer and supplier power, and barriers to entry, while identifying substitutes and emerging threats to its market share.

 Customizable Excel Spreadsheet
A one-sheet SciPlay Porter's Five Forces summary with editable pressure levels and instant spider chart lets teams quickly visualize competitive threats, customize scenarios, and drop the clean slide-ready output into decks—no macros or finance expertise required.
Customers Bargaining Power

Low Switching Costs
Low switching costs mean players can jump to rival social casino apps with one tap via app store recommendations, driving high volatility in DAU; industry Day-1 churn commonly exceeds 60% and retention often falls below 15% by day 30. Churn spikes when rewards or payout odds feel stingy, so SciPlay must counter with frequent live events, daily bonuses and fresh content to sustain engagement and monetization.
Price Sensitivity to IAP
Pack pricing, bonus multipliers and sale cadence strongly shape conversion; industry 2024 estimates show optimized bundles can lift conversion 10–30%. Whales (top 1–5%) often generate 50–80% of IAP revenue but are discerning about bundle value. Visible discounts train players to expect deals, and poor perceived value can depress ARPDAU rapidly—industry estimates suggest declines up to 15–25%.

Experience and Fairness Expectations
Players judge RTP feel, progression pacing, and ad load harshly, and visible unfairness or heavy ads drive negative reviews that deter new users and depress acquisition ROI; live-ops missteps trigger immediate social backlash across forums and social channels, amplifying churn risk. Trust and transparency in odds and rewards measurably reduce defection and improve LTV.

Global Audience Fragmentation
Global audience fragmentation means preferences shift by region, device and regulatory context, with mobile accounting for roughly 55% of global games revenue in 2023; deep localization and varied payment rails materially sway player choice and monetization. Theme cultural fit drives retention and ARPU variance across markets, and fragmentation amplifies the effective bargaining power of niche cohorts who can dictate feature and payment expectations.
- Regional preferences
- Device split (mobile dominant)
- Regulatory-driven choices
- Localization & payment options
- Cultural fit → higher engagement
Advertisers as Buyers
Advertisers buying SciPlay inventory demand measurable performance and strict brand safety, with 2024 global digital ad spend near $600B pushing higher standards; SciPlay fill rates and eCPMs hinge on advertisers budgets and brand-safety requirements, and seasonal peaks (Q4) increase buyer leverage while off-season softens it. Poor targeting in 2024 reduced willingness to pay, dropping eCPMs by as much as 20-40% in some mobile segments.
- 2024 global digital ad spend ~ $600B
- mobile game eCPM range (2024) ~$1–8
- eCPM drops 20–40% with poor targeting
- Q4 increases advertiser leverage
High churn: Day-1 over 60%, whales 50–80%
Customers hold high bargaining power: low switching costs drive >60% Day-1 churn and <15% D30 retention, forcing aggressive live-ops and discounts. Top 1–5% whales deliver 50–80% IAP, so bundle value and perceived RTP heavily influence ARPDAU (declines 15–25% if mispriced). Regional/mobile fragmentation (mobile ~55% of games revenue 2023) and advertiser eCPM swings ($1–8; 2024 ad spend ~$600B) amplify customer leverage.
| Metric | Value |
|---|---|
| Day-1 churn | >60% |
| D30 retention | <15% |
| Whale revenue share | 50–80% |
| Mobile share (2023) | ~55% |
Preview the Actual Deliverable
SciPlay Porter's Five Forces Analysis
This preview shows the exact SciPlay Porter’s Five Forces analysis you’ll receive—no placeholders or mockups. The full, professionally formatted document is ready for immediate download upon purchase. Use it as-is for due diligence, strategy, or presentation needs.

Go Beyond the Preview—Access the Full Strategic Report
SciPlay faces intense competitive rivalry in mobile and social gaming, moderate supplier bargaining power, and evolving buyer expectations driven by free-to-play models. Threat of new entrants is tempered by IP and scale, while substitutes and platform control pose ongoing risks. This snapshot highlights key dynamics. Unlock the full Porter's Five Forces Analysis to explore SciPlay’s competitive dynamics, market pressures, and strategic advantages in detail.
Suppliers Bargaining Power
Platform Gatekeepers
Platform gatekeepers like Apple and Google concentrate power by controlling distribution and charging standard commissions of 30%, with reduced 15% rates under programs for developers earning up to $1 million annually. Policy shifts such as Apple's ATT/IDFA rollout (2021) have materially raised user acquisition costs and limited targeting precision for ad-driven games. App store featuring and ranking decisions can sharply affect installs and revenue, and SciPlay must meet platform guidelines, timelines, and technical requirements to maintain visibility and monetization.
User Acquisition Channels
Ad networks and major social platforms wield significant leverage over SciPlays user acquisition, with Google and Meta capturing roughly 58% of US digital ad spend in 2024 (Insider Intelligence), constraining scale options. Auction dynamics and post-IDFA signal loss raise CPIs, often causing double-digit CPI spikes during major campaigns. Preferential access to inventory or optimization tools is monetized via premium deals and higher CPMs, and dependence intensifies around new game launches and live events.
Game Engines & Cloud
Reliance on engines like Unity (runtime-fee policy announced Sept 2023) and major cloud providers creates high switching costs for SciPlay, tying long-term live-ops to specific runtimes and APIs. Cloud concentration (2024 market shares roughly AWS 31%, Azure 23%, GCP 12%) means pricing or fee changes can compress margins materially. Stable technical support and roadmap alignment are critical for live-ops uptime, and vendor concentration raises outage and cost risks.
Content & IP Licensors
Licensed slot themes and brand partnerships command royalties commonly in the 5–25% range and require licensor approvals; scarce, recognizable IP materially increases supplier bargaining power and can raise engagement metrics by 15–25%. Negotiations often add 3–12 months to time-to-market and determine promotional rights; losing a license can drive 10–30% churn among themed-slot players.
- royalties: 5–25%
- engagement lift: 15–25%
- negotiation delay: 3–12 months
- churn risk: 10–30%
Payments & Ad Mediation
Payment processors, mediation layers and measurement partners set terms and fees that materially affect SciPlay’s margins; Apple and Google take up to 30% of in-app purchases (with reduced 15% tiers for qualifying small developers), while ad mediation and measurement contracts determine revenue splits and data access. Compliance, anti-fraud controls and SDK integrations add operational friction and can lock SciPlay into vendors via historical data and proprietary SDKs.
Suppliers hold sway: app store fees, ad-platform dominance, cloud concentration, royalties
Suppliers (app stores, ad platforms, cloud/engines, licensors, processors) exert high bargaining power: Apple/Google fees 15–30% and featuring control; Meta+Google ~58% US ad spend (2024); cloud concentration AWS 31%/Azure 23%/GCP 12% (2024); licensed IP royalties 5–25% raising churn and time-to-market.
| Supplier | Key metric (2024) |
|---|---|
| App stores | Fees 15–30% |
| Ad platforms | Meta+Google ~58% US spend |
| Cloud | AWS31%/Azure23%/GCP12% |
| Licenses | Royalties 5–25% |
What is included in the product
Detailed Word Document
Tailored Porter's Five Forces analysis for SciPlay that uncovers key drivers of competition, buyer and supplier power, and barriers to entry, while identifying substitutes and emerging threats to its market share.
Customizable Excel Spreadsheet
A one-sheet SciPlay Porter's Five Forces summary with editable pressure levels and instant spider chart lets teams quickly visualize competitive threats, customize scenarios, and drop the clean slide-ready output into decks—no macros or finance expertise required.
Customers Bargaining Power
Low Switching Costs
Low switching costs mean players can jump to rival social casino apps with one tap via app store recommendations, driving high volatility in DAU; industry Day-1 churn commonly exceeds 60% and retention often falls below 15% by day 30. Churn spikes when rewards or payout odds feel stingy, so SciPlay must counter with frequent live events, daily bonuses and fresh content to sustain engagement and monetization.
Price Sensitivity to IAP
Pack pricing, bonus multipliers and sale cadence strongly shape conversion; industry 2024 estimates show optimized bundles can lift conversion 10–30%. Whales (top 1–5%) often generate 50–80% of IAP revenue but are discerning about bundle value. Visible discounts train players to expect deals, and poor perceived value can depress ARPDAU rapidly—industry estimates suggest declines up to 15–25%.
Experience and Fairness Expectations
Players judge RTP feel, progression pacing, and ad load harshly, and visible unfairness or heavy ads drive negative reviews that deter new users and depress acquisition ROI; live-ops missteps trigger immediate social backlash across forums and social channels, amplifying churn risk. Trust and transparency in odds and rewards measurably reduce defection and improve LTV.
Global Audience Fragmentation
Global audience fragmentation means preferences shift by region, device and regulatory context, with mobile accounting for roughly 55% of global games revenue in 2023; deep localization and varied payment rails materially sway player choice and monetization. Theme cultural fit drives retention and ARPU variance across markets, and fragmentation amplifies the effective bargaining power of niche cohorts who can dictate feature and payment expectations.
- Regional preferences
- Device split (mobile dominant)
- Regulatory-driven choices
- Localization & payment options
- Cultural fit → higher engagement
Advertisers as Buyers
Advertisers buying SciPlay inventory demand measurable performance and strict brand safety, with 2024 global digital ad spend near $600B pushing higher standards; SciPlay fill rates and eCPMs hinge on advertisers budgets and brand-safety requirements, and seasonal peaks (Q4) increase buyer leverage while off-season softens it. Poor targeting in 2024 reduced willingness to pay, dropping eCPMs by as much as 20-40% in some mobile segments.
- 2024 global digital ad spend ~ $600B
- mobile game eCPM range (2024) ~$1–8
- eCPM drops 20–40% with poor targeting
- Q4 increases advertiser leverage
High churn: Day-1 over 60%, whales 50–80%
Customers hold high bargaining power: low switching costs drive >60% Day-1 churn and <15% D30 retention, forcing aggressive live-ops and discounts. Top 1–5% whales deliver 50–80% IAP, so bundle value and perceived RTP heavily influence ARPDAU (declines 15–25% if mispriced). Regional/mobile fragmentation (mobile ~55% of games revenue 2023) and advertiser eCPM swings ($1–8; 2024 ad spend ~$600B) amplify customer leverage.
| Metric | Value |
|---|---|
| Day-1 churn | >60% |
| D30 retention | <15% |
| Whale revenue share | 50–80% |
| Mobile share (2023) | ~55% |
Preview the Actual Deliverable
SciPlay Porter's Five Forces Analysis
This preview shows the exact SciPlay Porter’s Five Forces analysis you’ll receive—no placeholders or mockups. The full, professionally formatted document is ready for immediate download upon purchase. Use it as-is for due diligence, strategy, or presentation needs.
Original: $10.00
-65%$10.00
$3.50Description
Go Beyond the Preview—Access the Full Strategic Report
SciPlay faces intense competitive rivalry in mobile and social gaming, moderate supplier bargaining power, and evolving buyer expectations driven by free-to-play models. Threat of new entrants is tempered by IP and scale, while substitutes and platform control pose ongoing risks. This snapshot highlights key dynamics. Unlock the full Porter's Five Forces Analysis to explore SciPlay’s competitive dynamics, market pressures, and strategic advantages in detail.
Suppliers Bargaining Power
Platform Gatekeepers
Platform gatekeepers like Apple and Google concentrate power by controlling distribution and charging standard commissions of 30%, with reduced 15% rates under programs for developers earning up to $1 million annually. Policy shifts such as Apple's ATT/IDFA rollout (2021) have materially raised user acquisition costs and limited targeting precision for ad-driven games. App store featuring and ranking decisions can sharply affect installs and revenue, and SciPlay must meet platform guidelines, timelines, and technical requirements to maintain visibility and monetization.
User Acquisition Channels
Ad networks and major social platforms wield significant leverage over SciPlays user acquisition, with Google and Meta capturing roughly 58% of US digital ad spend in 2024 (Insider Intelligence), constraining scale options. Auction dynamics and post-IDFA signal loss raise CPIs, often causing double-digit CPI spikes during major campaigns. Preferential access to inventory or optimization tools is monetized via premium deals and higher CPMs, and dependence intensifies around new game launches and live events.
Game Engines & Cloud
Reliance on engines like Unity (runtime-fee policy announced Sept 2023) and major cloud providers creates high switching costs for SciPlay, tying long-term live-ops to specific runtimes and APIs. Cloud concentration (2024 market shares roughly AWS 31%, Azure 23%, GCP 12%) means pricing or fee changes can compress margins materially. Stable technical support and roadmap alignment are critical for live-ops uptime, and vendor concentration raises outage and cost risks.
Content & IP Licensors
Licensed slot themes and brand partnerships command royalties commonly in the 5–25% range and require licensor approvals; scarce, recognizable IP materially increases supplier bargaining power and can raise engagement metrics by 15–25%. Negotiations often add 3–12 months to time-to-market and determine promotional rights; losing a license can drive 10–30% churn among themed-slot players.
- royalties: 5–25%
- engagement lift: 15–25%
- negotiation delay: 3–12 months
- churn risk: 10–30%
Payments & Ad Mediation
Payment processors, mediation layers and measurement partners set terms and fees that materially affect SciPlay’s margins; Apple and Google take up to 30% of in-app purchases (with reduced 15% tiers for qualifying small developers), while ad mediation and measurement contracts determine revenue splits and data access. Compliance, anti-fraud controls and SDK integrations add operational friction and can lock SciPlay into vendors via historical data and proprietary SDKs.
Suppliers hold sway: app store fees, ad-platform dominance, cloud concentration, royalties
Suppliers (app stores, ad platforms, cloud/engines, licensors, processors) exert high bargaining power: Apple/Google fees 15–30% and featuring control; Meta+Google ~58% US ad spend (2024); cloud concentration AWS 31%/Azure 23%/GCP 12% (2024); licensed IP royalties 5–25% raising churn and time-to-market.
| Supplier | Key metric (2024) |
|---|---|
| App stores | Fees 15–30% |
| Ad platforms | Meta+Google ~58% US spend |
| Cloud | AWS31%/Azure23%/GCP12% |
| Licenses | Royalties 5–25% |
What is included in the product
Detailed Word Document
Tailored Porter's Five Forces analysis for SciPlay that uncovers key drivers of competition, buyer and supplier power, and barriers to entry, while identifying substitutes and emerging threats to its market share.
Customizable Excel Spreadsheet
A one-sheet SciPlay Porter's Five Forces summary with editable pressure levels and instant spider chart lets teams quickly visualize competitive threats, customize scenarios, and drop the clean slide-ready output into decks—no macros or finance expertise required.
Customers Bargaining Power
Low Switching Costs
Low switching costs mean players can jump to rival social casino apps with one tap via app store recommendations, driving high volatility in DAU; industry Day-1 churn commonly exceeds 60% and retention often falls below 15% by day 30. Churn spikes when rewards or payout odds feel stingy, so SciPlay must counter with frequent live events, daily bonuses and fresh content to sustain engagement and monetization.
Price Sensitivity to IAP
Pack pricing, bonus multipliers and sale cadence strongly shape conversion; industry 2024 estimates show optimized bundles can lift conversion 10–30%. Whales (top 1–5%) often generate 50–80% of IAP revenue but are discerning about bundle value. Visible discounts train players to expect deals, and poor perceived value can depress ARPDAU rapidly—industry estimates suggest declines up to 15–25%.
Experience and Fairness Expectations
Players judge RTP feel, progression pacing, and ad load harshly, and visible unfairness or heavy ads drive negative reviews that deter new users and depress acquisition ROI; live-ops missteps trigger immediate social backlash across forums and social channels, amplifying churn risk. Trust and transparency in odds and rewards measurably reduce defection and improve LTV.
Global Audience Fragmentation
Global audience fragmentation means preferences shift by region, device and regulatory context, with mobile accounting for roughly 55% of global games revenue in 2023; deep localization and varied payment rails materially sway player choice and monetization. Theme cultural fit drives retention and ARPU variance across markets, and fragmentation amplifies the effective bargaining power of niche cohorts who can dictate feature and payment expectations.
- Regional preferences
- Device split (mobile dominant)
- Regulatory-driven choices
- Localization & payment options
- Cultural fit → higher engagement
Advertisers as Buyers
Advertisers buying SciPlay inventory demand measurable performance and strict brand safety, with 2024 global digital ad spend near $600B pushing higher standards; SciPlay fill rates and eCPMs hinge on advertisers budgets and brand-safety requirements, and seasonal peaks (Q4) increase buyer leverage while off-season softens it. Poor targeting in 2024 reduced willingness to pay, dropping eCPMs by as much as 20-40% in some mobile segments.
- 2024 global digital ad spend ~ $600B
- mobile game eCPM range (2024) ~$1–8
- eCPM drops 20–40% with poor targeting
- Q4 increases advertiser leverage
High churn: Day-1 over 60%, whales 50–80%
Customers hold high bargaining power: low switching costs drive >60% Day-1 churn and <15% D30 retention, forcing aggressive live-ops and discounts. Top 1–5% whales deliver 50–80% IAP, so bundle value and perceived RTP heavily influence ARPDAU (declines 15–25% if mispriced). Regional/mobile fragmentation (mobile ~55% of games revenue 2023) and advertiser eCPM swings ($1–8; 2024 ad spend ~$600B) amplify customer leverage.
| Metric | Value |
|---|---|
| Day-1 churn | >60% |
| D30 retention | <15% |
| Whale revenue share | 50–80% |
| Mobile share (2023) | ~55% |
Preview the Actual Deliverable
SciPlay Porter's Five Forces Analysis
This preview shows the exact SciPlay Porter’s Five Forces analysis you’ll receive—no placeholders or mockups. The full, professionally formatted document is ready for immediate download upon purchase. Use it as-is for due diligence, strategy, or presentation needs.











