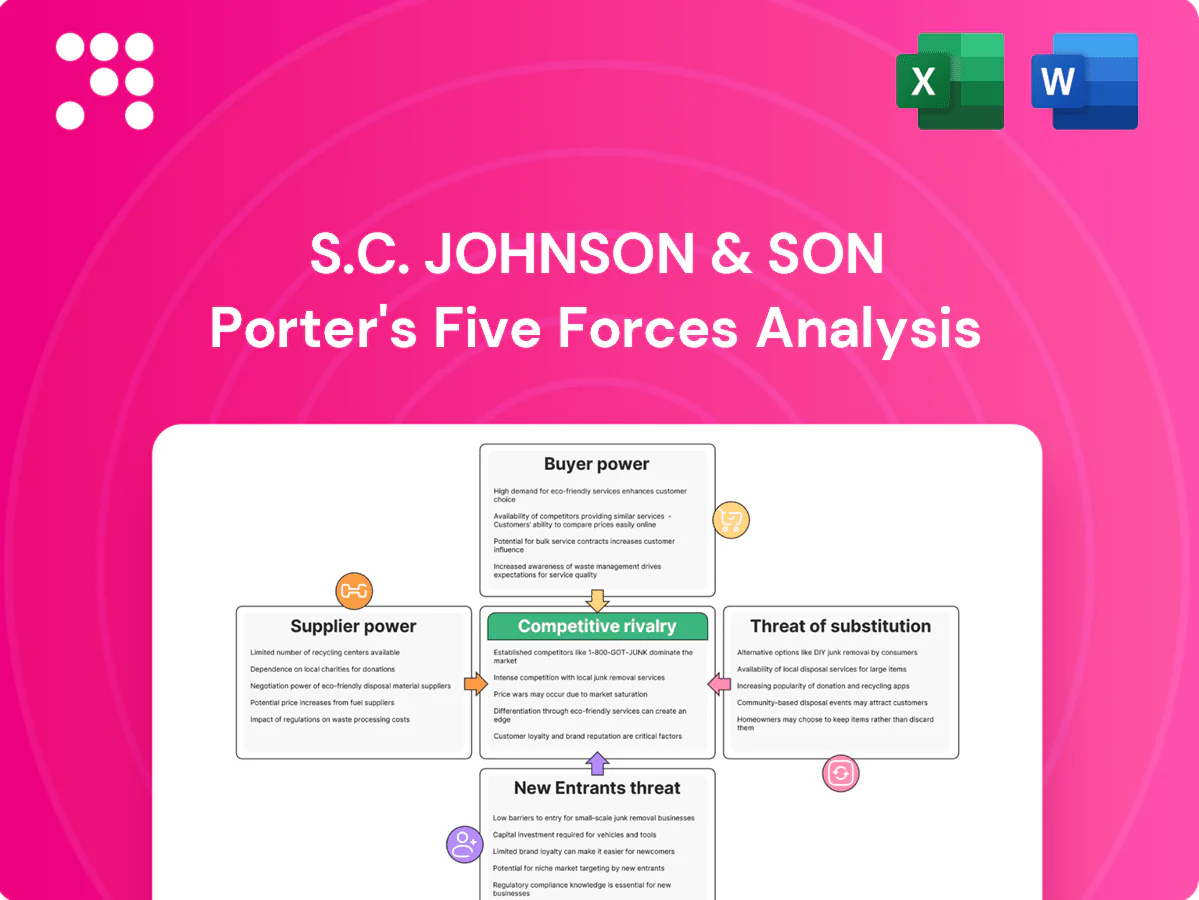
S.C. Johnson & Son Porter's Five Forces Analysis

Elevate Your Analysis with the Complete Porter's Five Forces Analysis
S.C. Johnson & Son faces intense intra-industry rivalry and strong buyer sensitivity, while supplier power is moderate and barriers to entry are high due to scale, brands, and distribution; substitute threats are moderate across categories. This snapshot highlights key competitive pressures but leaves nuance unexplored. Unlock the full Porter's Five Forces Analysis to explore force-by-force ratings, visuals, and strategic implications for S.C. Johnson & Son.
Suppliers Bargaining Power

Concentrated fragrance houses
Core scent inputs are concentrated: the top fragrance houses (Givaudan, Firmenich, IFF, Symrise) account for roughly 60–70% of the global market, letting suppliers influence price and contract terms. SC Johnson’s reliance on consistent signature scents creates switching costs and raises supplier bargaining power. Long-term partnerships lower supply risk but limit SC Johnson’s leverage, while any supplier capacity tightness or regulatory change can quickly increase costs and delay launches.
Petrochemical feedstock volatility
Surfactants, solvents and plastics track oil and gas cycles—Brent averaged ~86 USD/bbl in H1 2024—so feedstock swings can drive input cost moves up to ~20% YoY in petrochemical segments, enabling suppliers to levy surcharges that compress gross margins. Hedging and formulation flexibility mitigate but cannot fully offset sharp spikes, while shifts to bio-based inputs often carry 10–25% cost premiums.

Specialized packaging dependencies
Aerosol cans, valves and child‑resistant closures are concentrated among a few qualified suppliers such as Ball, Silgan and Aptar, creating high supplier power for S.C. Johnson. Tooling, validation and regulatory qualification raise switching costs and mean retooling can take months and millions in capital. Supply disruptions have recently delayed product launches and forced costly re‑specifications, and regionalizing supply or dual‑sourcing reduces but does not eliminate exposure.

Regulatory and compliance burden
REACH (≈24,000 registered substances in 2024), EPA/TSCA (≈86,000 chemicals on the inventory) and country-specific bans restrict available raw materials, raising supplier leverage. Suppliers with certified regulatory dossiers command premium terms; documentation and testing (often $100k+ per substance) slow onboarding, and 6–24 month compliance timelines often lock S.C. Johnson into incumbent suppliers.
- REACH ≈24,000 substances (2024)
- TSCA inventory ≈86,000
- Testing costs >$100k/substance
- Compliance timelines 6–24 months
Scale balances leverage
SC Johnson’s scale—over $10 billion in annual sales in 2024—gives clear negotiating clout on price and service levels; multi-year, multi-region contracts frequently lock in capacity and rebates; supplier scorecards and joint innovation partnerships align incentives; however, niche specialty inputs (eg, certain surfactants, fragrance accords) remain less contestable.
- Scale: >$10B revenue (2024)
- Contracts: multi-year, multi-region capacity/rebates
- Governance: supplier scorecards + innovation partnerships
- Risk: niche inputs less contestable
Fragrance majors hold 60-70% share; petro feedstock volatility, regulations lift costs
Core fragrance houses control ~60–70% global share, raising supplier leverage; S.C. Johnson scale (> $10B revenue 2024) offsets but niche inputs remain costly. Petrochemical feedstocks (Brent ~86 USD/bbl H1 2024) drive ~20% YoY swings in some inputs. Regulatory burdens (REACH ≈24,000; TSCA ≈86,000) and testing >$100k increase switching costs.
| Item | 2024 metric |
|---|---|
| Fragrance market share | 60–70% |
| Revenue | >$10B |
| Brent H1 2024 | $86/bbl |
| Input cost swing | ~20% YoY |
| REACH | ≈24,000 |
| TSCA | ≈86,000 |
| Testing cost | >$100k/substance |
What is included in the product
 Detailed Word Document
Uncovers key drivers of competition, supplier and buyer power, substitutes, and entry risks specific to S.C. Johnson & Son; identifies disruptive threats and defensive advantages that shape its pricing, margins, and strategic positioning.

 Customizable Excel Spreadsheet
Concise Porter's Five Forces for S.C. Johnson & Son—one-sheet clarity that instantly highlights supplier, buyer, rivalry, entrant and substitute pressures so teams can prioritize defensive moves and growth opportunities.
Customers Bargaining Power

Dominant retail channels
Mass merchants, club stores and e-commerce platforms (Amazon ~41% of US e‑commerce in 2023; US e‑commerce ~16% of retail in 2024) exert high bargaining power, demanding lower net prices, slotting fees and promotional funding. Delisting threats compress S.C. Johnson’s margins and force concessions. Required omni‑channel presence limits true walk‑away options for the firm.
Private label alternatives
Retailers aggressively promote store brands at value price points, lifting private-label penetration (US grocery private label ~20% in 2024) and increasing price elasticity and buyer leverage over branded suppliers. SC Johnson, with roughly $11.1 billion in 2023 sales, must justify price premiums through demonstrable performance and brand equity. Economic downturns historically amplify trading-down and boost private-label gains.

Data-driven category management
Buyers leverage granular POS and shopper data to optimize assortments, accelerating SKU reviews in 2024 so underperformers can be delisted within 12–18 months. Vendors face firm demands for joint business plans and ROI-backed funding tied to trade spend and promotional support. Rapid churn and retailer expectations make strong analytics and 99%+ supply performance essential to defend shelf space.

End-consumer price sensitivity
End-consumer price sensitivity is high in frequently purchased, promotion-driven categories, with shoppers switching brands for deals unless clear differentiation exists. Loyalty centers on a few hero SKUs rather than broad portfolios. Inflation spikes (US CPI peak 9.1% June 2022; 2023 annual 3.4%) intensify deal-seeking and pack-size downtrading.
- Promotion-driven buying: frequent deal-switching
- Hero SKUs: pockets of strong loyalty, not universal
- Inflation effect: 9.1% peak (Jun 2022) → increased pack-size shifts
Sustainability expectations
Retailers and consumers increasingly demand recyclable packaging and safer chemistries, with 2024 surveys indicating about 70% of shoppers prioritize sustainability; compliance raises production costs that many buyers resist absorbing. Eco-labels and ingredient transparency now shape assortment and shelf space decisions, while meeting ESG targets can secure listings but compress margins and tighten S.C. Johnson’s economics.
- Retailer mandates raise supplier compliance costs
- ~70% consumers prioritize sustainability (2024)
- Eco-labels drive assortment but squeeze margins
Retail giants and private labels squeeze CPG margins as e-commerce and promo spend rise
Mass merchants, club stores and e‑commerce (Amazon ~41% of US e‑commerce 2023; US e‑commerce ~16% of retail 2024) exert high bargaining power, pressuring net prices and promotions. Private label (~20% US grocery 2024) and promo-driven shoppers (~70% prioritize sustainability/value 2024) raise price elasticity. SC Johnson ($11.1B sales 2023) must fund trade spend and meet mandates, compressing margins.
| Metric | 2023–24 |
|---|---|
| Amazon share (US e‑commerce) | ~41% (2023) |
| SC Johnson sales | $11.1B (2023) |
| US e‑commerce of retail | ~16% (2024) |
| Private label grocery | ~20% (2024) |
| Shoppers prioritizing sustainability/value | ~70% (2024) |
Same Document Delivered
S.C. Johnson & Son Porter's Five Forces Analysis
This preview is the exact Porter's Five Forces analysis for S.C. Johnson & Son you’ll receive after purchase—no placeholders or mockups. The document shown is fully formatted, professionally written, and ready to download the moment you buy. What you see here is the complete deliverable, ready for immediate use in strategy or valuation work.

Elevate Your Analysis with the Complete Porter's Five Forces Analysis
S.C. Johnson & Son faces intense intra-industry rivalry and strong buyer sensitivity, while supplier power is moderate and barriers to entry are high due to scale, brands, and distribution; substitute threats are moderate across categories. This snapshot highlights key competitive pressures but leaves nuance unexplored. Unlock the full Porter's Five Forces Analysis to explore force-by-force ratings, visuals, and strategic implications for S.C. Johnson & Son.
Suppliers Bargaining Power
Concentrated fragrance houses
Core scent inputs are concentrated: the top fragrance houses (Givaudan, Firmenich, IFF, Symrise) account for roughly 60–70% of the global market, letting suppliers influence price and contract terms. SC Johnson’s reliance on consistent signature scents creates switching costs and raises supplier bargaining power. Long-term partnerships lower supply risk but limit SC Johnson’s leverage, while any supplier capacity tightness or regulatory change can quickly increase costs and delay launches.
Petrochemical feedstock volatility
Surfactants, solvents and plastics track oil and gas cycles—Brent averaged ~86 USD/bbl in H1 2024—so feedstock swings can drive input cost moves up to ~20% YoY in petrochemical segments, enabling suppliers to levy surcharges that compress gross margins. Hedging and formulation flexibility mitigate but cannot fully offset sharp spikes, while shifts to bio-based inputs often carry 10–25% cost premiums.
Specialized packaging dependencies
Aerosol cans, valves and child‑resistant closures are concentrated among a few qualified suppliers such as Ball, Silgan and Aptar, creating high supplier power for S.C. Johnson. Tooling, validation and regulatory qualification raise switching costs and mean retooling can take months and millions in capital. Supply disruptions have recently delayed product launches and forced costly re‑specifications, and regionalizing supply or dual‑sourcing reduces but does not eliminate exposure.
Regulatory and compliance burden
REACH (≈24,000 registered substances in 2024), EPA/TSCA (≈86,000 chemicals on the inventory) and country-specific bans restrict available raw materials, raising supplier leverage. Suppliers with certified regulatory dossiers command premium terms; documentation and testing (often $100k+ per substance) slow onboarding, and 6–24 month compliance timelines often lock S.C. Johnson into incumbent suppliers.
- REACH ≈24,000 substances (2024)
- TSCA inventory ≈86,000
- Testing costs >$100k/substance
- Compliance timelines 6–24 months
Scale balances leverage
SC Johnson’s scale—over $10 billion in annual sales in 2024—gives clear negotiating clout on price and service levels; multi-year, multi-region contracts frequently lock in capacity and rebates; supplier scorecards and joint innovation partnerships align incentives; however, niche specialty inputs (eg, certain surfactants, fragrance accords) remain less contestable.
- Scale: >$10B revenue (2024)
- Contracts: multi-year, multi-region capacity/rebates
- Governance: supplier scorecards + innovation partnerships
- Risk: niche inputs less contestable
Fragrance majors hold 60-70% share; petro feedstock volatility, regulations lift costs
Core fragrance houses control ~60–70% global share, raising supplier leverage; S.C. Johnson scale (> $10B revenue 2024) offsets but niche inputs remain costly. Petrochemical feedstocks (Brent ~86 USD/bbl H1 2024) drive ~20% YoY swings in some inputs. Regulatory burdens (REACH ≈24,000; TSCA ≈86,000) and testing >$100k increase switching costs.
| Item | 2024 metric |
|---|---|
| Fragrance market share | 60–70% |
| Revenue | >$10B |
| Brent H1 2024 | $86/bbl |
| Input cost swing | ~20% YoY |
| REACH | ≈24,000 |
| TSCA | ≈86,000 |
| Testing cost | >$100k/substance |
What is included in the product
Detailed Word Document
Uncovers key drivers of competition, supplier and buyer power, substitutes, and entry risks specific to S.C. Johnson & Son; identifies disruptive threats and defensive advantages that shape its pricing, margins, and strategic positioning.
Customizable Excel Spreadsheet
Concise Porter's Five Forces for S.C. Johnson & Son—one-sheet clarity that instantly highlights supplier, buyer, rivalry, entrant and substitute pressures so teams can prioritize defensive moves and growth opportunities.
Customers Bargaining Power
Dominant retail channels
Mass merchants, club stores and e-commerce platforms (Amazon ~41% of US e‑commerce in 2023; US e‑commerce ~16% of retail in 2024) exert high bargaining power, demanding lower net prices, slotting fees and promotional funding. Delisting threats compress S.C. Johnson’s margins and force concessions. Required omni‑channel presence limits true walk‑away options for the firm.
Private label alternatives
Retailers aggressively promote store brands at value price points, lifting private-label penetration (US grocery private label ~20% in 2024) and increasing price elasticity and buyer leverage over branded suppliers. SC Johnson, with roughly $11.1 billion in 2023 sales, must justify price premiums through demonstrable performance and brand equity. Economic downturns historically amplify trading-down and boost private-label gains.
Data-driven category management
Buyers leverage granular POS and shopper data to optimize assortments, accelerating SKU reviews in 2024 so underperformers can be delisted within 12–18 months. Vendors face firm demands for joint business plans and ROI-backed funding tied to trade spend and promotional support. Rapid churn and retailer expectations make strong analytics and 99%+ supply performance essential to defend shelf space.
End-consumer price sensitivity
End-consumer price sensitivity is high in frequently purchased, promotion-driven categories, with shoppers switching brands for deals unless clear differentiation exists. Loyalty centers on a few hero SKUs rather than broad portfolios. Inflation spikes (US CPI peak 9.1% June 2022; 2023 annual 3.4%) intensify deal-seeking and pack-size downtrading.
- Promotion-driven buying: frequent deal-switching
- Hero SKUs: pockets of strong loyalty, not universal
- Inflation effect: 9.1% peak (Jun 2022) → increased pack-size shifts
Sustainability expectations
Retailers and consumers increasingly demand recyclable packaging and safer chemistries, with 2024 surveys indicating about 70% of shoppers prioritize sustainability; compliance raises production costs that many buyers resist absorbing. Eco-labels and ingredient transparency now shape assortment and shelf space decisions, while meeting ESG targets can secure listings but compress margins and tighten S.C. Johnson’s economics.
- Retailer mandates raise supplier compliance costs
- ~70% consumers prioritize sustainability (2024)
- Eco-labels drive assortment but squeeze margins
Retail giants and private labels squeeze CPG margins as e-commerce and promo spend rise
Mass merchants, club stores and e‑commerce (Amazon ~41% of US e‑commerce 2023; US e‑commerce ~16% of retail 2024) exert high bargaining power, pressuring net prices and promotions. Private label (~20% US grocery 2024) and promo-driven shoppers (~70% prioritize sustainability/value 2024) raise price elasticity. SC Johnson ($11.1B sales 2023) must fund trade spend and meet mandates, compressing margins.
| Metric | 2023–24 |
|---|---|
| Amazon share (US e‑commerce) | ~41% (2023) |
| SC Johnson sales | $11.1B (2023) |
| US e‑commerce of retail | ~16% (2024) |
| Private label grocery | ~20% (2024) |
| Shoppers prioritizing sustainability/value | ~70% (2024) |
Same Document Delivered
S.C. Johnson & Son Porter's Five Forces Analysis
This preview is the exact Porter's Five Forces analysis for S.C. Johnson & Son you’ll receive after purchase—no placeholders or mockups. The document shown is fully formatted, professionally written, and ready to download the moment you buy. What you see here is the complete deliverable, ready for immediate use in strategy or valuation work.
Original: $10.00
-65%$10.00
$3.50Description
Elevate Your Analysis with the Complete Porter's Five Forces Analysis
S.C. Johnson & Son faces intense intra-industry rivalry and strong buyer sensitivity, while supplier power is moderate and barriers to entry are high due to scale, brands, and distribution; substitute threats are moderate across categories. This snapshot highlights key competitive pressures but leaves nuance unexplored. Unlock the full Porter's Five Forces Analysis to explore force-by-force ratings, visuals, and strategic implications for S.C. Johnson & Son.
Suppliers Bargaining Power
Concentrated fragrance houses
Core scent inputs are concentrated: the top fragrance houses (Givaudan, Firmenich, IFF, Symrise) account for roughly 60–70% of the global market, letting suppliers influence price and contract terms. SC Johnson’s reliance on consistent signature scents creates switching costs and raises supplier bargaining power. Long-term partnerships lower supply risk but limit SC Johnson’s leverage, while any supplier capacity tightness or regulatory change can quickly increase costs and delay launches.
Petrochemical feedstock volatility
Surfactants, solvents and plastics track oil and gas cycles—Brent averaged ~86 USD/bbl in H1 2024—so feedstock swings can drive input cost moves up to ~20% YoY in petrochemical segments, enabling suppliers to levy surcharges that compress gross margins. Hedging and formulation flexibility mitigate but cannot fully offset sharp spikes, while shifts to bio-based inputs often carry 10–25% cost premiums.
Specialized packaging dependencies
Aerosol cans, valves and child‑resistant closures are concentrated among a few qualified suppliers such as Ball, Silgan and Aptar, creating high supplier power for S.C. Johnson. Tooling, validation and regulatory qualification raise switching costs and mean retooling can take months and millions in capital. Supply disruptions have recently delayed product launches and forced costly re‑specifications, and regionalizing supply or dual‑sourcing reduces but does not eliminate exposure.
Regulatory and compliance burden
REACH (≈24,000 registered substances in 2024), EPA/TSCA (≈86,000 chemicals on the inventory) and country-specific bans restrict available raw materials, raising supplier leverage. Suppliers with certified regulatory dossiers command premium terms; documentation and testing (often $100k+ per substance) slow onboarding, and 6–24 month compliance timelines often lock S.C. Johnson into incumbent suppliers.
- REACH ≈24,000 substances (2024)
- TSCA inventory ≈86,000
- Testing costs >$100k/substance
- Compliance timelines 6–24 months
Scale balances leverage
SC Johnson’s scale—over $10 billion in annual sales in 2024—gives clear negotiating clout on price and service levels; multi-year, multi-region contracts frequently lock in capacity and rebates; supplier scorecards and joint innovation partnerships align incentives; however, niche specialty inputs (eg, certain surfactants, fragrance accords) remain less contestable.
- Scale: >$10B revenue (2024)
- Contracts: multi-year, multi-region capacity/rebates
- Governance: supplier scorecards + innovation partnerships
- Risk: niche inputs less contestable
Fragrance majors hold 60-70% share; petro feedstock volatility, regulations lift costs
Core fragrance houses control ~60–70% global share, raising supplier leverage; S.C. Johnson scale (> $10B revenue 2024) offsets but niche inputs remain costly. Petrochemical feedstocks (Brent ~86 USD/bbl H1 2024) drive ~20% YoY swings in some inputs. Regulatory burdens (REACH ≈24,000; TSCA ≈86,000) and testing >$100k increase switching costs.
| Item | 2024 metric |
|---|---|
| Fragrance market share | 60–70% |
| Revenue | >$10B |
| Brent H1 2024 | $86/bbl |
| Input cost swing | ~20% YoY |
| REACH | ≈24,000 |
| TSCA | ≈86,000 |
| Testing cost | >$100k/substance |
What is included in the product
Detailed Word Document
Uncovers key drivers of competition, supplier and buyer power, substitutes, and entry risks specific to S.C. Johnson & Son; identifies disruptive threats and defensive advantages that shape its pricing, margins, and strategic positioning.
Customizable Excel Spreadsheet
Concise Porter's Five Forces for S.C. Johnson & Son—one-sheet clarity that instantly highlights supplier, buyer, rivalry, entrant and substitute pressures so teams can prioritize defensive moves and growth opportunities.
Customers Bargaining Power
Dominant retail channels
Mass merchants, club stores and e-commerce platforms (Amazon ~41% of US e‑commerce in 2023; US e‑commerce ~16% of retail in 2024) exert high bargaining power, demanding lower net prices, slotting fees and promotional funding. Delisting threats compress S.C. Johnson’s margins and force concessions. Required omni‑channel presence limits true walk‑away options for the firm.
Private label alternatives
Retailers aggressively promote store brands at value price points, lifting private-label penetration (US grocery private label ~20% in 2024) and increasing price elasticity and buyer leverage over branded suppliers. SC Johnson, with roughly $11.1 billion in 2023 sales, must justify price premiums through demonstrable performance and brand equity. Economic downturns historically amplify trading-down and boost private-label gains.
Data-driven category management
Buyers leverage granular POS and shopper data to optimize assortments, accelerating SKU reviews in 2024 so underperformers can be delisted within 12–18 months. Vendors face firm demands for joint business plans and ROI-backed funding tied to trade spend and promotional support. Rapid churn and retailer expectations make strong analytics and 99%+ supply performance essential to defend shelf space.
End-consumer price sensitivity
End-consumer price sensitivity is high in frequently purchased, promotion-driven categories, with shoppers switching brands for deals unless clear differentiation exists. Loyalty centers on a few hero SKUs rather than broad portfolios. Inflation spikes (US CPI peak 9.1% June 2022; 2023 annual 3.4%) intensify deal-seeking and pack-size downtrading.
- Promotion-driven buying: frequent deal-switching
- Hero SKUs: pockets of strong loyalty, not universal
- Inflation effect: 9.1% peak (Jun 2022) → increased pack-size shifts
Sustainability expectations
Retailers and consumers increasingly demand recyclable packaging and safer chemistries, with 2024 surveys indicating about 70% of shoppers prioritize sustainability; compliance raises production costs that many buyers resist absorbing. Eco-labels and ingredient transparency now shape assortment and shelf space decisions, while meeting ESG targets can secure listings but compress margins and tighten S.C. Johnson’s economics.
- Retailer mandates raise supplier compliance costs
- ~70% consumers prioritize sustainability (2024)
- Eco-labels drive assortment but squeeze margins
Retail giants and private labels squeeze CPG margins as e-commerce and promo spend rise
Mass merchants, club stores and e‑commerce (Amazon ~41% of US e‑commerce 2023; US e‑commerce ~16% of retail 2024) exert high bargaining power, pressuring net prices and promotions. Private label (~20% US grocery 2024) and promo-driven shoppers (~70% prioritize sustainability/value 2024) raise price elasticity. SC Johnson ($11.1B sales 2023) must fund trade spend and meet mandates, compressing margins.
| Metric | 2023–24 |
|---|---|
| Amazon share (US e‑commerce) | ~41% (2023) |
| SC Johnson sales | $11.1B (2023) |
| US e‑commerce of retail | ~16% (2024) |
| Private label grocery | ~20% (2024) |
| Shoppers prioritizing sustainability/value | ~70% (2024) |
Same Document Delivered
S.C. Johnson & Son Porter's Five Forces Analysis
This preview is the exact Porter's Five Forces analysis for S.C. Johnson & Son you’ll receive after purchase—no placeholders or mockups. The document shown is fully formatted, professionally written, and ready to download the moment you buy. What you see here is the complete deliverable, ready for immediate use in strategy or valuation work.











