Scripps Porter's Five Forces Analysis

Go Beyond the Preview—Access the Full Strategic Report
Scripps faces varied competitive pressures—from advertiser bargaining and digital substitutes to regional consolidation and content costs—shaping margins and growth outlook. This snapshot highlights key threats and leverage points for strategy and investment. Ready for deeper analysis? Unlock the full Porter's Five Forces report for force-by-force ratings, visuals, and actionable insights tailored to Scripps.
Suppliers Bargaining Power

Concentrated premium content owners
Major studios and leagues concentrate premium programming—Disney, Warner Bros. Discovery and Comcast control vast libraries while the NFL struck media deals exceeding $110 billion, boosting license fees and limiting substitution. Exclusive rights windows create take‑it‑or‑leave‑it leverage and multi‑year deals lock Scripps into rising costs and less flexibility. Scripps’ in‑house local news mitigates some exposure, but marquee sports and studio content retain pricing power.
Distribution tech and measurement vendors
Reliance on Nielsen and a small set of alternative currency providers plus ad-tech stacks concentrates bargaining power among a few suppliers, giving them outsized influence over pricing and audience valuation. Methodology shifts, such as Nielsen's ongoing currency updates in 2024, can materially change inventory valuation and CPMs. High switching costs, integration risk, and interoperability issues further raise supplier leverage, and recent vendor consolidation trends have pushed fees and data dependency higher.

Talent, unions, and production crews
On-air talent and unionized production crews exert clear supplier power through collective bargaining and scarcity; BLS 2024 median pay for broadcast reporters and anchors is roughly $55,000, while top-market anchors command six-figure salaries. Strikes and negotiations have demonstrable impact on costs and schedules, as seen industry-wide during 2023–24 labor actions. Local news pipelines reduce hiring risk but cannot offset premium pay for marquee talent. Contract cycles produce periodic cost spikes in staffing budgets.

Network affiliation and carriage partners
Affiliation agreements with major networks shape programming cost and inventory allocation; Scripps expanded carriage scale after the 2020 Ion Media acquisition. Networks can alter reverse compensation and content windows, directly squeezing local station margins. Loss or downgrade of an affiliation materially increases supplier leverage, and renewal windows (often clustered) create asymmetric negotiation pressure; 2023 retransmission payments to broadcasters were about $10 billion.
- Affiliation impact on programming cost
- Reverse comp & content-term pressure
- Affiliation loss raises supplier leverage
- Renewal windows create asymmetry
Cloud, CDN, and transmission equipment
Specialized broadcast gear and cloud/CDN suppliers exert moderate leverage over Scripps given limited alternatives and AWS/Azure/GCP commanding ~65% of cloud market in 2024. Capex intensity and multi-year maintenance contracts create vendor lock-in; 99.99% uptime SLAs and spectrum-efficiency needs constrain switching. Volume commitments can buy ~5–20% discounts but reduce flexibility.
- Market share: top-3 cloud ~65% (2024)
- Typical SLA: 99.99%
- Discounts from volume: ~5–20%
- Broadcast equipment market concentration increases lock-in
Suppliers wield leverage: media rights, cloud concentration and ad-tech drive cost pressure
Suppliers hold meaningful leverage: studios/leagues drive licensing (NFL deals >110 billion) and top‑3 cloud share ~65% in 2024, raising costs and lock‑in. Audience‑measurement shifts (Nielsen 2024 updates) and ad‑tech concentration increase pricing power; talent unions and affiliation renewals cause periodic cost spikes. Scripps' local news and scale mitigate but do not eliminate supplier power.
| Supplier | 2024 metric | Impact |
|---|---|---|
| Studios/Leagues | NFL deals >110B | High licensing power |
| Cloud | Top‑3 ~65% share | Lock‑in, ↑costs |
| Nielsen/ad‑tech | Currency updates 2024 | CPM volatility |
What is included in the product
 Detailed Word Document
Concise Porter's Five Forces analysis for Scripps outlining competitive rivalry, buyer and supplier power, threats from new entrants and substitutes, and strategic implications for pricing, margins, and market positioning to inform investor and management decisions.

 Customizable Excel Spreadsheet
Scripps Porter's Five Forces one-sheet instantly exposes competitive pain points and priority pressures so teams can act faster. Editable inputs and a clear radar visualization make it easy to tailor scenarios, export to decks, and align strategy without heavy analysis.
Customers Bargaining Power

Consolidated national advertisers
Agency holding companies aggregate client spend and demand favorable CPMs and make-goods, concentrating bargaining power across Scripps Porter’s inventory. They can reallocate budgets rapidly between linear TV, CTV and digital — CTV ad spend grew about 25% in 2023 — increasing leverage. Data-driven buying and programmatic transparency compress price spreads and raise pressure on rates. Upfront and out-of-home cycles, which often lock ~30% of annual TV budgets, further amplify negotiators’ clout.
Local advertisers’ price sensitivity
SMBs, which make up 99% of US firms, are intensely ROI-sensitive and press for measurable value and promotions, especially across economic cycles. Local station competition and low switching costs amplify buyer power as advertisers move to cheaper or digital options. Scripps’ audience-targeting and bundled inventory can sustain rates, but historical discounting during downturns shows elevated price pressure.

MVPDs and vMVPDs as fee payers
Distributors buying retransmission consent are regionally concentrated; the top three U.S. MVPDs (Comcast, Charter, Dish) control roughly 60% of multichannel subscribers, enabling aggressive pushback on fee hikes and risking blackouts. Their scale forces packaging demands and tie-ins across channels. Ongoing cord-cutting—pay-TV households down over 40% since 2010—shrinks the pie and strengthens buyer leverage on price.

Programmatic and CTV buyers
Automated auctions boost liquidity but compress margins as auction dynamics favor lowest clearing prices; in 2024 programmatic accounted for roughly 86% of US display transactions, increasing buyer leverage. Cross-channel performance comparisons push down CTV rates as buyers allocate spend to highest ROI channels; US CTV ad spend was about $19 billion in 2024, intensifying scrutiny. Curated PMPs can preserve premiums but need clean data and verification; identity/privacy shifts (cookieless, UID2, walled gardens) move leverage toward platforms that control deterministic audiences.
- Programmatic liquidity: ~86% of US display transactions (2024)
- US CTV spend: ~$19B (2024)
- PMPs: require verified first‑party data to sustain premiums
- Identity changes: leverage shifts to platform-controlled audiences
Audience fragmentation to alternatives
Audience fragmentation to streaming and social in 2024 shrinks broadcast effective reach, giving advertisers leverage to push CPMs lower as cross-platform switching rises; cross-screen frequency capping and outcome guarantees increase performance expectations while measurement currency choice remains a buyer lever, and bundled broadcast+network+digital packages can blunt that power.
- Streaming/social now ~35% of daily video time (2024)
- Cross-screen capping and guarantees raise ROI demands
- Bundles across channels reduce buyer leverage
- Measurement currency selection is a key buyer tool
Concentrated buyers and programmatic dominance squeeze CPMs; PMPs preserve premiums
Buyers concentrated via agencies and MVPDs exert strong price pressure; programmatic liquidity (≈86% display, 2024) and CTV allocation ($19B, 2024) raise leverage. Audience fragmentation (streaming/social ~35% daily, 2024) and pay-TV decline compress CPMs, while PMPs and bundles can preserve premiums.
| Metric | 2024 |
|---|---|
| Programmatic share | ~86% |
| US CTV spend | $19B |
| Streaming/social time | ~35% |
| Top3 MVPDs share | ~60% |
What You See Is What You Get
Scripps Porter's Five Forces Analysis
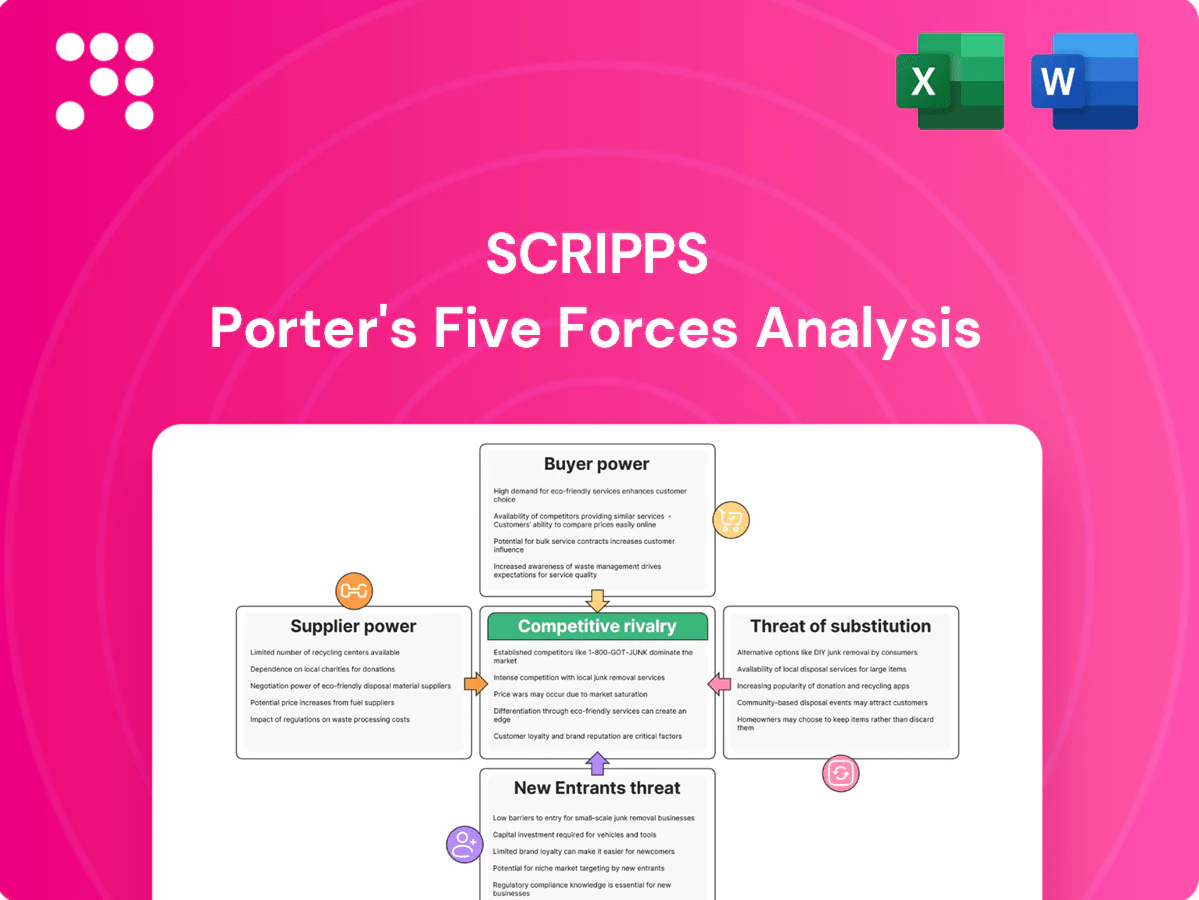
This preview shows the exact Scripps Porter’s Five Forces analysis you'll receive immediately after purchase—no surprises or placeholders. The document is fully formatted, professionally written, and ready for download and use the moment you buy. What you preview is the final, complete deliverable.

Go Beyond the Preview—Access the Full Strategic Report
Scripps faces varied competitive pressures—from advertiser bargaining and digital substitutes to regional consolidation and content costs—shaping margins and growth outlook. This snapshot highlights key threats and leverage points for strategy and investment. Ready for deeper analysis? Unlock the full Porter's Five Forces report for force-by-force ratings, visuals, and actionable insights tailored to Scripps.
Suppliers Bargaining Power
Concentrated premium content owners
Major studios and leagues concentrate premium programming—Disney, Warner Bros. Discovery and Comcast control vast libraries while the NFL struck media deals exceeding $110 billion, boosting license fees and limiting substitution. Exclusive rights windows create take‑it‑or‑leave‑it leverage and multi‑year deals lock Scripps into rising costs and less flexibility. Scripps’ in‑house local news mitigates some exposure, but marquee sports and studio content retain pricing power.
Distribution tech and measurement vendors
Reliance on Nielsen and a small set of alternative currency providers plus ad-tech stacks concentrates bargaining power among a few suppliers, giving them outsized influence over pricing and audience valuation. Methodology shifts, such as Nielsen's ongoing currency updates in 2024, can materially change inventory valuation and CPMs. High switching costs, integration risk, and interoperability issues further raise supplier leverage, and recent vendor consolidation trends have pushed fees and data dependency higher.
Talent, unions, and production crews
On-air talent and unionized production crews exert clear supplier power through collective bargaining and scarcity; BLS 2024 median pay for broadcast reporters and anchors is roughly $55,000, while top-market anchors command six-figure salaries. Strikes and negotiations have demonstrable impact on costs and schedules, as seen industry-wide during 2023–24 labor actions. Local news pipelines reduce hiring risk but cannot offset premium pay for marquee talent. Contract cycles produce periodic cost spikes in staffing budgets.
Network affiliation and carriage partners
Affiliation agreements with major networks shape programming cost and inventory allocation; Scripps expanded carriage scale after the 2020 Ion Media acquisition. Networks can alter reverse compensation and content windows, directly squeezing local station margins. Loss or downgrade of an affiliation materially increases supplier leverage, and renewal windows (often clustered) create asymmetric negotiation pressure; 2023 retransmission payments to broadcasters were about $10 billion.
- Affiliation impact on programming cost
- Reverse comp & content-term pressure
- Affiliation loss raises supplier leverage
- Renewal windows create asymmetry
Cloud, CDN, and transmission equipment
Specialized broadcast gear and cloud/CDN suppliers exert moderate leverage over Scripps given limited alternatives and AWS/Azure/GCP commanding ~65% of cloud market in 2024. Capex intensity and multi-year maintenance contracts create vendor lock-in; 99.99% uptime SLAs and spectrum-efficiency needs constrain switching. Volume commitments can buy ~5–20% discounts but reduce flexibility.
- Market share: top-3 cloud ~65% (2024)
- Typical SLA: 99.99%
- Discounts from volume: ~5–20%
- Broadcast equipment market concentration increases lock-in
Suppliers wield leverage: media rights, cloud concentration and ad-tech drive cost pressure
Suppliers hold meaningful leverage: studios/leagues drive licensing (NFL deals >110 billion) and top‑3 cloud share ~65% in 2024, raising costs and lock‑in. Audience‑measurement shifts (Nielsen 2024 updates) and ad‑tech concentration increase pricing power; talent unions and affiliation renewals cause periodic cost spikes. Scripps' local news and scale mitigate but do not eliminate supplier power.
| Supplier | 2024 metric | Impact |
|---|---|---|
| Studios/Leagues | NFL deals >110B | High licensing power |
| Cloud | Top‑3 ~65% share | Lock‑in, ↑costs |
| Nielsen/ad‑tech | Currency updates 2024 | CPM volatility |
What is included in the product
Detailed Word Document
Concise Porter's Five Forces analysis for Scripps outlining competitive rivalry, buyer and supplier power, threats from new entrants and substitutes, and strategic implications for pricing, margins, and market positioning to inform investor and management decisions.
Customizable Excel Spreadsheet
Scripps Porter's Five Forces one-sheet instantly exposes competitive pain points and priority pressures so teams can act faster. Editable inputs and a clear radar visualization make it easy to tailor scenarios, export to decks, and align strategy without heavy analysis.
Customers Bargaining Power
Consolidated national advertisers
Agency holding companies aggregate client spend and demand favorable CPMs and make-goods, concentrating bargaining power across Scripps Porter’s inventory. They can reallocate budgets rapidly between linear TV, CTV and digital — CTV ad spend grew about 25% in 2023 — increasing leverage. Data-driven buying and programmatic transparency compress price spreads and raise pressure on rates. Upfront and out-of-home cycles, which often lock ~30% of annual TV budgets, further amplify negotiators’ clout.
Local advertisers’ price sensitivity
SMBs, which make up 99% of US firms, are intensely ROI-sensitive and press for measurable value and promotions, especially across economic cycles. Local station competition and low switching costs amplify buyer power as advertisers move to cheaper or digital options. Scripps’ audience-targeting and bundled inventory can sustain rates, but historical discounting during downturns shows elevated price pressure.
MVPDs and vMVPDs as fee payers
Distributors buying retransmission consent are regionally concentrated; the top three U.S. MVPDs (Comcast, Charter, Dish) control roughly 60% of multichannel subscribers, enabling aggressive pushback on fee hikes and risking blackouts. Their scale forces packaging demands and tie-ins across channels. Ongoing cord-cutting—pay-TV households down over 40% since 2010—shrinks the pie and strengthens buyer leverage on price.
Programmatic and CTV buyers
Automated auctions boost liquidity but compress margins as auction dynamics favor lowest clearing prices; in 2024 programmatic accounted for roughly 86% of US display transactions, increasing buyer leverage. Cross-channel performance comparisons push down CTV rates as buyers allocate spend to highest ROI channels; US CTV ad spend was about $19 billion in 2024, intensifying scrutiny. Curated PMPs can preserve premiums but need clean data and verification; identity/privacy shifts (cookieless, UID2, walled gardens) move leverage toward platforms that control deterministic audiences.
- Programmatic liquidity: ~86% of US display transactions (2024)
- US CTV spend: ~$19B (2024)
- PMPs: require verified first‑party data to sustain premiums
- Identity changes: leverage shifts to platform-controlled audiences
Audience fragmentation to alternatives
Audience fragmentation to streaming and social in 2024 shrinks broadcast effective reach, giving advertisers leverage to push CPMs lower as cross-platform switching rises; cross-screen frequency capping and outcome guarantees increase performance expectations while measurement currency choice remains a buyer lever, and bundled broadcast+network+digital packages can blunt that power.
- Streaming/social now ~35% of daily video time (2024)
- Cross-screen capping and guarantees raise ROI demands
- Bundles across channels reduce buyer leverage
- Measurement currency selection is a key buyer tool
Concentrated buyers and programmatic dominance squeeze CPMs; PMPs preserve premiums
Buyers concentrated via agencies and MVPDs exert strong price pressure; programmatic liquidity (≈86% display, 2024) and CTV allocation ($19B, 2024) raise leverage. Audience fragmentation (streaming/social ~35% daily, 2024) and pay-TV decline compress CPMs, while PMPs and bundles can preserve premiums.
| Metric | 2024 |
|---|---|
| Programmatic share | ~86% |
| US CTV spend | $19B |
| Streaming/social time | ~35% |
| Top3 MVPDs share | ~60% |
What You See Is What You Get
Scripps Porter's Five Forces Analysis
This preview shows the exact Scripps Porter’s Five Forces analysis you'll receive immediately after purchase—no surprises or placeholders. The document is fully formatted, professionally written, and ready for download and use the moment you buy. What you preview is the final, complete deliverable.
Original: $10.00
-65%$10.00
$3.50Description
Go Beyond the Preview—Access the Full Strategic Report
Scripps faces varied competitive pressures—from advertiser bargaining and digital substitutes to regional consolidation and content costs—shaping margins and growth outlook. This snapshot highlights key threats and leverage points for strategy and investment. Ready for deeper analysis? Unlock the full Porter's Five Forces report for force-by-force ratings, visuals, and actionable insights tailored to Scripps.
Suppliers Bargaining Power
Concentrated premium content owners
Major studios and leagues concentrate premium programming—Disney, Warner Bros. Discovery and Comcast control vast libraries while the NFL struck media deals exceeding $110 billion, boosting license fees and limiting substitution. Exclusive rights windows create take‑it‑or‑leave‑it leverage and multi‑year deals lock Scripps into rising costs and less flexibility. Scripps’ in‑house local news mitigates some exposure, but marquee sports and studio content retain pricing power.
Distribution tech and measurement vendors
Reliance on Nielsen and a small set of alternative currency providers plus ad-tech stacks concentrates bargaining power among a few suppliers, giving them outsized influence over pricing and audience valuation. Methodology shifts, such as Nielsen's ongoing currency updates in 2024, can materially change inventory valuation and CPMs. High switching costs, integration risk, and interoperability issues further raise supplier leverage, and recent vendor consolidation trends have pushed fees and data dependency higher.
Talent, unions, and production crews
On-air talent and unionized production crews exert clear supplier power through collective bargaining and scarcity; BLS 2024 median pay for broadcast reporters and anchors is roughly $55,000, while top-market anchors command six-figure salaries. Strikes and negotiations have demonstrable impact on costs and schedules, as seen industry-wide during 2023–24 labor actions. Local news pipelines reduce hiring risk but cannot offset premium pay for marquee talent. Contract cycles produce periodic cost spikes in staffing budgets.
Network affiliation and carriage partners
Affiliation agreements with major networks shape programming cost and inventory allocation; Scripps expanded carriage scale after the 2020 Ion Media acquisition. Networks can alter reverse compensation and content windows, directly squeezing local station margins. Loss or downgrade of an affiliation materially increases supplier leverage, and renewal windows (often clustered) create asymmetric negotiation pressure; 2023 retransmission payments to broadcasters were about $10 billion.
- Affiliation impact on programming cost
- Reverse comp & content-term pressure
- Affiliation loss raises supplier leverage
- Renewal windows create asymmetry
Cloud, CDN, and transmission equipment
Specialized broadcast gear and cloud/CDN suppliers exert moderate leverage over Scripps given limited alternatives and AWS/Azure/GCP commanding ~65% of cloud market in 2024. Capex intensity and multi-year maintenance contracts create vendor lock-in; 99.99% uptime SLAs and spectrum-efficiency needs constrain switching. Volume commitments can buy ~5–20% discounts but reduce flexibility.
- Market share: top-3 cloud ~65% (2024)
- Typical SLA: 99.99%
- Discounts from volume: ~5–20%
- Broadcast equipment market concentration increases lock-in
Suppliers wield leverage: media rights, cloud concentration and ad-tech drive cost pressure
Suppliers hold meaningful leverage: studios/leagues drive licensing (NFL deals >110 billion) and top‑3 cloud share ~65% in 2024, raising costs and lock‑in. Audience‑measurement shifts (Nielsen 2024 updates) and ad‑tech concentration increase pricing power; talent unions and affiliation renewals cause periodic cost spikes. Scripps' local news and scale mitigate but do not eliminate supplier power.
| Supplier | 2024 metric | Impact |
|---|---|---|
| Studios/Leagues | NFL deals >110B | High licensing power |
| Cloud | Top‑3 ~65% share | Lock‑in, ↑costs |
| Nielsen/ad‑tech | Currency updates 2024 | CPM volatility |
What is included in the product
Detailed Word Document
Concise Porter's Five Forces analysis for Scripps outlining competitive rivalry, buyer and supplier power, threats from new entrants and substitutes, and strategic implications for pricing, margins, and market positioning to inform investor and management decisions.
Customizable Excel Spreadsheet
Scripps Porter's Five Forces one-sheet instantly exposes competitive pain points and priority pressures so teams can act faster. Editable inputs and a clear radar visualization make it easy to tailor scenarios, export to decks, and align strategy without heavy analysis.
Customers Bargaining Power
Consolidated national advertisers
Agency holding companies aggregate client spend and demand favorable CPMs and make-goods, concentrating bargaining power across Scripps Porter’s inventory. They can reallocate budgets rapidly between linear TV, CTV and digital — CTV ad spend grew about 25% in 2023 — increasing leverage. Data-driven buying and programmatic transparency compress price spreads and raise pressure on rates. Upfront and out-of-home cycles, which often lock ~30% of annual TV budgets, further amplify negotiators’ clout.
Local advertisers’ price sensitivity
SMBs, which make up 99% of US firms, are intensely ROI-sensitive and press for measurable value and promotions, especially across economic cycles. Local station competition and low switching costs amplify buyer power as advertisers move to cheaper or digital options. Scripps’ audience-targeting and bundled inventory can sustain rates, but historical discounting during downturns shows elevated price pressure.
MVPDs and vMVPDs as fee payers
Distributors buying retransmission consent are regionally concentrated; the top three U.S. MVPDs (Comcast, Charter, Dish) control roughly 60% of multichannel subscribers, enabling aggressive pushback on fee hikes and risking blackouts. Their scale forces packaging demands and tie-ins across channels. Ongoing cord-cutting—pay-TV households down over 40% since 2010—shrinks the pie and strengthens buyer leverage on price.
Programmatic and CTV buyers
Automated auctions boost liquidity but compress margins as auction dynamics favor lowest clearing prices; in 2024 programmatic accounted for roughly 86% of US display transactions, increasing buyer leverage. Cross-channel performance comparisons push down CTV rates as buyers allocate spend to highest ROI channels; US CTV ad spend was about $19 billion in 2024, intensifying scrutiny. Curated PMPs can preserve premiums but need clean data and verification; identity/privacy shifts (cookieless, UID2, walled gardens) move leverage toward platforms that control deterministic audiences.
- Programmatic liquidity: ~86% of US display transactions (2024)
- US CTV spend: ~$19B (2024)
- PMPs: require verified first‑party data to sustain premiums
- Identity changes: leverage shifts to platform-controlled audiences
Audience fragmentation to alternatives
Audience fragmentation to streaming and social in 2024 shrinks broadcast effective reach, giving advertisers leverage to push CPMs lower as cross-platform switching rises; cross-screen frequency capping and outcome guarantees increase performance expectations while measurement currency choice remains a buyer lever, and bundled broadcast+network+digital packages can blunt that power.
- Streaming/social now ~35% of daily video time (2024)
- Cross-screen capping and guarantees raise ROI demands
- Bundles across channels reduce buyer leverage
- Measurement currency selection is a key buyer tool
Concentrated buyers and programmatic dominance squeeze CPMs; PMPs preserve premiums
Buyers concentrated via agencies and MVPDs exert strong price pressure; programmatic liquidity (≈86% display, 2024) and CTV allocation ($19B, 2024) raise leverage. Audience fragmentation (streaming/social ~35% daily, 2024) and pay-TV decline compress CPMs, while PMPs and bundles can preserve premiums.
| Metric | 2024 |
|---|---|
| Programmatic share | ~86% |
| US CTV spend | $19B |
| Streaming/social time | ~35% |
| Top3 MVPDs share | ~60% |
What You See Is What You Get
Scripps Porter's Five Forces Analysis
This preview shows the exact Scripps Porter’s Five Forces analysis you'll receive immediately after purchase—no surprises or placeholders. The document is fully formatted, professionally written, and ready for download and use the moment you buy. What you preview is the final, complete deliverable.











