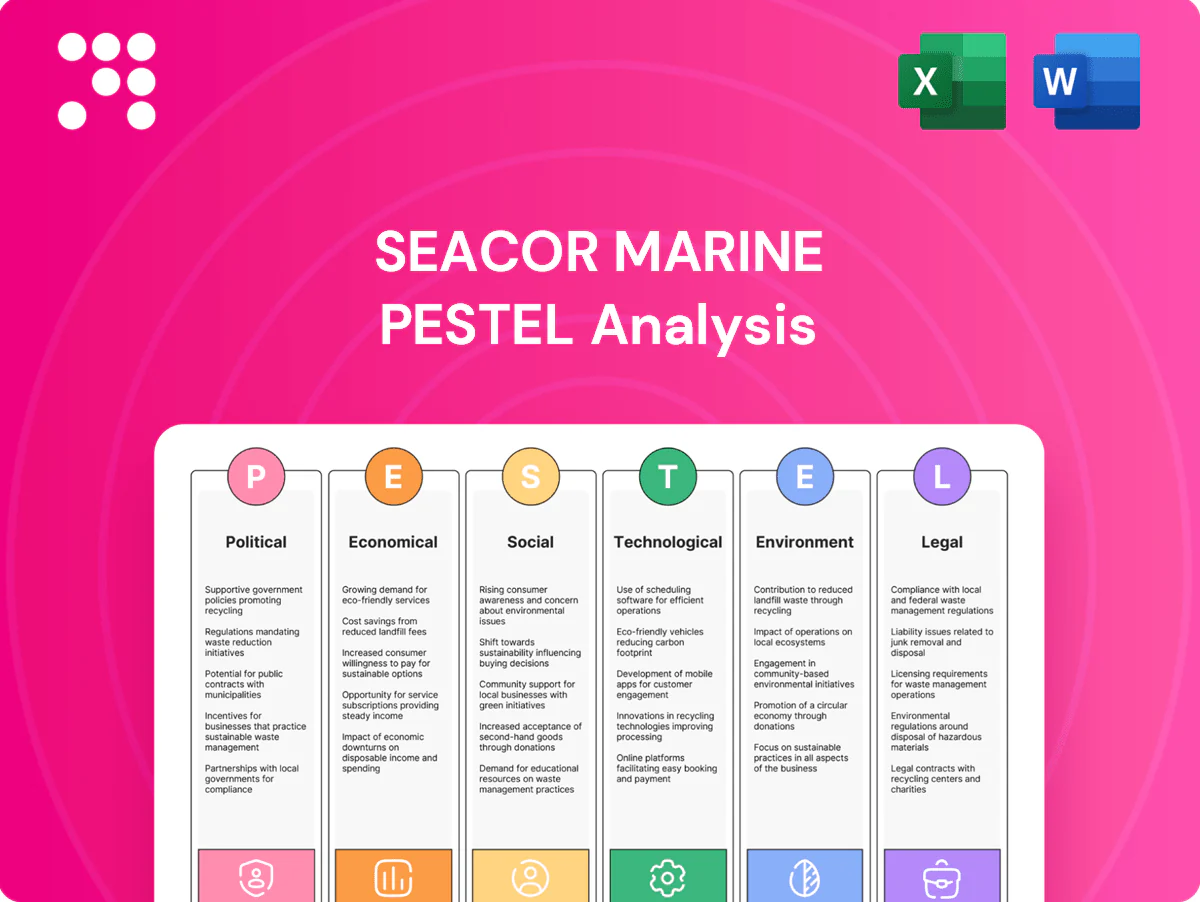
SEACOR Marine PESTLE Analysis

Skip the Research. Get the Strategy.
Unlock strategic clarity with our targeted PESTLE Analysis of SEACOR Marine—three to five concise insights into political, economic, social, technological, legal, and environmental forces shaping its outlook. Ideal for investors and strategists, this ready-to-use report saves time and highlights risks and opportunities—buy the full analysis for the complete, actionable breakdown.
Political factors

Offshore permitting and local content policies
National governments control seabed access, cabotage, and local content rules that shape vessel deployment and crew mix. As of 2024 over 60 countries enforce strict cabotage and local hiring, and tight local content can raise operating costs by 5–20% while deepening market access. SEACOR Marine must align flagging, partnerships, and hiring to comply. Policy shifts can reallocate capacity across regions within months.
Geopolitical stability in energy basins
SEACOR Marine operates in politically sensitive basins—Gulf of Mexico, West Africa, Middle East and North Sea—where sanctions and instability have disrupted contracts, insurance and port access (eg. post‑2022 sanctions waves). Rystad Energy estimated global offshore investment near $100bn in 2024, underscoring exposure. Diversification across basins limits single‑market concentration, and proactive security and contingency planning preserves vessel uptime and avoids industry downtime losses often measured in $1m+ per day.

Government support for offshore wind
Incentives, auctions and industrial strategies—notably the US Inflation Reduction Act and national targets such as the US 30 GW offshore goal by 2030 and the UK 50 GW by 2030—drive offshore wind build-out and give multi-year visibility for crew transfer and support vessels. Policy momentum supports fleet investment and long-term charters, while delays or reversals can defer utilization and depress day rates. Aligning with wind-focused ports and developers secures project pipeline and contract wins.

Public procurement and state-owned counterparties
State energy firms and public entities frequently charter offshore vessels, with public procurement representing roughly 12% of GDP in OECD countries (OECD), making sovereign demand material for SEACOR Marine. Payment terms and shifting political priorities can stretch cash flow and disrupt contract stability, so strong government relations and compliance frameworks are critical. Diversifying contracts reduces concentration risk and sovereign exposure.
- Public procurement ≈ 12% GDP (OECD)
- Payment terms: key cash-flow risk
- Government relations critical
- Contract diversification lowers sovereign exposure
Trade, tariffs, and fleet mobility
Maritime trade rules and tariffs shape SEACOR Marine's equipment sourcing and maintenance costs, with global seaborne trade at 12.6 billion tonnes in 2023 (UNCTAD) increasing demand for parts and spares. Visa regimes and crewing regulations affect rotation efficiency and schedule resilience. Harmonizing compliance across jurisdictions preserves schedule integrity while diplomatic shifts can open or constrain routes and markets.
- Tariffs and trade rules — affect sourcing and OPEX
- Visa/crewing regimes — impact rotation efficiency
- Regulatory harmonization — protects schedules
- Diplomacy — alters route and market access
Cabotage and sanctions hit offshore wind: USD100bn, 60+ countries
Governments' cabotage/local content rules (60+ countries) and sanctions materially affect deployment, costs (local content +5–20%) and insurance; political risk can reallocate capacity within months. Offshore investment ~USD100bn (2024) and wind targets (US 30GW, UK 50GW by 2030) drive demand; sovereign contracts and procurement (~12% GDP OECD) create cash‑flow risk.
| Metric | Value |
|---|---|
| Cabotage/local hiring | 60+ countries |
| Offshore investment | ~USD100bn (2024) |
| Wind targets | US 30GW, UK 50GW by 2030 |
| Procurement | ~12% GDP (OECD) |
What is included in the product
 Detailed Word Document
Explores how macro-environmental factors uniquely affect SEACOR Marine across Political, Economic, Social, Technological, Environmental and Legal dimensions, with data-backed insights, forward-looking scenario implications and sector-specific examples to support executives, investors and strategists in identifying risks, opportunities and actionable responses.

 Customizable Excel Spreadsheet
A concise, visually segmented PESTLE summary for SEACOR Marine that’s easily dropped into presentations, shared across teams, and editable for local context—ideal for quick alignment, risk discussions, and client reports.
Economic factors

Oil and gas cycle sensitivity
Offshore capex and day rates closely track commodity prices and operator budgets; with Brent averaging about $85/bbl in 2024, 2023–24 upcycles lifted utilization and pricing power across vessel sectors. Downcycles, by contrast, raise idle time and margin pressure. SEACOR Marine's flexible cost base and use of long-term charters smooth revenue volatility, while hedging and regional mix (Gulf of Mexico, West Africa, Asia) help buffer commodity shocks.
Offshore wind growth and diversification
Offshore wind growth provides a countercyclical revenue stream versus oil and gas, supported by the US federal target of 30 GW by 2030 and accelerating European build‑out trends. Specialized service vessels with certifications (e.g., WTIV, SOV) command dayrate premiums, improving margins for owners like SEACOR. Near‑term utilization can be strained by project pipeline slippage and permitting delays, but balanced exposure across sectors enhances revenue resilience.

Fuel costs and inflation
Bunker price volatility—with year-on-year swings exceeding 20% in 2024—directly inflates voyage costs and operating expenses while broader inflation (US CPI ~3.4% in 2024) erodes margins. Fuel adjustment clauses and index-linked contracts enable SEACOR Marine to pass most fuel cost increases to customers. Efficiency upgrades (single-digit to low-teens percent fuel/ton-mile gains) and centralized procurement plus hedging improve margin resilience.

Interest rates and capital intensity
Fleet renewal and retrofits require significant capex funded by debt and cash flow; with US policy rates near 5.25–5.50% in 2024–25 higher rates raise financing costs and can compress valuation multiples for asset-heavy owners like SEACOR Marine. Prudent leverage levels and staggered maturities preserve refinancing flexibility, while disciplined asset recycling (selling older tonnage) can unlock capital for growth and tech upgrades.
- capex funding: debt + cash flow
- rates: US policy 5.25–5.50% (2024–25)
- risk mitigation: prudent leverage, staggered maturities
- liquidity lever: asset recycling to fund renewal
Currency fluctuations
Currency fluctuations materially affect SEACOR Marine because revenue and costs occur across multiple currencies, so FX swings can distort reported results and alter competitive pricing in regional markets. Local operating expenses provide natural hedges that mitigate translation and economic exposure. The company uses selective hedging on multi-year charters to stabilize cash flows and reduce earnings volatility.
- Revenue/costs in multiple currencies
- Local expenses create natural hedge
- Selective hedging for multi-year charters
Cabotage and sanctions hit offshore wind: USD100bn, 60+ countries
Brent ~85/bbl in 2024 drove higher dayrates and utilization, but cyclicality raises idle time and margin risk. US policy rates ~5.25–5.50% (2024–25) and CAPEX for fleet renewal increase financing costs; disciplined leverage and asset recycling mitigate. Bunker volatility >20% in 2024 and US CPI ~3.4% push OPEX; fuel clauses, hedging and wind (US 30 GW by 2030) diversify revenue.
| Metric | Value |
|---|---|
| Brent 2024 | $85/bbl |
| US policy rate | 5.25–5.50% |
| Bunker vol. 2024 | >20% |
| US CPI 2024 | 3.4% |
Same Document Delivered
SEACOR Marine PESTLE Analysis
The SEACOR Marine PESTLE Analysis preview shown here is the exact, fully formatted document you’ll receive after purchase, ready to use. The layout, content, and structure visible are identical to the downloadable file—no placeholders or surprises. After checkout you’ll instantly get this same professional, finalized report.

Skip the Research. Get the Strategy.
Unlock strategic clarity with our targeted PESTLE Analysis of SEACOR Marine—three to five concise insights into political, economic, social, technological, legal, and environmental forces shaping its outlook. Ideal for investors and strategists, this ready-to-use report saves time and highlights risks and opportunities—buy the full analysis for the complete, actionable breakdown.
Political factors
Offshore permitting and local content policies
National governments control seabed access, cabotage, and local content rules that shape vessel deployment and crew mix. As of 2024 over 60 countries enforce strict cabotage and local hiring, and tight local content can raise operating costs by 5–20% while deepening market access. SEACOR Marine must align flagging, partnerships, and hiring to comply. Policy shifts can reallocate capacity across regions within months.
Geopolitical stability in energy basins
SEACOR Marine operates in politically sensitive basins—Gulf of Mexico, West Africa, Middle East and North Sea—where sanctions and instability have disrupted contracts, insurance and port access (eg. post‑2022 sanctions waves). Rystad Energy estimated global offshore investment near $100bn in 2024, underscoring exposure. Diversification across basins limits single‑market concentration, and proactive security and contingency planning preserves vessel uptime and avoids industry downtime losses often measured in $1m+ per day.
Government support for offshore wind
Incentives, auctions and industrial strategies—notably the US Inflation Reduction Act and national targets such as the US 30 GW offshore goal by 2030 and the UK 50 GW by 2030—drive offshore wind build-out and give multi-year visibility for crew transfer and support vessels. Policy momentum supports fleet investment and long-term charters, while delays or reversals can defer utilization and depress day rates. Aligning with wind-focused ports and developers secures project pipeline and contract wins.
Public procurement and state-owned counterparties
State energy firms and public entities frequently charter offshore vessels, with public procurement representing roughly 12% of GDP in OECD countries (OECD), making sovereign demand material for SEACOR Marine. Payment terms and shifting political priorities can stretch cash flow and disrupt contract stability, so strong government relations and compliance frameworks are critical. Diversifying contracts reduces concentration risk and sovereign exposure.
- Public procurement ≈ 12% GDP (OECD)
- Payment terms: key cash-flow risk
- Government relations critical
- Contract diversification lowers sovereign exposure
Trade, tariffs, and fleet mobility
Maritime trade rules and tariffs shape SEACOR Marine's equipment sourcing and maintenance costs, with global seaborne trade at 12.6 billion tonnes in 2023 (UNCTAD) increasing demand for parts and spares. Visa regimes and crewing regulations affect rotation efficiency and schedule resilience. Harmonizing compliance across jurisdictions preserves schedule integrity while diplomatic shifts can open or constrain routes and markets.
- Tariffs and trade rules — affect sourcing and OPEX
- Visa/crewing regimes — impact rotation efficiency
- Regulatory harmonization — protects schedules
- Diplomacy — alters route and market access
Cabotage and sanctions hit offshore wind: USD100bn, 60+ countries
Governments' cabotage/local content rules (60+ countries) and sanctions materially affect deployment, costs (local content +5–20%) and insurance; political risk can reallocate capacity within months. Offshore investment ~USD100bn (2024) and wind targets (US 30GW, UK 50GW by 2030) drive demand; sovereign contracts and procurement (~12% GDP OECD) create cash‑flow risk.
| Metric | Value |
|---|---|
| Cabotage/local hiring | 60+ countries |
| Offshore investment | ~USD100bn (2024) |
| Wind targets | US 30GW, UK 50GW by 2030 |
| Procurement | ~12% GDP (OECD) |
What is included in the product
Detailed Word Document
Explores how macro-environmental factors uniquely affect SEACOR Marine across Political, Economic, Social, Technological, Environmental and Legal dimensions, with data-backed insights, forward-looking scenario implications and sector-specific examples to support executives, investors and strategists in identifying risks, opportunities and actionable responses.
Customizable Excel Spreadsheet
A concise, visually segmented PESTLE summary for SEACOR Marine that’s easily dropped into presentations, shared across teams, and editable for local context—ideal for quick alignment, risk discussions, and client reports.
Economic factors
Oil and gas cycle sensitivity
Offshore capex and day rates closely track commodity prices and operator budgets; with Brent averaging about $85/bbl in 2024, 2023–24 upcycles lifted utilization and pricing power across vessel sectors. Downcycles, by contrast, raise idle time and margin pressure. SEACOR Marine's flexible cost base and use of long-term charters smooth revenue volatility, while hedging and regional mix (Gulf of Mexico, West Africa, Asia) help buffer commodity shocks.
Offshore wind growth and diversification
Offshore wind growth provides a countercyclical revenue stream versus oil and gas, supported by the US federal target of 30 GW by 2030 and accelerating European build‑out trends. Specialized service vessels with certifications (e.g., WTIV, SOV) command dayrate premiums, improving margins for owners like SEACOR. Near‑term utilization can be strained by project pipeline slippage and permitting delays, but balanced exposure across sectors enhances revenue resilience.
Fuel costs and inflation
Bunker price volatility—with year-on-year swings exceeding 20% in 2024—directly inflates voyage costs and operating expenses while broader inflation (US CPI ~3.4% in 2024) erodes margins. Fuel adjustment clauses and index-linked contracts enable SEACOR Marine to pass most fuel cost increases to customers. Efficiency upgrades (single-digit to low-teens percent fuel/ton-mile gains) and centralized procurement plus hedging improve margin resilience.
Interest rates and capital intensity
Fleet renewal and retrofits require significant capex funded by debt and cash flow; with US policy rates near 5.25–5.50% in 2024–25 higher rates raise financing costs and can compress valuation multiples for asset-heavy owners like SEACOR Marine. Prudent leverage levels and staggered maturities preserve refinancing flexibility, while disciplined asset recycling (selling older tonnage) can unlock capital for growth and tech upgrades.
- capex funding: debt + cash flow
- rates: US policy 5.25–5.50% (2024–25)
- risk mitigation: prudent leverage, staggered maturities
- liquidity lever: asset recycling to fund renewal
Currency fluctuations
Currency fluctuations materially affect SEACOR Marine because revenue and costs occur across multiple currencies, so FX swings can distort reported results and alter competitive pricing in regional markets. Local operating expenses provide natural hedges that mitigate translation and economic exposure. The company uses selective hedging on multi-year charters to stabilize cash flows and reduce earnings volatility.
- Revenue/costs in multiple currencies
- Local expenses create natural hedge
- Selective hedging for multi-year charters
Cabotage and sanctions hit offshore wind: USD100bn, 60+ countries
Brent ~85/bbl in 2024 drove higher dayrates and utilization, but cyclicality raises idle time and margin risk. US policy rates ~5.25–5.50% (2024–25) and CAPEX for fleet renewal increase financing costs; disciplined leverage and asset recycling mitigate. Bunker volatility >20% in 2024 and US CPI ~3.4% push OPEX; fuel clauses, hedging and wind (US 30 GW by 2030) diversify revenue.
| Metric | Value |
|---|---|
| Brent 2024 | $85/bbl |
| US policy rate | 5.25–5.50% |
| Bunker vol. 2024 | >20% |
| US CPI 2024 | 3.4% |
Same Document Delivered
SEACOR Marine PESTLE Analysis
The SEACOR Marine PESTLE Analysis preview shown here is the exact, fully formatted document you’ll receive after purchase, ready to use. The layout, content, and structure visible are identical to the downloadable file—no placeholders or surprises. After checkout you’ll instantly get this same professional, finalized report.
Original: $10.00
-65%$10.00
$3.50Description
Skip the Research. Get the Strategy.
Unlock strategic clarity with our targeted PESTLE Analysis of SEACOR Marine—three to five concise insights into political, economic, social, technological, legal, and environmental forces shaping its outlook. Ideal for investors and strategists, this ready-to-use report saves time and highlights risks and opportunities—buy the full analysis for the complete, actionable breakdown.
Political factors
Offshore permitting and local content policies
National governments control seabed access, cabotage, and local content rules that shape vessel deployment and crew mix. As of 2024 over 60 countries enforce strict cabotage and local hiring, and tight local content can raise operating costs by 5–20% while deepening market access. SEACOR Marine must align flagging, partnerships, and hiring to comply. Policy shifts can reallocate capacity across regions within months.
Geopolitical stability in energy basins
SEACOR Marine operates in politically sensitive basins—Gulf of Mexico, West Africa, Middle East and North Sea—where sanctions and instability have disrupted contracts, insurance and port access (eg. post‑2022 sanctions waves). Rystad Energy estimated global offshore investment near $100bn in 2024, underscoring exposure. Diversification across basins limits single‑market concentration, and proactive security and contingency planning preserves vessel uptime and avoids industry downtime losses often measured in $1m+ per day.
Government support for offshore wind
Incentives, auctions and industrial strategies—notably the US Inflation Reduction Act and national targets such as the US 30 GW offshore goal by 2030 and the UK 50 GW by 2030—drive offshore wind build-out and give multi-year visibility for crew transfer and support vessels. Policy momentum supports fleet investment and long-term charters, while delays or reversals can defer utilization and depress day rates. Aligning with wind-focused ports and developers secures project pipeline and contract wins.
Public procurement and state-owned counterparties
State energy firms and public entities frequently charter offshore vessels, with public procurement representing roughly 12% of GDP in OECD countries (OECD), making sovereign demand material for SEACOR Marine. Payment terms and shifting political priorities can stretch cash flow and disrupt contract stability, so strong government relations and compliance frameworks are critical. Diversifying contracts reduces concentration risk and sovereign exposure.
- Public procurement ≈ 12% GDP (OECD)
- Payment terms: key cash-flow risk
- Government relations critical
- Contract diversification lowers sovereign exposure
Trade, tariffs, and fleet mobility
Maritime trade rules and tariffs shape SEACOR Marine's equipment sourcing and maintenance costs, with global seaborne trade at 12.6 billion tonnes in 2023 (UNCTAD) increasing demand for parts and spares. Visa regimes and crewing regulations affect rotation efficiency and schedule resilience. Harmonizing compliance across jurisdictions preserves schedule integrity while diplomatic shifts can open or constrain routes and markets.
- Tariffs and trade rules — affect sourcing and OPEX
- Visa/crewing regimes — impact rotation efficiency
- Regulatory harmonization — protects schedules
- Diplomacy — alters route and market access
Cabotage and sanctions hit offshore wind: USD100bn, 60+ countries
Governments' cabotage/local content rules (60+ countries) and sanctions materially affect deployment, costs (local content +5–20%) and insurance; political risk can reallocate capacity within months. Offshore investment ~USD100bn (2024) and wind targets (US 30GW, UK 50GW by 2030) drive demand; sovereign contracts and procurement (~12% GDP OECD) create cash‑flow risk.
| Metric | Value |
|---|---|
| Cabotage/local hiring | 60+ countries |
| Offshore investment | ~USD100bn (2024) |
| Wind targets | US 30GW, UK 50GW by 2030 |
| Procurement | ~12% GDP (OECD) |
What is included in the product
Detailed Word Document
Explores how macro-environmental factors uniquely affect SEACOR Marine across Political, Economic, Social, Technological, Environmental and Legal dimensions, with data-backed insights, forward-looking scenario implications and sector-specific examples to support executives, investors and strategists in identifying risks, opportunities and actionable responses.
Customizable Excel Spreadsheet
A concise, visually segmented PESTLE summary for SEACOR Marine that’s easily dropped into presentations, shared across teams, and editable for local context—ideal for quick alignment, risk discussions, and client reports.
Economic factors
Oil and gas cycle sensitivity
Offshore capex and day rates closely track commodity prices and operator budgets; with Brent averaging about $85/bbl in 2024, 2023–24 upcycles lifted utilization and pricing power across vessel sectors. Downcycles, by contrast, raise idle time and margin pressure. SEACOR Marine's flexible cost base and use of long-term charters smooth revenue volatility, while hedging and regional mix (Gulf of Mexico, West Africa, Asia) help buffer commodity shocks.
Offshore wind growth and diversification
Offshore wind growth provides a countercyclical revenue stream versus oil and gas, supported by the US federal target of 30 GW by 2030 and accelerating European build‑out trends. Specialized service vessels with certifications (e.g., WTIV, SOV) command dayrate premiums, improving margins for owners like SEACOR. Near‑term utilization can be strained by project pipeline slippage and permitting delays, but balanced exposure across sectors enhances revenue resilience.
Fuel costs and inflation
Bunker price volatility—with year-on-year swings exceeding 20% in 2024—directly inflates voyage costs and operating expenses while broader inflation (US CPI ~3.4% in 2024) erodes margins. Fuel adjustment clauses and index-linked contracts enable SEACOR Marine to pass most fuel cost increases to customers. Efficiency upgrades (single-digit to low-teens percent fuel/ton-mile gains) and centralized procurement plus hedging improve margin resilience.
Interest rates and capital intensity
Fleet renewal and retrofits require significant capex funded by debt and cash flow; with US policy rates near 5.25–5.50% in 2024–25 higher rates raise financing costs and can compress valuation multiples for asset-heavy owners like SEACOR Marine. Prudent leverage levels and staggered maturities preserve refinancing flexibility, while disciplined asset recycling (selling older tonnage) can unlock capital for growth and tech upgrades.
- capex funding: debt + cash flow
- rates: US policy 5.25–5.50% (2024–25)
- risk mitigation: prudent leverage, staggered maturities
- liquidity lever: asset recycling to fund renewal
Currency fluctuations
Currency fluctuations materially affect SEACOR Marine because revenue and costs occur across multiple currencies, so FX swings can distort reported results and alter competitive pricing in regional markets. Local operating expenses provide natural hedges that mitigate translation and economic exposure. The company uses selective hedging on multi-year charters to stabilize cash flows and reduce earnings volatility.
- Revenue/costs in multiple currencies
- Local expenses create natural hedge
- Selective hedging for multi-year charters
Cabotage and sanctions hit offshore wind: USD100bn, 60+ countries
Brent ~85/bbl in 2024 drove higher dayrates and utilization, but cyclicality raises idle time and margin risk. US policy rates ~5.25–5.50% (2024–25) and CAPEX for fleet renewal increase financing costs; disciplined leverage and asset recycling mitigate. Bunker volatility >20% in 2024 and US CPI ~3.4% push OPEX; fuel clauses, hedging and wind (US 30 GW by 2030) diversify revenue.
| Metric | Value |
|---|---|
| Brent 2024 | $85/bbl |
| US policy rate | 5.25–5.50% |
| Bunker vol. 2024 | >20% |
| US CPI 2024 | 3.4% |
Same Document Delivered
SEACOR Marine PESTLE Analysis
The SEACOR Marine PESTLE Analysis preview shown here is the exact, fully formatted document you’ll receive after purchase, ready to use. The layout, content, and structure visible are identical to the downloadable file—no placeholders or surprises. After checkout you’ll instantly get this same professional, finalized report.











