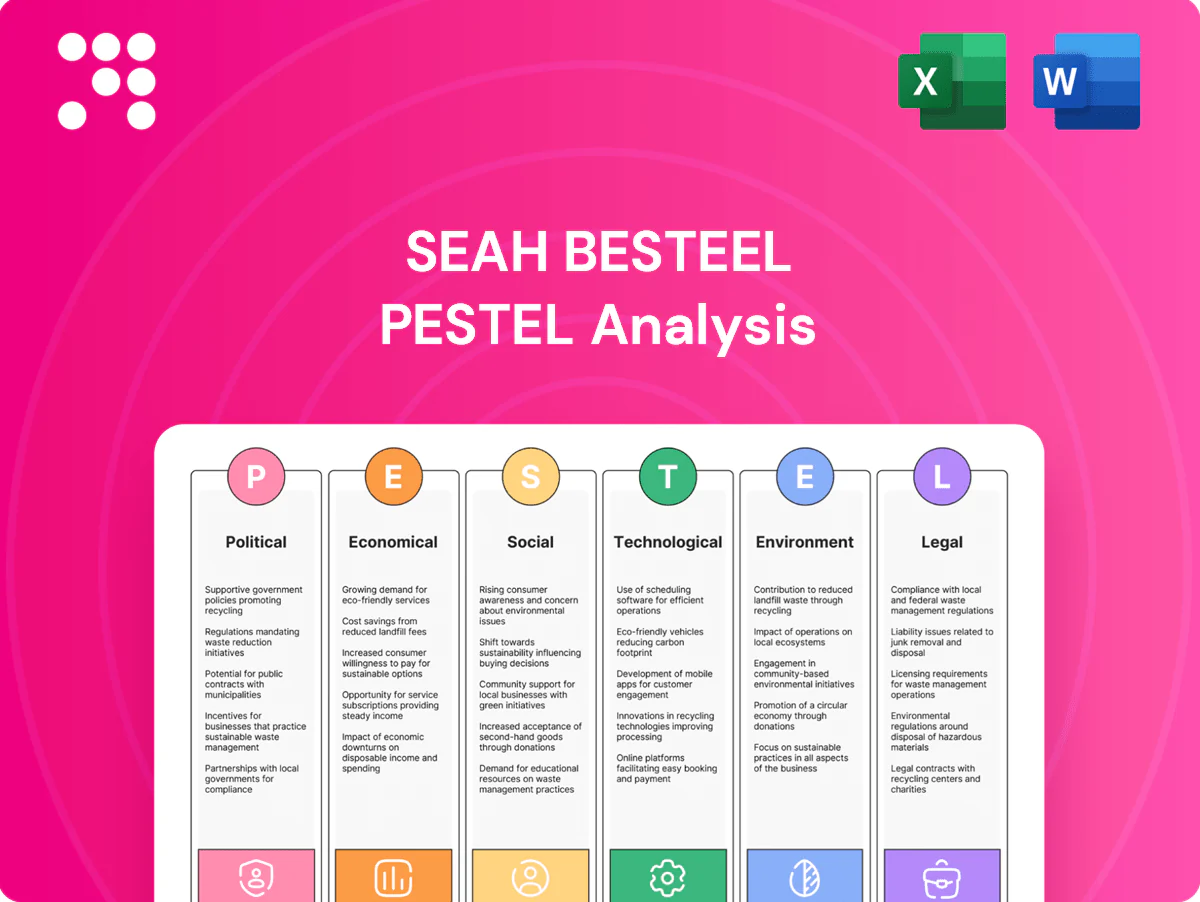
SeAH Besteel PESTLE Analysis

Plan Smarter. Present Sharper. Compete Stronger.
Gain strategic clarity with our PESTLE analysis of SeAH Besteel—three decades of external trends distilled into actionable insights. Understand regulatory, economic, and environmental forces shaping its steel operations. Buy the full report for the complete, editable breakdown and immediate download.
Political factors

Trade policy volatility
Trade policy volatility hits export-driven special steel through tariffs, quotas and shifting bilateral deals. Korea’s FTA network, covering roughly 70% of its trade, improves access, but the US 25% Section 232 steel tariff (since 2018) and recurring EU/US anti-dumping probes keep risks high. SeAH Besteel must diversify markets, tailor product specs to avoid remedies, and strengthen compliance documentation and proactive lobbying.
Geopolitical tensions
Geopolitical tensions—North Korea provocations and Sino–U.S. rivalry—threaten SeAH Besteel supply chains, given South Korea's reliance on maritime trade and that nearly all crude oil and LNG imports arrive by sea. Maritime-route risks can disrupt energy and raw-material flows; Korean shipyards hold about 40% of the global orderbook so customers may defer capex on escalation. Scenario planning and multi-sourcing reduce exposure.

Industrial policy support
Korean industrial policies unlock grants and tax incentives for advanced materials and high-value manufacturing, supporting SeAH Besteel’s capex and margin programs. Alignment with national strategies for EVs, defense and shipbuilding sustains order visibility, reinforced by South Korea’s 2024 defense budget of about 63 trillion won. Participation in public–private R&D consortia increases access to collaborative funding and tech transfers. Strict policy adherence ensures continued eligibility for these programs.

Energy security policy
Government moves on LNG, nuclear restarts and renewables shape industrial power prices for EAF and rolling; South Korea imported about 45 million tonnes of LNG in 2023, pressuring spot-linked costs for 2024–25. Stable baseload policy from nuclear/coal restarts improves cost predictability for steelmakers, while subsidies and tax credits for efficiency upgrades lower energy intensity and capex payback. Proactive engagement with regulators can influence tariff structures and demand-charge design to protect margins.
- LNG imports ~45 Mt (2023) — affects fuel-linked tariffs
- Baseload stability — reduces price volatility risk
- Incentives for efficiency — lowers kWh/ton and OPEX
- Regulatory engagement — shape demand charges and time-of-use tariffs
Global sanctions/export controls
Global sanctions and export controls—now enforced across 50+ jurisdictions—restrict certain alloys, dual-use items and sales to sanctioned regions, directly curbing some orders for SeAH Besteel. Robust compliance systems must screen customers and end-use; missteps risk fines (OFAC/EEA enforcement surged in 2024) and reputational harm. Clear documentation and regular audits preserve supply continuity and bank access.
- 50+ jurisdictions with export controls
- Targets: specific alloys, dual-use items
- 2024 enforcement spike — higher fine risk
- Mitigation: screening, documentation, audits
Korea trade risk: 25% US tariff, ~70% FTA exposure, LNG & defense shocks
Export controls, US 25% Section 232 tariff and Korea’s FTA network (~70% trade) raise market-access and compliance costs; 50+ jurisdictions now enforce controls with 2024 enforcement spikes. Geopolitical risks (N.Korea, US–China rivalry) threaten maritime supply chains; Korea imported ~45 Mt LNG (2023). Industrial/defense incentives (2024 budget ~63trn won) and energy policy shape capex and power costs.
| Item | Metric | Impact |
|---|---|---|
| FTA coverage | ~70% trade | Market access |
| Section 232 | 25% tariff | Price/volume risk |
| LNG imports | ~45 Mt (2023) | Fuel-cost pressure |
| Defense budget | ~63 trn won (2024) | Order visibility |
What is included in the product
 Detailed Word Document
Explores how macro-environmental forces uniquely impact SeAH Besteel across Political, Economic, Social, Technological, Environmental, and Legal dimensions, with data-driven subpoints and sector-specific examples. Designed for executives and investors to identify risks, opportunities and inform strategic, scenario-based planning.

 Customizable Excel Spreadsheet
Clean, summarized PESTLE insights for SeAH Besteel, visually segmented by category and editable for region- or business-specific notes—ideal for dropping into presentations, sharing across teams, and guiding risk and market-position discussions during planning sessions.
Economic factors

Cyclical end-market demand
Automotive, machinery and shipbuilding cycles drive SeAH Besteel special steel volumes, with auto OEM production recovery boosting demand after 2023 lows. The EV transition—global EV new-car share roughly 18% in 2024—shifts grade mix toward advanced high-strength and corrosion-resistant alloys. Longer-term contracts with OEMs have improved order visibility and pricing. Flexible mill scheduling allows rapid output shifts to manage cycle swings.
Raw material price swings
Volatility in scrap (regional swings ~15–30% in 2024), ferroalloys and critical inputs like nickel (LME nickel rose ~35% y/y in 2024) and molybdenum (price swings ~20–40% across 2024–H1 2025) materially compress SeAH Besteel margins.
Index-linked surcharges in long-term contracts have enabled partial pass-through, covering a significant share of short-term spikes.
Strategic inventory buffers and supplier hedging reduced spot exposure during 2024 peaks, while data-driven procurement—using weekly price models and forward curve analytics—improved buy timing and lowered purchase volatility.

Exchange rate exposure
KRW volatility (USD/KRW ~1,350 in July 2025) directly alters SeAH Besteel export competitiveness and costs for imported inputs; dollar-denominated sales and dollar-priced raw materials provide natural hedges against FX swings. The group employs financial hedges (forwards/swaps) to smooth reported earnings and limit P&L volatility. Contractual pricing clauses with customers and suppliers further reduce transactional FX risk.

Cost of capital and capex
Higher interest rates (Bank of Korea policy rate 3.50% as of mid‑2025) raise funding costs for furnace, heat‑treatment and sustainability capex, making ROI‑positive debottlenecking essential to protect cash flow. Prioritizing projects with payback under 3–5 years preserves liquidity while phased investments match volatile steel demand. Accessing green financing can lower WACC by roughly 0.25–0.75 percentage points for decarbonization projects.
- Focus: ROI‑positive debottlenecking
- Rate context: BOK 3.50% (mid‑2025)
- Green finance: WACC reduction ~25–75 bps
- Strategy: phased capex aligned to demand outlook
Global special steel competition
- price/quality pressure: Japan, EU, China
- 53% China share (2023)
- differentiation: purity, consistency, certifications
- defense: niche grades, service speed
- repeat business: customer intimacy
Korea trade risk: 25% US tariff, ~70% FTA exposure, LNG & defense shocks
Automotive/shipbuilding cycles drive volumes; global EV new‑car share ~18% in 2024 shifts mix to high‑strength alloys. Input volatility (scrap 15–30% in 2024; LME nickel +35% y/y 2024) and FX (USD/KRW ~1,350 July 2025) compress margins. BOK rate 3.50% (mid‑2025) raises capex cost; index surcharges, hedges and green finance (WACC −25–75 bps) mitigate risk.
| Metric | Value | Impact |
|---|---|---|
| EV share (2024) | 18% | Grade mix shift |
| Scrap volatility (2024) | 15–30% | Margin pressure |
| Ni (LME) y/y 2024 | +35% | Input cost |
| USD/KRW | ~1,350 (Jul 2025) | Competitiveness |
| BOK rate | 3.50% (mid‑2025) | Capex cost |
| Green finance | −25–75 bps WACC | Cost reduction |
Same Document Delivered
SeAH Besteel PESTLE Analysis
The preview shown here is the exact SeAH Besteel PESTLE Analysis you’ll receive after purchase—fully formatted and ready to use. The content, structure, and visual layout are identical to the downloadable file, with no placeholders or teasers. After checkout you’ll instantly get this complete, professionally structured document.

Plan Smarter. Present Sharper. Compete Stronger.
Gain strategic clarity with our PESTLE analysis of SeAH Besteel—three decades of external trends distilled into actionable insights. Understand regulatory, economic, and environmental forces shaping its steel operations. Buy the full report for the complete, editable breakdown and immediate download.
Political factors
Trade policy volatility
Trade policy volatility hits export-driven special steel through tariffs, quotas and shifting bilateral deals. Korea’s FTA network, covering roughly 70% of its trade, improves access, but the US 25% Section 232 steel tariff (since 2018) and recurring EU/US anti-dumping probes keep risks high. SeAH Besteel must diversify markets, tailor product specs to avoid remedies, and strengthen compliance documentation and proactive lobbying.
Geopolitical tensions
Geopolitical tensions—North Korea provocations and Sino–U.S. rivalry—threaten SeAH Besteel supply chains, given South Korea's reliance on maritime trade and that nearly all crude oil and LNG imports arrive by sea. Maritime-route risks can disrupt energy and raw-material flows; Korean shipyards hold about 40% of the global orderbook so customers may defer capex on escalation. Scenario planning and multi-sourcing reduce exposure.
Industrial policy support
Korean industrial policies unlock grants and tax incentives for advanced materials and high-value manufacturing, supporting SeAH Besteel’s capex and margin programs. Alignment with national strategies for EVs, defense and shipbuilding sustains order visibility, reinforced by South Korea’s 2024 defense budget of about 63 trillion won. Participation in public–private R&D consortia increases access to collaborative funding and tech transfers. Strict policy adherence ensures continued eligibility for these programs.
Energy security policy
Government moves on LNG, nuclear restarts and renewables shape industrial power prices for EAF and rolling; South Korea imported about 45 million tonnes of LNG in 2023, pressuring spot-linked costs for 2024–25. Stable baseload policy from nuclear/coal restarts improves cost predictability for steelmakers, while subsidies and tax credits for efficiency upgrades lower energy intensity and capex payback. Proactive engagement with regulators can influence tariff structures and demand-charge design to protect margins.
- LNG imports ~45 Mt (2023) — affects fuel-linked tariffs
- Baseload stability — reduces price volatility risk
- Incentives for efficiency — lowers kWh/ton and OPEX
- Regulatory engagement — shape demand charges and time-of-use tariffs
Global sanctions/export controls
Global sanctions and export controls—now enforced across 50+ jurisdictions—restrict certain alloys, dual-use items and sales to sanctioned regions, directly curbing some orders for SeAH Besteel. Robust compliance systems must screen customers and end-use; missteps risk fines (OFAC/EEA enforcement surged in 2024) and reputational harm. Clear documentation and regular audits preserve supply continuity and bank access.
- 50+ jurisdictions with export controls
- Targets: specific alloys, dual-use items
- 2024 enforcement spike — higher fine risk
- Mitigation: screening, documentation, audits
Korea trade risk: 25% US tariff, ~70% FTA exposure, LNG & defense shocks
Export controls, US 25% Section 232 tariff and Korea’s FTA network (~70% trade) raise market-access and compliance costs; 50+ jurisdictions now enforce controls with 2024 enforcement spikes. Geopolitical risks (N.Korea, US–China rivalry) threaten maritime supply chains; Korea imported ~45 Mt LNG (2023). Industrial/defense incentives (2024 budget ~63trn won) and energy policy shape capex and power costs.
| Item | Metric | Impact |
|---|---|---|
| FTA coverage | ~70% trade | Market access |
| Section 232 | 25% tariff | Price/volume risk |
| LNG imports | ~45 Mt (2023) | Fuel-cost pressure |
| Defense budget | ~63 trn won (2024) | Order visibility |
What is included in the product
Detailed Word Document
Explores how macro-environmental forces uniquely impact SeAH Besteel across Political, Economic, Social, Technological, Environmental, and Legal dimensions, with data-driven subpoints and sector-specific examples. Designed for executives and investors to identify risks, opportunities and inform strategic, scenario-based planning.
Customizable Excel Spreadsheet
Clean, summarized PESTLE insights for SeAH Besteel, visually segmented by category and editable for region- or business-specific notes—ideal for dropping into presentations, sharing across teams, and guiding risk and market-position discussions during planning sessions.
Economic factors
Cyclical end-market demand
Automotive, machinery and shipbuilding cycles drive SeAH Besteel special steel volumes, with auto OEM production recovery boosting demand after 2023 lows. The EV transition—global EV new-car share roughly 18% in 2024—shifts grade mix toward advanced high-strength and corrosion-resistant alloys. Longer-term contracts with OEMs have improved order visibility and pricing. Flexible mill scheduling allows rapid output shifts to manage cycle swings.
Raw material price swings
Volatility in scrap (regional swings ~15–30% in 2024), ferroalloys and critical inputs like nickel (LME nickel rose ~35% y/y in 2024) and molybdenum (price swings ~20–40% across 2024–H1 2025) materially compress SeAH Besteel margins.
Index-linked surcharges in long-term contracts have enabled partial pass-through, covering a significant share of short-term spikes.
Strategic inventory buffers and supplier hedging reduced spot exposure during 2024 peaks, while data-driven procurement—using weekly price models and forward curve analytics—improved buy timing and lowered purchase volatility.
Exchange rate exposure
KRW volatility (USD/KRW ~1,350 in July 2025) directly alters SeAH Besteel export competitiveness and costs for imported inputs; dollar-denominated sales and dollar-priced raw materials provide natural hedges against FX swings. The group employs financial hedges (forwards/swaps) to smooth reported earnings and limit P&L volatility. Contractual pricing clauses with customers and suppliers further reduce transactional FX risk.
Cost of capital and capex
Higher interest rates (Bank of Korea policy rate 3.50% as of mid‑2025) raise funding costs for furnace, heat‑treatment and sustainability capex, making ROI‑positive debottlenecking essential to protect cash flow. Prioritizing projects with payback under 3–5 years preserves liquidity while phased investments match volatile steel demand. Accessing green financing can lower WACC by roughly 0.25–0.75 percentage points for decarbonization projects.
- Focus: ROI‑positive debottlenecking
- Rate context: BOK 3.50% (mid‑2025)
- Green finance: WACC reduction ~25–75 bps
- Strategy: phased capex aligned to demand outlook
Global special steel competition
- price/quality pressure: Japan, EU, China
- 53% China share (2023)
- differentiation: purity, consistency, certifications
- defense: niche grades, service speed
- repeat business: customer intimacy
Korea trade risk: 25% US tariff, ~70% FTA exposure, LNG & defense shocks
Automotive/shipbuilding cycles drive volumes; global EV new‑car share ~18% in 2024 shifts mix to high‑strength alloys. Input volatility (scrap 15–30% in 2024; LME nickel +35% y/y 2024) and FX (USD/KRW ~1,350 July 2025) compress margins. BOK rate 3.50% (mid‑2025) raises capex cost; index surcharges, hedges and green finance (WACC −25–75 bps) mitigate risk.
| Metric | Value | Impact |
|---|---|---|
| EV share (2024) | 18% | Grade mix shift |
| Scrap volatility (2024) | 15–30% | Margin pressure |
| Ni (LME) y/y 2024 | +35% | Input cost |
| USD/KRW | ~1,350 (Jul 2025) | Competitiveness |
| BOK rate | 3.50% (mid‑2025) | Capex cost |
| Green finance | −25–75 bps WACC | Cost reduction |
Same Document Delivered
SeAH Besteel PESTLE Analysis
The preview shown here is the exact SeAH Besteel PESTLE Analysis you’ll receive after purchase—fully formatted and ready to use. The content, structure, and visual layout are identical to the downloadable file, with no placeholders or teasers. After checkout you’ll instantly get this complete, professionally structured document.
Original: $10.00
-65%$10.00
$3.50Description
Plan Smarter. Present Sharper. Compete Stronger.
Gain strategic clarity with our PESTLE analysis of SeAH Besteel—three decades of external trends distilled into actionable insights. Understand regulatory, economic, and environmental forces shaping its steel operations. Buy the full report for the complete, editable breakdown and immediate download.
Political factors
Trade policy volatility
Trade policy volatility hits export-driven special steel through tariffs, quotas and shifting bilateral deals. Korea’s FTA network, covering roughly 70% of its trade, improves access, but the US 25% Section 232 steel tariff (since 2018) and recurring EU/US anti-dumping probes keep risks high. SeAH Besteel must diversify markets, tailor product specs to avoid remedies, and strengthen compliance documentation and proactive lobbying.
Geopolitical tensions
Geopolitical tensions—North Korea provocations and Sino–U.S. rivalry—threaten SeAH Besteel supply chains, given South Korea's reliance on maritime trade and that nearly all crude oil and LNG imports arrive by sea. Maritime-route risks can disrupt energy and raw-material flows; Korean shipyards hold about 40% of the global orderbook so customers may defer capex on escalation. Scenario planning and multi-sourcing reduce exposure.
Industrial policy support
Korean industrial policies unlock grants and tax incentives for advanced materials and high-value manufacturing, supporting SeAH Besteel’s capex and margin programs. Alignment with national strategies for EVs, defense and shipbuilding sustains order visibility, reinforced by South Korea’s 2024 defense budget of about 63 trillion won. Participation in public–private R&D consortia increases access to collaborative funding and tech transfers. Strict policy adherence ensures continued eligibility for these programs.
Energy security policy
Government moves on LNG, nuclear restarts and renewables shape industrial power prices for EAF and rolling; South Korea imported about 45 million tonnes of LNG in 2023, pressuring spot-linked costs for 2024–25. Stable baseload policy from nuclear/coal restarts improves cost predictability for steelmakers, while subsidies and tax credits for efficiency upgrades lower energy intensity and capex payback. Proactive engagement with regulators can influence tariff structures and demand-charge design to protect margins.
- LNG imports ~45 Mt (2023) — affects fuel-linked tariffs
- Baseload stability — reduces price volatility risk
- Incentives for efficiency — lowers kWh/ton and OPEX
- Regulatory engagement — shape demand charges and time-of-use tariffs
Global sanctions/export controls
Global sanctions and export controls—now enforced across 50+ jurisdictions—restrict certain alloys, dual-use items and sales to sanctioned regions, directly curbing some orders for SeAH Besteel. Robust compliance systems must screen customers and end-use; missteps risk fines (OFAC/EEA enforcement surged in 2024) and reputational harm. Clear documentation and regular audits preserve supply continuity and bank access.
- 50+ jurisdictions with export controls
- Targets: specific alloys, dual-use items
- 2024 enforcement spike — higher fine risk
- Mitigation: screening, documentation, audits
Korea trade risk: 25% US tariff, ~70% FTA exposure, LNG & defense shocks
Export controls, US 25% Section 232 tariff and Korea’s FTA network (~70% trade) raise market-access and compliance costs; 50+ jurisdictions now enforce controls with 2024 enforcement spikes. Geopolitical risks (N.Korea, US–China rivalry) threaten maritime supply chains; Korea imported ~45 Mt LNG (2023). Industrial/defense incentives (2024 budget ~63trn won) and energy policy shape capex and power costs.
| Item | Metric | Impact |
|---|---|---|
| FTA coverage | ~70% trade | Market access |
| Section 232 | 25% tariff | Price/volume risk |
| LNG imports | ~45 Mt (2023) | Fuel-cost pressure |
| Defense budget | ~63 trn won (2024) | Order visibility |
What is included in the product
Detailed Word Document
Explores how macro-environmental forces uniquely impact SeAH Besteel across Political, Economic, Social, Technological, Environmental, and Legal dimensions, with data-driven subpoints and sector-specific examples. Designed for executives and investors to identify risks, opportunities and inform strategic, scenario-based planning.
Customizable Excel Spreadsheet
Clean, summarized PESTLE insights for SeAH Besteel, visually segmented by category and editable for region- or business-specific notes—ideal for dropping into presentations, sharing across teams, and guiding risk and market-position discussions during planning sessions.
Economic factors
Cyclical end-market demand
Automotive, machinery and shipbuilding cycles drive SeAH Besteel special steel volumes, with auto OEM production recovery boosting demand after 2023 lows. The EV transition—global EV new-car share roughly 18% in 2024—shifts grade mix toward advanced high-strength and corrosion-resistant alloys. Longer-term contracts with OEMs have improved order visibility and pricing. Flexible mill scheduling allows rapid output shifts to manage cycle swings.
Raw material price swings
Volatility in scrap (regional swings ~15–30% in 2024), ferroalloys and critical inputs like nickel (LME nickel rose ~35% y/y in 2024) and molybdenum (price swings ~20–40% across 2024–H1 2025) materially compress SeAH Besteel margins.
Index-linked surcharges in long-term contracts have enabled partial pass-through, covering a significant share of short-term spikes.
Strategic inventory buffers and supplier hedging reduced spot exposure during 2024 peaks, while data-driven procurement—using weekly price models and forward curve analytics—improved buy timing and lowered purchase volatility.
Exchange rate exposure
KRW volatility (USD/KRW ~1,350 in July 2025) directly alters SeAH Besteel export competitiveness and costs for imported inputs; dollar-denominated sales and dollar-priced raw materials provide natural hedges against FX swings. The group employs financial hedges (forwards/swaps) to smooth reported earnings and limit P&L volatility. Contractual pricing clauses with customers and suppliers further reduce transactional FX risk.
Cost of capital and capex
Higher interest rates (Bank of Korea policy rate 3.50% as of mid‑2025) raise funding costs for furnace, heat‑treatment and sustainability capex, making ROI‑positive debottlenecking essential to protect cash flow. Prioritizing projects with payback under 3–5 years preserves liquidity while phased investments match volatile steel demand. Accessing green financing can lower WACC by roughly 0.25–0.75 percentage points for decarbonization projects.
- Focus: ROI‑positive debottlenecking
- Rate context: BOK 3.50% (mid‑2025)
- Green finance: WACC reduction ~25–75 bps
- Strategy: phased capex aligned to demand outlook
Global special steel competition
- price/quality pressure: Japan, EU, China
- 53% China share (2023)
- differentiation: purity, consistency, certifications
- defense: niche grades, service speed
- repeat business: customer intimacy
Korea trade risk: 25% US tariff, ~70% FTA exposure, LNG & defense shocks
Automotive/shipbuilding cycles drive volumes; global EV new‑car share ~18% in 2024 shifts mix to high‑strength alloys. Input volatility (scrap 15–30% in 2024; LME nickel +35% y/y 2024) and FX (USD/KRW ~1,350 July 2025) compress margins. BOK rate 3.50% (mid‑2025) raises capex cost; index surcharges, hedges and green finance (WACC −25–75 bps) mitigate risk.
| Metric | Value | Impact |
|---|---|---|
| EV share (2024) | 18% | Grade mix shift |
| Scrap volatility (2024) | 15–30% | Margin pressure |
| Ni (LME) y/y 2024 | +35% | Input cost |
| USD/KRW | ~1,350 (Jul 2025) | Competitiveness |
| BOK rate | 3.50% (mid‑2025) | Capex cost |
| Green finance | −25–75 bps WACC | Cost reduction |
Same Document Delivered
SeAH Besteel PESTLE Analysis
The preview shown here is the exact SeAH Besteel PESTLE Analysis you’ll receive after purchase—fully formatted and ready to use. The content, structure, and visual layout are identical to the downloadable file, with no placeholders or teasers. After checkout you’ll instantly get this complete, professionally structured document.











