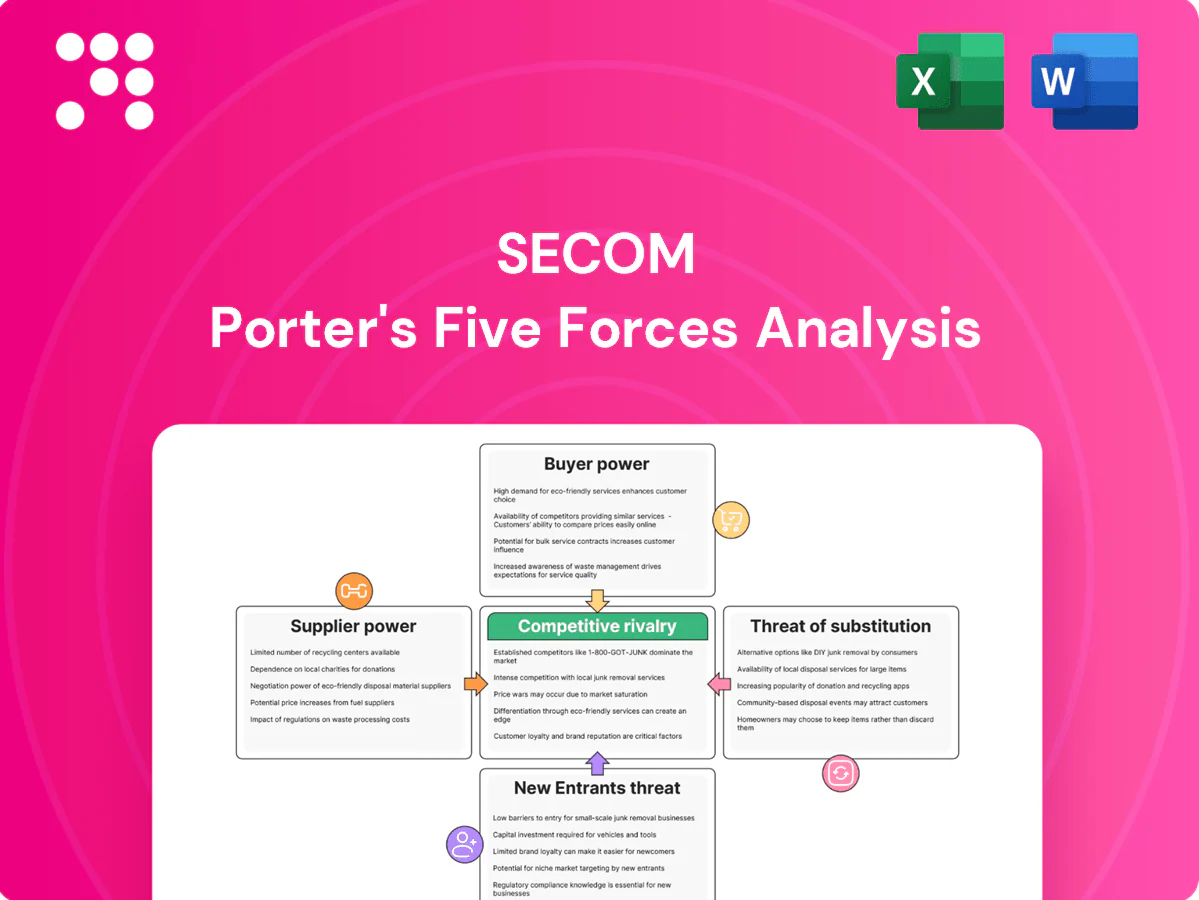
Secom Porter's Five Forces Analysis

A Must-Have Tool for Decision-Makers
Secom faces moderate supplier leverage, high buyer expectations for integrated security services, and evolving threats from tech-driven substitutes and new entrants reshaping margins and pricing power. Competitive rivalry is intense across domestic and international segments, while regulatory and tech shifts amplify strategic risk. This snapshot only scratches the surface—unlock the full Porter's Five Forces Analysis to access force-by-force ratings, visuals, and actionable strategy insights for Secom.
Suppliers Bargaining Power

Specialized security hardware vendors hold selective leverage
Secom relies on certified sensors, cameras, control panels and fire systems that must meet strict Japanese standards, limiting interchangeable sources and giving top-tier OEMs moderate bargaining power. Secom’s nationwide scale and multi-year purchase plans temper pricing pressure, while dual-sourcing strategies and in-house integration reduce dependence on single vendors. This balance yields supplier leverage that is material but contained in practice.
Telecom and cloud infrastructure providers are pivotal
Always-on monitoring depends on carrier networks and cloud services, where the top three cloud providers held about 66% market share in 2024, making uptime SLAs (commonly 99.99%) and bandwidth pricing material. Large telcos and hyperscalers wield negotiating clout, but Secom’s multi-year volume commitments typically secure discounted tiers. Edge redundancy and private MEC or MPLS networks reduce supplier lock-in. EU NIS2 (effective 2024) increases supplier reliability obligations.

Software, analytics, and AI suppliers shape capabilities
Video analytics, AI intrusion detection, and SOC platforms are core to Secom’s offering; the video analytics market was about $7.2B in 2024 and top vendors hold roughly 45% share, letting them command premium terms for differentiated performance. Secom offsets this with internal R&D, strategic partnerships, and modular architectures; API‑first design and data portability cut switching frictions and lower vendor lock‑in.

Medical alert and fire safety device ecosystems are curated
Medical alert and fire safety device ecosystems are curated: regulatory compliance narrows approved suppliers and certification cycles (typically 3–5 years) slow vendor rotation, raising supplier influence; the global medical device market was about $600B in 2024, concentrating purchasing power. Secom’s breadth across safety domains enables volume aggregation to negotiate better terms, while preventive maintenance telemetry benchmarks vendor performance and costs.
- Compliance: certification 3–5 yrs
- Market: global medical devices ~$600B (2024)
- Secom edge: volume aggregation + maintenance telemetry
Real estate and facility partners influence deployment timelines
Building owners, integrators and contractors materially shape Secom deployment timelines by controlling site access and labor windows; in 2024 the global facilities management market, a major driver of scheduling, was estimated at $1.7 trillion, amplifying coordination stakes. Their calendars can add weeks and increase costs; framework agreements and preferred‑partner programs have cut coordination friction, while standardized install kits and training lower on‑site variability and supplier dependence.
- Owners/contractors control access and pace
- Scheduling delays drive cost/time overruns
- Frameworks/preferred partners improve alignment
- Standard kits + training reduce onsite risk
Moderate supplier power: cloud/telco top3 66%, video AI premiums
Secom faces moderate supplier power: certified hardware and regulated safety devices limit substitutes, while scale and multi‑year buys curb price pressure. Hyperscalers/telcos (top3 cloud ~66% share in 2024) and leading video analytics vendors (~45% share; $7.2B market 2024) hold leverage offset by in‑house R&D and dual‑sourcing.
| Supplier | 2024 metric | Impact |
|---|---|---|
| Cloud/telco | Top3 ~66% share | High SLA/pricing leverage |
| Video AI | $7.2B market; ~45% top vendors | Premium terms |
| Medical devices | $600B global | Regulatory lock‑in |
What is included in the product
 Detailed Word Document
Concise Porter's Five Forces analysis tailored for Secom that uncovers competitive drivers, buyer/supplier power, threat of entrants and substitutes, and strategic barriers protecting incumbency. Includes insights on emerging threats and pricing pressure to inform investor, strategy, and operational decisions.

 Customizable Excel Spreadsheet
A concise one-sheet Secom Porter's Five Forces analysis that clarifies competitive pressures for security and facility services—customizable scores and an instant radar view make strategic gaps obvious and ready to paste into decks.
Customers Bargaining Power

Enterprise and government tenders enforce price discipline
Large enterprise and government RFPs for security services run competitive, multi-year (typically 3–5 year) contracts with strict SLAs—often mandating response times under 30 minutes—compressing margins by putting price at the forefront. Buyers wield scale-based leverage through contracts often exceeding several million dollars. Secom differentiates via proven reliability and rapid-response metrics; value-added bundles (services, analytics, maintenance) can recoup roughly 5–10% of headline price pressure.
SMEs balance price with turnkey convenience
SMEs remain price sensitive but favor trusted, integrated Secom-style solutions; 2024 surveys show about 60% prioritize vendor reliability over lowest price. Installed systems and multi-year contracts raise switching costs, while turnkey packages with financing lift retention. Digital self-service can cut service costs by roughly 20–30%, enabling more competitive pricing.

Residential customers face rising DIY alternatives
Consumers can directly compare monthly fees for DIY smart‑home systems often priced under 10 USD/month (Ring Protect from 3–10 USD) against Secom’s professional monitoring, which in 2024 commonly ranges 30–50 USD/month, increasing bargaining power via transparent online pricing. Secom emphasizes faster professional response, verified alarm handling and insurer discounts up to about 20% for monitored systems. Bundles with medical alerts and fire monitoring raise perceived value and reduce churn.

High switching costs curb defection
Rewiring, retraining, and recertification create tangible friction that sharply reduces buyer willingness to defect; integrated Secom platforms across physical, fire, and medical systems increase operational lock-in and blur vendor boundaries. Data migration and sensor re-commissioning are nontrivial technical projects that extend downtime and cost, while contractual early-termination fees further dampen buyer leverage.
- Rewiring/retraining friction
- Integrated physical/fire/medical lock-in
- Data migration and re-commissioning costs
- Early-termination fees reduce leverage
Cross-selling reduces per-product price sensitivity
As of 2024, Secom clients using multiple services prioritize unified billing and single-point support, lowering per-product price sensitivity compared with single-line buyers. Outcome-based SLAs shift negotiations from unit price to risk reduction and uptime guarantees, enabling premium pricing. Framing decisions around customer lifetime value supports stable, subscription-aligned pricing.
- Multi-service adoption lowers unit price pressure
- Outcome SLAs emphasize risk over cost
- CLV framing enables stable pricing
RFPs & SLAs squeeze margins; 60% SMEs choose reliability; DIY 3-10 USD/mo
Large enterprise RFPs (3–5y) push price; SLAs often demand <30min response, compressing margins. 60% of SMEs in 2024 prioritize reliability over lowest price; multi‑service buyers show lower unit sensitivity. Consumer DIY monitors cost 3–10 USD/mo vs Secom 30–50 USD/mo; insurer discounts up to 20% and bundles recoup ~5–10% price pressure.
| Buyer | Leverage | Price (2024) | Switching cost |
|---|---|---|---|
| Enterprise | High (RFPs) | 30–50 USD/mo per site | High |
| SME | Medium | 30–50 USD/mo | Medium |
| Consumer | High (price transparency) | 3–10 USD/mo DIY | Low–Medium |
Full Version Awaits
Secom Porter's Five Forces Analysis
This preview shows the exact Secom Porter's Five Forces analysis you'll receive immediately after purchase—no placeholders or mockups. The document displayed is the full, professionally formatted file, ready for download and use the moment you buy. You're looking at the final deliverable: the same comprehensive analysis available instantly after payment.

A Must-Have Tool for Decision-Makers
Secom faces moderate supplier leverage, high buyer expectations for integrated security services, and evolving threats from tech-driven substitutes and new entrants reshaping margins and pricing power. Competitive rivalry is intense across domestic and international segments, while regulatory and tech shifts amplify strategic risk. This snapshot only scratches the surface—unlock the full Porter's Five Forces Analysis to access force-by-force ratings, visuals, and actionable strategy insights for Secom.
Suppliers Bargaining Power
Specialized security hardware vendors hold selective leverage
Secom relies on certified sensors, cameras, control panels and fire systems that must meet strict Japanese standards, limiting interchangeable sources and giving top-tier OEMs moderate bargaining power. Secom’s nationwide scale and multi-year purchase plans temper pricing pressure, while dual-sourcing strategies and in-house integration reduce dependence on single vendors. This balance yields supplier leverage that is material but contained in practice.
Telecom and cloud infrastructure providers are pivotal
Always-on monitoring depends on carrier networks and cloud services, where the top three cloud providers held about 66% market share in 2024, making uptime SLAs (commonly 99.99%) and bandwidth pricing material. Large telcos and hyperscalers wield negotiating clout, but Secom’s multi-year volume commitments typically secure discounted tiers. Edge redundancy and private MEC or MPLS networks reduce supplier lock-in. EU NIS2 (effective 2024) increases supplier reliability obligations.
Software, analytics, and AI suppliers shape capabilities
Video analytics, AI intrusion detection, and SOC platforms are core to Secom’s offering; the video analytics market was about $7.2B in 2024 and top vendors hold roughly 45% share, letting them command premium terms for differentiated performance. Secom offsets this with internal R&D, strategic partnerships, and modular architectures; API‑first design and data portability cut switching frictions and lower vendor lock‑in.
Medical alert and fire safety device ecosystems are curated
Medical alert and fire safety device ecosystems are curated: regulatory compliance narrows approved suppliers and certification cycles (typically 3–5 years) slow vendor rotation, raising supplier influence; the global medical device market was about $600B in 2024, concentrating purchasing power. Secom’s breadth across safety domains enables volume aggregation to negotiate better terms, while preventive maintenance telemetry benchmarks vendor performance and costs.
- Compliance: certification 3–5 yrs
- Market: global medical devices ~$600B (2024)
- Secom edge: volume aggregation + maintenance telemetry
Real estate and facility partners influence deployment timelines
Building owners, integrators and contractors materially shape Secom deployment timelines by controlling site access and labor windows; in 2024 the global facilities management market, a major driver of scheduling, was estimated at $1.7 trillion, amplifying coordination stakes. Their calendars can add weeks and increase costs; framework agreements and preferred‑partner programs have cut coordination friction, while standardized install kits and training lower on‑site variability and supplier dependence.
- Owners/contractors control access and pace
- Scheduling delays drive cost/time overruns
- Frameworks/preferred partners improve alignment
- Standard kits + training reduce onsite risk
Moderate supplier power: cloud/telco top3 66%, video AI premiums
Secom faces moderate supplier power: certified hardware and regulated safety devices limit substitutes, while scale and multi‑year buys curb price pressure. Hyperscalers/telcos (top3 cloud ~66% share in 2024) and leading video analytics vendors (~45% share; $7.2B market 2024) hold leverage offset by in‑house R&D and dual‑sourcing.
| Supplier | 2024 metric | Impact |
|---|---|---|
| Cloud/telco | Top3 ~66% share | High SLA/pricing leverage |
| Video AI | $7.2B market; ~45% top vendors | Premium terms |
| Medical devices | $600B global | Regulatory lock‑in |
What is included in the product
Detailed Word Document
Concise Porter's Five Forces analysis tailored for Secom that uncovers competitive drivers, buyer/supplier power, threat of entrants and substitutes, and strategic barriers protecting incumbency. Includes insights on emerging threats and pricing pressure to inform investor, strategy, and operational decisions.
Customizable Excel Spreadsheet
A concise one-sheet Secom Porter's Five Forces analysis that clarifies competitive pressures for security and facility services—customizable scores and an instant radar view make strategic gaps obvious and ready to paste into decks.
Customers Bargaining Power
Enterprise and government tenders enforce price discipline
Large enterprise and government RFPs for security services run competitive, multi-year (typically 3–5 year) contracts with strict SLAs—often mandating response times under 30 minutes—compressing margins by putting price at the forefront. Buyers wield scale-based leverage through contracts often exceeding several million dollars. Secom differentiates via proven reliability and rapid-response metrics; value-added bundles (services, analytics, maintenance) can recoup roughly 5–10% of headline price pressure.
SMEs balance price with turnkey convenience
SMEs remain price sensitive but favor trusted, integrated Secom-style solutions; 2024 surveys show about 60% prioritize vendor reliability over lowest price. Installed systems and multi-year contracts raise switching costs, while turnkey packages with financing lift retention. Digital self-service can cut service costs by roughly 20–30%, enabling more competitive pricing.
Residential customers face rising DIY alternatives
Consumers can directly compare monthly fees for DIY smart‑home systems often priced under 10 USD/month (Ring Protect from 3–10 USD) against Secom’s professional monitoring, which in 2024 commonly ranges 30–50 USD/month, increasing bargaining power via transparent online pricing. Secom emphasizes faster professional response, verified alarm handling and insurer discounts up to about 20% for monitored systems. Bundles with medical alerts and fire monitoring raise perceived value and reduce churn.
High switching costs curb defection
Rewiring, retraining, and recertification create tangible friction that sharply reduces buyer willingness to defect; integrated Secom platforms across physical, fire, and medical systems increase operational lock-in and blur vendor boundaries. Data migration and sensor re-commissioning are nontrivial technical projects that extend downtime and cost, while contractual early-termination fees further dampen buyer leverage.
- Rewiring/retraining friction
- Integrated physical/fire/medical lock-in
- Data migration and re-commissioning costs
- Early-termination fees reduce leverage
Cross-selling reduces per-product price sensitivity
As of 2024, Secom clients using multiple services prioritize unified billing and single-point support, lowering per-product price sensitivity compared with single-line buyers. Outcome-based SLAs shift negotiations from unit price to risk reduction and uptime guarantees, enabling premium pricing. Framing decisions around customer lifetime value supports stable, subscription-aligned pricing.
- Multi-service adoption lowers unit price pressure
- Outcome SLAs emphasize risk over cost
- CLV framing enables stable pricing
RFPs & SLAs squeeze margins; 60% SMEs choose reliability; DIY 3-10 USD/mo
Large enterprise RFPs (3–5y) push price; SLAs often demand <30min response, compressing margins. 60% of SMEs in 2024 prioritize reliability over lowest price; multi‑service buyers show lower unit sensitivity. Consumer DIY monitors cost 3–10 USD/mo vs Secom 30–50 USD/mo; insurer discounts up to 20% and bundles recoup ~5–10% price pressure.
| Buyer | Leverage | Price (2024) | Switching cost |
|---|---|---|---|
| Enterprise | High (RFPs) | 30–50 USD/mo per site | High |
| SME | Medium | 30–50 USD/mo | Medium |
| Consumer | High (price transparency) | 3–10 USD/mo DIY | Low–Medium |
Full Version Awaits
Secom Porter's Five Forces Analysis
This preview shows the exact Secom Porter's Five Forces analysis you'll receive immediately after purchase—no placeholders or mockups. The document displayed is the full, professionally formatted file, ready for download and use the moment you buy. You're looking at the final deliverable: the same comprehensive analysis available instantly after payment.
Description
A Must-Have Tool for Decision-Makers
Secom faces moderate supplier leverage, high buyer expectations for integrated security services, and evolving threats from tech-driven substitutes and new entrants reshaping margins and pricing power. Competitive rivalry is intense across domestic and international segments, while regulatory and tech shifts amplify strategic risk. This snapshot only scratches the surface—unlock the full Porter's Five Forces Analysis to access force-by-force ratings, visuals, and actionable strategy insights for Secom.
Suppliers Bargaining Power
Specialized security hardware vendors hold selective leverage
Secom relies on certified sensors, cameras, control panels and fire systems that must meet strict Japanese standards, limiting interchangeable sources and giving top-tier OEMs moderate bargaining power. Secom’s nationwide scale and multi-year purchase plans temper pricing pressure, while dual-sourcing strategies and in-house integration reduce dependence on single vendors. This balance yields supplier leverage that is material but contained in practice.
Telecom and cloud infrastructure providers are pivotal
Always-on monitoring depends on carrier networks and cloud services, where the top three cloud providers held about 66% market share in 2024, making uptime SLAs (commonly 99.99%) and bandwidth pricing material. Large telcos and hyperscalers wield negotiating clout, but Secom’s multi-year volume commitments typically secure discounted tiers. Edge redundancy and private MEC or MPLS networks reduce supplier lock-in. EU NIS2 (effective 2024) increases supplier reliability obligations.
Software, analytics, and AI suppliers shape capabilities
Video analytics, AI intrusion detection, and SOC platforms are core to Secom’s offering; the video analytics market was about $7.2B in 2024 and top vendors hold roughly 45% share, letting them command premium terms for differentiated performance. Secom offsets this with internal R&D, strategic partnerships, and modular architectures; API‑first design and data portability cut switching frictions and lower vendor lock‑in.
Medical alert and fire safety device ecosystems are curated
Medical alert and fire safety device ecosystems are curated: regulatory compliance narrows approved suppliers and certification cycles (typically 3–5 years) slow vendor rotation, raising supplier influence; the global medical device market was about $600B in 2024, concentrating purchasing power. Secom’s breadth across safety domains enables volume aggregation to negotiate better terms, while preventive maintenance telemetry benchmarks vendor performance and costs.
- Compliance: certification 3–5 yrs
- Market: global medical devices ~$600B (2024)
- Secom edge: volume aggregation + maintenance telemetry
Real estate and facility partners influence deployment timelines
Building owners, integrators and contractors materially shape Secom deployment timelines by controlling site access and labor windows; in 2024 the global facilities management market, a major driver of scheduling, was estimated at $1.7 trillion, amplifying coordination stakes. Their calendars can add weeks and increase costs; framework agreements and preferred‑partner programs have cut coordination friction, while standardized install kits and training lower on‑site variability and supplier dependence.
- Owners/contractors control access and pace
- Scheduling delays drive cost/time overruns
- Frameworks/preferred partners improve alignment
- Standard kits + training reduce onsite risk
Moderate supplier power: cloud/telco top3 66%, video AI premiums
Secom faces moderate supplier power: certified hardware and regulated safety devices limit substitutes, while scale and multi‑year buys curb price pressure. Hyperscalers/telcos (top3 cloud ~66% share in 2024) and leading video analytics vendors (~45% share; $7.2B market 2024) hold leverage offset by in‑house R&D and dual‑sourcing.
| Supplier | 2024 metric | Impact |
|---|---|---|
| Cloud/telco | Top3 ~66% share | High SLA/pricing leverage |
| Video AI | $7.2B market; ~45% top vendors | Premium terms |
| Medical devices | $600B global | Regulatory lock‑in |
What is included in the product
Detailed Word Document
Concise Porter's Five Forces analysis tailored for Secom that uncovers competitive drivers, buyer/supplier power, threat of entrants and substitutes, and strategic barriers protecting incumbency. Includes insights on emerging threats and pricing pressure to inform investor, strategy, and operational decisions.
Customizable Excel Spreadsheet
A concise one-sheet Secom Porter's Five Forces analysis that clarifies competitive pressures for security and facility services—customizable scores and an instant radar view make strategic gaps obvious and ready to paste into decks.
Customers Bargaining Power
Enterprise and government tenders enforce price discipline
Large enterprise and government RFPs for security services run competitive, multi-year (typically 3–5 year) contracts with strict SLAs—often mandating response times under 30 minutes—compressing margins by putting price at the forefront. Buyers wield scale-based leverage through contracts often exceeding several million dollars. Secom differentiates via proven reliability and rapid-response metrics; value-added bundles (services, analytics, maintenance) can recoup roughly 5–10% of headline price pressure.
SMEs balance price with turnkey convenience
SMEs remain price sensitive but favor trusted, integrated Secom-style solutions; 2024 surveys show about 60% prioritize vendor reliability over lowest price. Installed systems and multi-year contracts raise switching costs, while turnkey packages with financing lift retention. Digital self-service can cut service costs by roughly 20–30%, enabling more competitive pricing.
Residential customers face rising DIY alternatives
Consumers can directly compare monthly fees for DIY smart‑home systems often priced under 10 USD/month (Ring Protect from 3–10 USD) against Secom’s professional monitoring, which in 2024 commonly ranges 30–50 USD/month, increasing bargaining power via transparent online pricing. Secom emphasizes faster professional response, verified alarm handling and insurer discounts up to about 20% for monitored systems. Bundles with medical alerts and fire monitoring raise perceived value and reduce churn.
High switching costs curb defection
Rewiring, retraining, and recertification create tangible friction that sharply reduces buyer willingness to defect; integrated Secom platforms across physical, fire, and medical systems increase operational lock-in and blur vendor boundaries. Data migration and sensor re-commissioning are nontrivial technical projects that extend downtime and cost, while contractual early-termination fees further dampen buyer leverage.
- Rewiring/retraining friction
- Integrated physical/fire/medical lock-in
- Data migration and re-commissioning costs
- Early-termination fees reduce leverage
Cross-selling reduces per-product price sensitivity
As of 2024, Secom clients using multiple services prioritize unified billing and single-point support, lowering per-product price sensitivity compared with single-line buyers. Outcome-based SLAs shift negotiations from unit price to risk reduction and uptime guarantees, enabling premium pricing. Framing decisions around customer lifetime value supports stable, subscription-aligned pricing.
- Multi-service adoption lowers unit price pressure
- Outcome SLAs emphasize risk over cost
- CLV framing enables stable pricing
RFPs & SLAs squeeze margins; 60% SMEs choose reliability; DIY 3-10 USD/mo
Large enterprise RFPs (3–5y) push price; SLAs often demand <30min response, compressing margins. 60% of SMEs in 2024 prioritize reliability over lowest price; multi‑service buyers show lower unit sensitivity. Consumer DIY monitors cost 3–10 USD/mo vs Secom 30–50 USD/mo; insurer discounts up to 20% and bundles recoup ~5–10% price pressure.
| Buyer | Leverage | Price (2024) | Switching cost |
|---|---|---|---|
| Enterprise | High (RFPs) | 30–50 USD/mo per site | High |
| SME | Medium | 30–50 USD/mo | Medium |
| Consumer | High (price transparency) | 3–10 USD/mo DIY | Low–Medium |
Full Version Awaits
Secom Porter's Five Forces Analysis
This preview shows the exact Secom Porter's Five Forces analysis you'll receive immediately after purchase—no placeholders or mockups. The document displayed is the full, professionally formatted file, ready for download and use the moment you buy. You're looking at the final deliverable: the same comprehensive analysis available instantly after payment.











