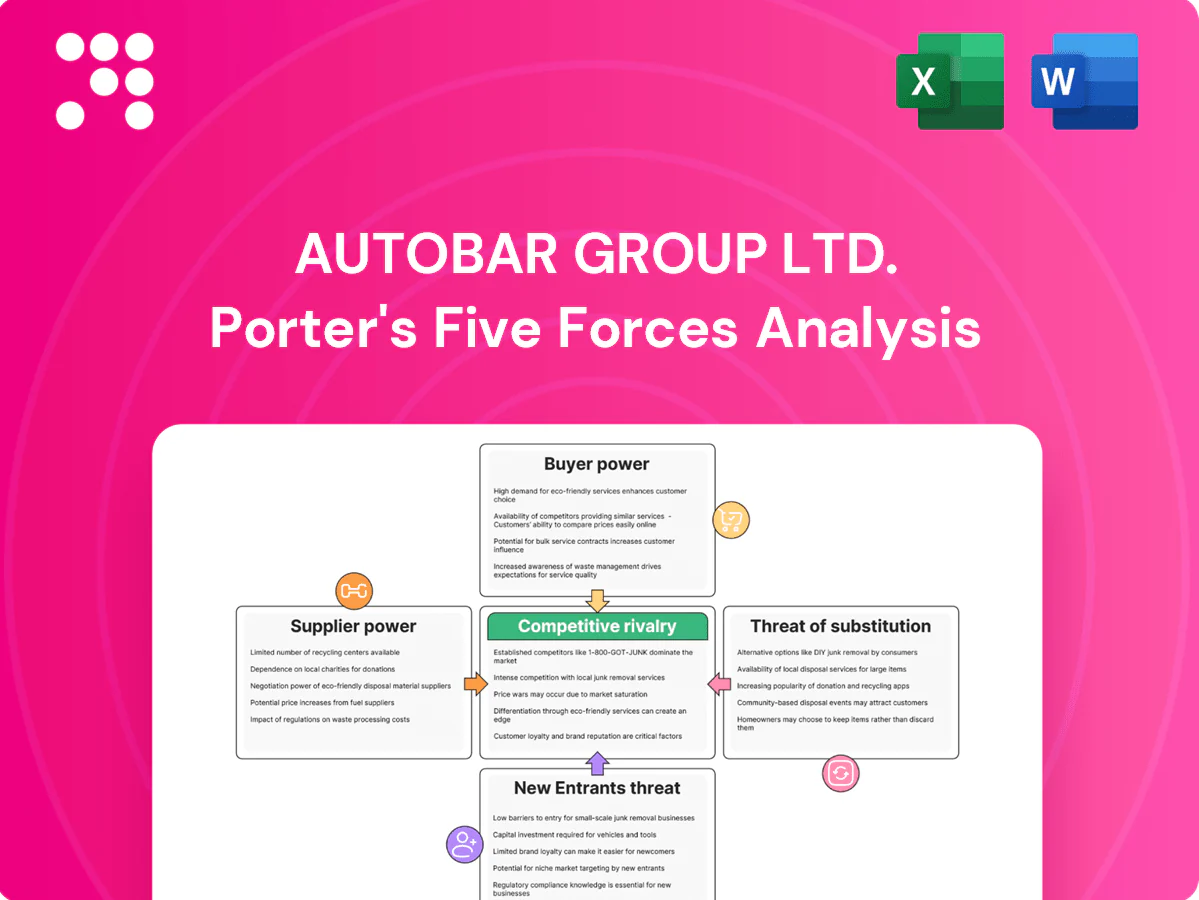
Autobar Group Ltd. Porter's Five Forces Analysis

Don't Miss the Bigger Picture
Autobar Group Ltd. faces moderate buyer power, concentrated suppliers and rising substitute risks as digital alternatives reshape demand. Barriers to entry are mixed—brand reputation and distribution help, but low-capital tech entrants increase potential threats. Competitive rivalry is intense amid margin pressure.
This brief snapshot only scratches the surface. Unlock the full Porter's Five Forces Analysis to explore Autobar Group Ltd.’s competitive dynamics, market pressures, and strategic advantages in detail.
Suppliers Bargaining Power

Concentrated machine OEMs
Few global OEMs such as Evoca (N&W) and Crane dominate commercial vending and coffee machines, constraining Autobar/Selecta’s bargaining leverage. Dependence on specific models and spares creates locked-in pricing and typical spare-part lead times of 8–12 weeks. Long certification cycles, frequently exceeding six months, make rapid switching costly. High volumes help but OEM concentration sustains supplier power.
Branded coffee & ingredients
Premium roasters and beverage brands exert pricing power, often capturing higher retail premiums while setting quality specs; specialty coffee commands roughly a 20–30% price premium over commodity Arabica. Commodity volatility in coffee, milk, cocoa and sugar transmits to suppliers with lags of 3–12 months. Private-label sourcing can reduce cost exposure but brand-sensitive clients may resist; sustainability-certified coffee exceeded about 25% of market volume in 2023, narrowing supplier options.

Payment & telematics stack
Cashless readers, telemetry hardware and software platforms are supplied by specialized vendors, creating integration and PCI DSS dependencies that raise switching friction; PCI DSS is mandatory for any entity handling card data (PCI Security Standards Council). Service fees and upgrade cycles give vendors pricing influence—card processing fees commonly run about 2–3% per transaction. Downtime risk is acute: Gartner estimates average IT downtime costs around $5,600 per minute, limiting bargaining leverage.

Packaging & consumables exposure
Packaging for cups, lids, filters and RTD snacks leaves Autobar exposed to resin and energy cost swings, with global container spot rates easing to roughly 2,000–3,000 USD/FEU in 2024 but raw-material volatility still feeding supplier pricing; MOQ and route-based logistics surcharges compress margins, ESG recyclability rules limit low-cost substitutes, and rapid inflation episodes can outpace contract indexation.
- resin & energy exposure
- logistics squeeze: 2024 rates ~2–3k USD/FEU
- MOQ pressure on route ops
- ESG/recyclability limits sourcing
Service parts and maintenance
Proprietary service parts and OEM-certified technicians keep repairs inside manufacturer networks, while warranty clauses commonly restrict third-party work, concentrating maintenance spend. Parts scarcity frequently extends SLAs and elevates downtime, strengthening suppliers’ leverage over pricing and service terms.
- OEM parts lock-in
- Warranty limits third-party repairs
- Scarcity prolongs SLAs
- Increased supplier leverage
Supplier power high: 8–12 wks lead times, 20–30% premium
Supplier power is high: OEMs concentrate supply (few global vendors), spare lead times 8–12 weeks and certification >6 months raise switching costs. Premium roasters capture 20–30% price premiums and sustainability-certified coffee ~25% of market (2023). Card processing and telemetry fees (2–3% per txn) plus PCI DSS dependencies and IT downtime (~$5,600/min) further strengthen suppliers.
| Supplier factor | Impact | Key metric (2023/24) |
|---|---|---|
| OEM machine/parts | High lock-in | Lead times 8–12 wks; certs >6 mos |
| Premium coffee | Price power | 20–30% premium; 25% certified (2023) |
| Cashless/IT | Switching friction | Fees 2–3%; downtime $5,600/min |
What is included in the product
 Detailed Word Document
Tailored exclusively for Autobar Group Ltd., this Porter's Five Forces overview uncovers key drivers of competition, buyer and supplier influence on pricing and profitability, threats from substitutes and new entrants, and identifies disruptive forces and market dynamics that shape the company’s competitive resilience.

 Customizable Excel Spreadsheet
A clear, one-sheet Porter's Five Forces for Autobar Group Ltd—instantly reveal competitive pressures and relieve strategic blind spots for faster, confident decision-making.
Customers Bargaining Power

Large multisite tenders
Large multisite tenders concentrate buying power across corporate, healthcare and education portfolios; in 2024 many RFPs benchmark price, uptime SLAs and innovation, driving competitive bids. Buyers routinely extract volume discounts and rebate structures—often achieving 15–25% off list pricing—and tie payments to KPIs; failure to meet SLA/KPI targets risks financial penalties or contract churn.
Low differentiation perception
In 2024 many buyers continue to view vending as a commoditized service; when product range and pricing appear similar they push aggressively for lower rates. Without demonstrable data insights (usage and uptake metrics) and verifiable ESG credentials to justify premiums, purchasers default to price as the deciding factor. Autobar must monetize analytics and sustainability to protect margins.

Moderate switching costs
Moderate switching costs: machine removal/installation and menu setup create friction but are manageable; typical commercial contracts run 12–36 months enabling timed rollovers. Standard footprints and common 110–240V power needs ease replacement and reduce site adaptation. In 2024 industry surveys, documented performance faults often prompt vendor changes within 3–6 months.

Choice of channel mix
Workplaces increasingly choose OCS, micro‑markets, caterers or external cafés over traditional vending, giving buyers stronger leverage against Autobar; the global vending market was valued at about USD 31.8 billion in 2023, while automated retail and micro‑market adoption accelerated into 2024. Buyers can split contracts across vendors and award by site or service line, diluting any single operator’s pricing power and forcing flexible pricing and service bundling.
- Outside options: OCS, micro‑markets, caterers, external cafés
- Market context: global vending ≈ USD 31.8bn (2023)
- Buyer tactics: split awards, multi‑vendor sourcing
- Impact: reduced single‑operator leverage, pressure on margins
Data and ESG demands
Buyers increasingly demand telemetry dashboards, cashless payments and waste reporting; 63% of procurement leaders reported ESG clauses in RFPs in 2024 (Deloitte), making healthier ranges and ethical sourcing table stakes. These features raise unit costs unless contract pricing compensates, and sophisticated buyers leverage requirements to extract price concessions and service premiums.
- Telemetry dashboards: operational transparency expectations up 2024
- Cashless adoption: reduced handling costs, higher tech spend
- Waste reporting & ESG: 63%+ procurement RFP inclusion (2024)
- Buyer leverage: clauses used to negotiate lower margins
Multisite tenders cut prices 15–25%; 63% of RFPs add ESG
Large multisite tenders concentrate buying power; buyers secure 15–25% discounts and tie payments to SLA/KPIs, risking penalties. Commoditization and manageable switching (12–36m contracts) force price-led bids unless analytics/ESG justify premiums. Market signal: global vending ≈ USD 31.8bn (2023); 63% of RFPs included ESG clauses in 2024 (Deloitte).
| Metric | Value |
|---|---|
| Average discount | 15–25% |
| Contract length | 12–36 months |
| Market size | USD 31.8bn (2023) |
| ESG RFPs | 63% (2024) |
Preview the Actual Deliverable
Autobar Group Ltd. Porter's Five Forces Analysis
This preview shows the exact document you'll receive—no surprises, no placeholders. The Porter’s Five Forces analysis for Autobar Group Ltd. evaluates competitive rivalry, supplier and buyer power, threat of new entrants and substitutes, and regulatory influences, offering actionable insights on strategic positioning and risk mitigation.

Don't Miss the Bigger Picture
Autobar Group Ltd. faces moderate buyer power, concentrated suppliers and rising substitute risks as digital alternatives reshape demand. Barriers to entry are mixed—brand reputation and distribution help, but low-capital tech entrants increase potential threats. Competitive rivalry is intense amid margin pressure.
This brief snapshot only scratches the surface. Unlock the full Porter's Five Forces Analysis to explore Autobar Group Ltd.’s competitive dynamics, market pressures, and strategic advantages in detail.
Suppliers Bargaining Power
Concentrated machine OEMs
Few global OEMs such as Evoca (N&W) and Crane dominate commercial vending and coffee machines, constraining Autobar/Selecta’s bargaining leverage. Dependence on specific models and spares creates locked-in pricing and typical spare-part lead times of 8–12 weeks. Long certification cycles, frequently exceeding six months, make rapid switching costly. High volumes help but OEM concentration sustains supplier power.
Branded coffee & ingredients
Premium roasters and beverage brands exert pricing power, often capturing higher retail premiums while setting quality specs; specialty coffee commands roughly a 20–30% price premium over commodity Arabica. Commodity volatility in coffee, milk, cocoa and sugar transmits to suppliers with lags of 3–12 months. Private-label sourcing can reduce cost exposure but brand-sensitive clients may resist; sustainability-certified coffee exceeded about 25% of market volume in 2023, narrowing supplier options.
Payment & telematics stack
Cashless readers, telemetry hardware and software platforms are supplied by specialized vendors, creating integration and PCI DSS dependencies that raise switching friction; PCI DSS is mandatory for any entity handling card data (PCI Security Standards Council). Service fees and upgrade cycles give vendors pricing influence—card processing fees commonly run about 2–3% per transaction. Downtime risk is acute: Gartner estimates average IT downtime costs around $5,600 per minute, limiting bargaining leverage.
Packaging & consumables exposure
Packaging for cups, lids, filters and RTD snacks leaves Autobar exposed to resin and energy cost swings, with global container spot rates easing to roughly 2,000–3,000 USD/FEU in 2024 but raw-material volatility still feeding supplier pricing; MOQ and route-based logistics surcharges compress margins, ESG recyclability rules limit low-cost substitutes, and rapid inflation episodes can outpace contract indexation.
- resin & energy exposure
- logistics squeeze: 2024 rates ~2–3k USD/FEU
- MOQ pressure on route ops
- ESG/recyclability limits sourcing
Service parts and maintenance
Proprietary service parts and OEM-certified technicians keep repairs inside manufacturer networks, while warranty clauses commonly restrict third-party work, concentrating maintenance spend. Parts scarcity frequently extends SLAs and elevates downtime, strengthening suppliers’ leverage over pricing and service terms.
- OEM parts lock-in
- Warranty limits third-party repairs
- Scarcity prolongs SLAs
- Increased supplier leverage
Supplier power high: 8–12 wks lead times, 20–30% premium
Supplier power is high: OEMs concentrate supply (few global vendors), spare lead times 8–12 weeks and certification >6 months raise switching costs. Premium roasters capture 20–30% price premiums and sustainability-certified coffee ~25% of market (2023). Card processing and telemetry fees (2–3% per txn) plus PCI DSS dependencies and IT downtime (~$5,600/min) further strengthen suppliers.
| Supplier factor | Impact | Key metric (2023/24) |
|---|---|---|
| OEM machine/parts | High lock-in | Lead times 8–12 wks; certs >6 mos |
| Premium coffee | Price power | 20–30% premium; 25% certified (2023) |
| Cashless/IT | Switching friction | Fees 2–3%; downtime $5,600/min |
What is included in the product
Detailed Word Document
Tailored exclusively for Autobar Group Ltd., this Porter's Five Forces overview uncovers key drivers of competition, buyer and supplier influence on pricing and profitability, threats from substitutes and new entrants, and identifies disruptive forces and market dynamics that shape the company’s competitive resilience.
Customizable Excel Spreadsheet
A clear, one-sheet Porter's Five Forces for Autobar Group Ltd—instantly reveal competitive pressures and relieve strategic blind spots for faster, confident decision-making.
Customers Bargaining Power
Large multisite tenders
Large multisite tenders concentrate buying power across corporate, healthcare and education portfolios; in 2024 many RFPs benchmark price, uptime SLAs and innovation, driving competitive bids. Buyers routinely extract volume discounts and rebate structures—often achieving 15–25% off list pricing—and tie payments to KPIs; failure to meet SLA/KPI targets risks financial penalties or contract churn.
Low differentiation perception
In 2024 many buyers continue to view vending as a commoditized service; when product range and pricing appear similar they push aggressively for lower rates. Without demonstrable data insights (usage and uptake metrics) and verifiable ESG credentials to justify premiums, purchasers default to price as the deciding factor. Autobar must monetize analytics and sustainability to protect margins.
Moderate switching costs
Moderate switching costs: machine removal/installation and menu setup create friction but are manageable; typical commercial contracts run 12–36 months enabling timed rollovers. Standard footprints and common 110–240V power needs ease replacement and reduce site adaptation. In 2024 industry surveys, documented performance faults often prompt vendor changes within 3–6 months.
Choice of channel mix
Workplaces increasingly choose OCS, micro‑markets, caterers or external cafés over traditional vending, giving buyers stronger leverage against Autobar; the global vending market was valued at about USD 31.8 billion in 2023, while automated retail and micro‑market adoption accelerated into 2024. Buyers can split contracts across vendors and award by site or service line, diluting any single operator’s pricing power and forcing flexible pricing and service bundling.
- Outside options: OCS, micro‑markets, caterers, external cafés
- Market context: global vending ≈ USD 31.8bn (2023)
- Buyer tactics: split awards, multi‑vendor sourcing
- Impact: reduced single‑operator leverage, pressure on margins
Data and ESG demands
Buyers increasingly demand telemetry dashboards, cashless payments and waste reporting; 63% of procurement leaders reported ESG clauses in RFPs in 2024 (Deloitte), making healthier ranges and ethical sourcing table stakes. These features raise unit costs unless contract pricing compensates, and sophisticated buyers leverage requirements to extract price concessions and service premiums.
- Telemetry dashboards: operational transparency expectations up 2024
- Cashless adoption: reduced handling costs, higher tech spend
- Waste reporting & ESG: 63%+ procurement RFP inclusion (2024)
- Buyer leverage: clauses used to negotiate lower margins
Multisite tenders cut prices 15–25%; 63% of RFPs add ESG
Large multisite tenders concentrate buying power; buyers secure 15–25% discounts and tie payments to SLA/KPIs, risking penalties. Commoditization and manageable switching (12–36m contracts) force price-led bids unless analytics/ESG justify premiums. Market signal: global vending ≈ USD 31.8bn (2023); 63% of RFPs included ESG clauses in 2024 (Deloitte).
| Metric | Value |
|---|---|
| Average discount | 15–25% |
| Contract length | 12–36 months |
| Market size | USD 31.8bn (2023) |
| ESG RFPs | 63% (2024) |
Preview the Actual Deliverable
Autobar Group Ltd. Porter's Five Forces Analysis
This preview shows the exact document you'll receive—no surprises, no placeholders. The Porter’s Five Forces analysis for Autobar Group Ltd. evaluates competitive rivalry, supplier and buyer power, threat of new entrants and substitutes, and regulatory influences, offering actionable insights on strategic positioning and risk mitigation.
Description
Don't Miss the Bigger Picture
Autobar Group Ltd. faces moderate buyer power, concentrated suppliers and rising substitute risks as digital alternatives reshape demand. Barriers to entry are mixed—brand reputation and distribution help, but low-capital tech entrants increase potential threats. Competitive rivalry is intense amid margin pressure.
This brief snapshot only scratches the surface. Unlock the full Porter's Five Forces Analysis to explore Autobar Group Ltd.’s competitive dynamics, market pressures, and strategic advantages in detail.
Suppliers Bargaining Power
Concentrated machine OEMs
Few global OEMs such as Evoca (N&W) and Crane dominate commercial vending and coffee machines, constraining Autobar/Selecta’s bargaining leverage. Dependence on specific models and spares creates locked-in pricing and typical spare-part lead times of 8–12 weeks. Long certification cycles, frequently exceeding six months, make rapid switching costly. High volumes help but OEM concentration sustains supplier power.
Branded coffee & ingredients
Premium roasters and beverage brands exert pricing power, often capturing higher retail premiums while setting quality specs; specialty coffee commands roughly a 20–30% price premium over commodity Arabica. Commodity volatility in coffee, milk, cocoa and sugar transmits to suppliers with lags of 3–12 months. Private-label sourcing can reduce cost exposure but brand-sensitive clients may resist; sustainability-certified coffee exceeded about 25% of market volume in 2023, narrowing supplier options.
Payment & telematics stack
Cashless readers, telemetry hardware and software platforms are supplied by specialized vendors, creating integration and PCI DSS dependencies that raise switching friction; PCI DSS is mandatory for any entity handling card data (PCI Security Standards Council). Service fees and upgrade cycles give vendors pricing influence—card processing fees commonly run about 2–3% per transaction. Downtime risk is acute: Gartner estimates average IT downtime costs around $5,600 per minute, limiting bargaining leverage.
Packaging & consumables exposure
Packaging for cups, lids, filters and RTD snacks leaves Autobar exposed to resin and energy cost swings, with global container spot rates easing to roughly 2,000–3,000 USD/FEU in 2024 but raw-material volatility still feeding supplier pricing; MOQ and route-based logistics surcharges compress margins, ESG recyclability rules limit low-cost substitutes, and rapid inflation episodes can outpace contract indexation.
- resin & energy exposure
- logistics squeeze: 2024 rates ~2–3k USD/FEU
- MOQ pressure on route ops
- ESG/recyclability limits sourcing
Service parts and maintenance
Proprietary service parts and OEM-certified technicians keep repairs inside manufacturer networks, while warranty clauses commonly restrict third-party work, concentrating maintenance spend. Parts scarcity frequently extends SLAs and elevates downtime, strengthening suppliers’ leverage over pricing and service terms.
- OEM parts lock-in
- Warranty limits third-party repairs
- Scarcity prolongs SLAs
- Increased supplier leverage
Supplier power high: 8–12 wks lead times, 20–30% premium
Supplier power is high: OEMs concentrate supply (few global vendors), spare lead times 8–12 weeks and certification >6 months raise switching costs. Premium roasters capture 20–30% price premiums and sustainability-certified coffee ~25% of market (2023). Card processing and telemetry fees (2–3% per txn) plus PCI DSS dependencies and IT downtime (~$5,600/min) further strengthen suppliers.
| Supplier factor | Impact | Key metric (2023/24) |
|---|---|---|
| OEM machine/parts | High lock-in | Lead times 8–12 wks; certs >6 mos |
| Premium coffee | Price power | 20–30% premium; 25% certified (2023) |
| Cashless/IT | Switching friction | Fees 2–3%; downtime $5,600/min |
What is included in the product
Detailed Word Document
Tailored exclusively for Autobar Group Ltd., this Porter's Five Forces overview uncovers key drivers of competition, buyer and supplier influence on pricing and profitability, threats from substitutes and new entrants, and identifies disruptive forces and market dynamics that shape the company’s competitive resilience.
Customizable Excel Spreadsheet
A clear, one-sheet Porter's Five Forces for Autobar Group Ltd—instantly reveal competitive pressures and relieve strategic blind spots for faster, confident decision-making.
Customers Bargaining Power
Large multisite tenders
Large multisite tenders concentrate buying power across corporate, healthcare and education portfolios; in 2024 many RFPs benchmark price, uptime SLAs and innovation, driving competitive bids. Buyers routinely extract volume discounts and rebate structures—often achieving 15–25% off list pricing—and tie payments to KPIs; failure to meet SLA/KPI targets risks financial penalties or contract churn.
Low differentiation perception
In 2024 many buyers continue to view vending as a commoditized service; when product range and pricing appear similar they push aggressively for lower rates. Without demonstrable data insights (usage and uptake metrics) and verifiable ESG credentials to justify premiums, purchasers default to price as the deciding factor. Autobar must monetize analytics and sustainability to protect margins.
Moderate switching costs
Moderate switching costs: machine removal/installation and menu setup create friction but are manageable; typical commercial contracts run 12–36 months enabling timed rollovers. Standard footprints and common 110–240V power needs ease replacement and reduce site adaptation. In 2024 industry surveys, documented performance faults often prompt vendor changes within 3–6 months.
Choice of channel mix
Workplaces increasingly choose OCS, micro‑markets, caterers or external cafés over traditional vending, giving buyers stronger leverage against Autobar; the global vending market was valued at about USD 31.8 billion in 2023, while automated retail and micro‑market adoption accelerated into 2024. Buyers can split contracts across vendors and award by site or service line, diluting any single operator’s pricing power and forcing flexible pricing and service bundling.
- Outside options: OCS, micro‑markets, caterers, external cafés
- Market context: global vending ≈ USD 31.8bn (2023)
- Buyer tactics: split awards, multi‑vendor sourcing
- Impact: reduced single‑operator leverage, pressure on margins
Data and ESG demands
Buyers increasingly demand telemetry dashboards, cashless payments and waste reporting; 63% of procurement leaders reported ESG clauses in RFPs in 2024 (Deloitte), making healthier ranges and ethical sourcing table stakes. These features raise unit costs unless contract pricing compensates, and sophisticated buyers leverage requirements to extract price concessions and service premiums.
- Telemetry dashboards: operational transparency expectations up 2024
- Cashless adoption: reduced handling costs, higher tech spend
- Waste reporting & ESG: 63%+ procurement RFP inclusion (2024)
- Buyer leverage: clauses used to negotiate lower margins
Multisite tenders cut prices 15–25%; 63% of RFPs add ESG
Large multisite tenders concentrate buying power; buyers secure 15–25% discounts and tie payments to SLA/KPIs, risking penalties. Commoditization and manageable switching (12–36m contracts) force price-led bids unless analytics/ESG justify premiums. Market signal: global vending ≈ USD 31.8bn (2023); 63% of RFPs included ESG clauses in 2024 (Deloitte).
| Metric | Value |
|---|---|
| Average discount | 15–25% |
| Contract length | 12–36 months |
| Market size | USD 31.8bn (2023) |
| ESG RFPs | 63% (2024) |
Preview the Actual Deliverable
Autobar Group Ltd. Porter's Five Forces Analysis
This preview shows the exact document you'll receive—no surprises, no placeholders. The Porter’s Five Forces analysis for Autobar Group Ltd. evaluates competitive rivalry, supplier and buyer power, threat of new entrants and substitutes, and regulatory influences, offering actionable insights on strategic positioning and risk mitigation.











