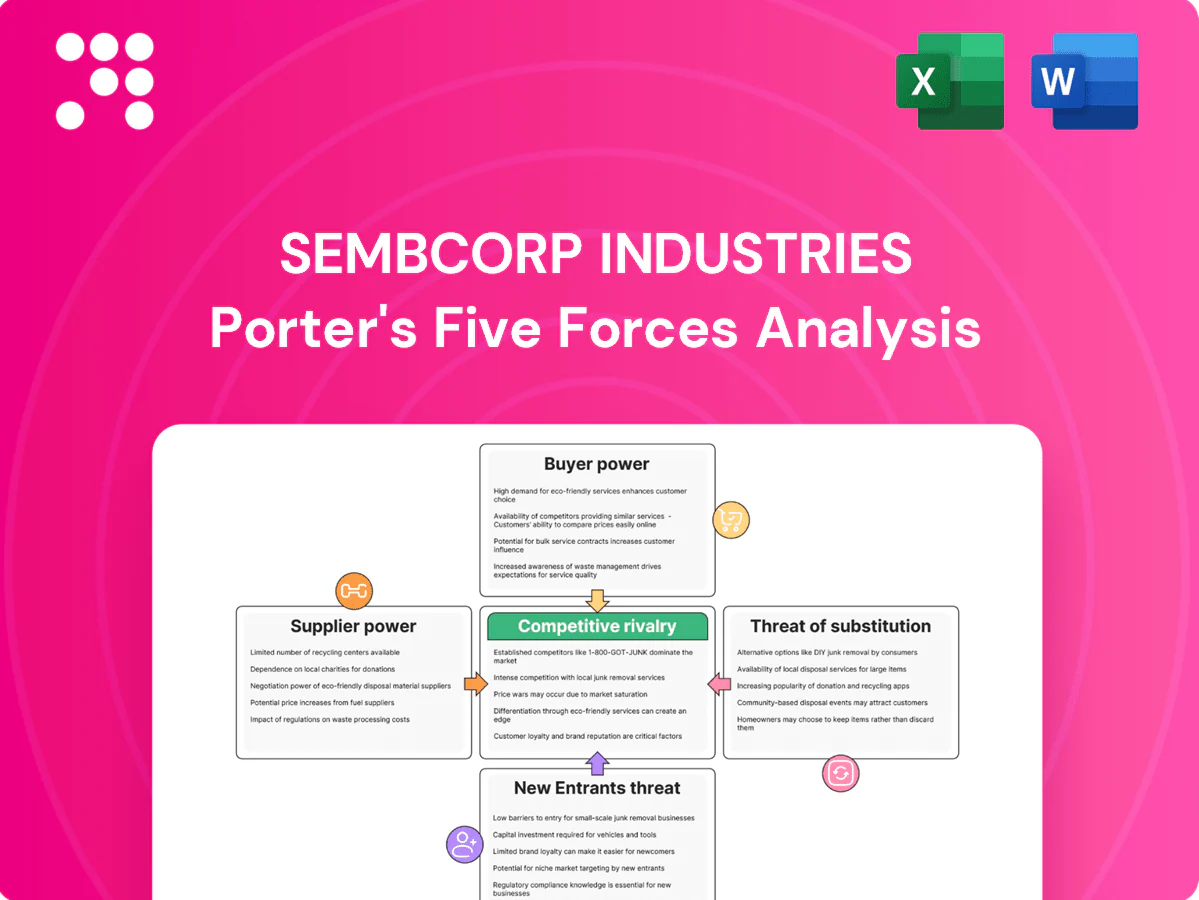
Sembcorp Industries Porter's Five Forces Analysis

Go Beyond the Preview—Access the Full Strategic Report
Sembcorp Industries faces moderate buyer power, variable supplier leverage across energy and utilities, and evolving threat from renewable-focused new entrants and substitutes; competitive rivalry hinges on scale and regulatory positioning. This brief snapshot only scratches the surface. Unlock the full Porter's Five Forces Analysis to explore Sembcorp’s competitive dynamics and strategic implications in detail.
Suppliers Bargaining Power

Concentrated fuel and equipment sources
Concentrated gas suppliers in Sembcorp’s key markets and dominant OEMs for turbines, panels and inverters raise switching costs and delivery risk, giving suppliers moderate-to-high leverage on price and contract terms. Long-term gas contracts and qualified vendor lists partially mitigate price volatility and availability shocks. Persistent supply-chain bottlenecks for grid equipment and transformers can extend project timelines and increase capital lock-up.
Commodity price volatility pass-through
Power of suppliers rises when commodity inputs spike and escalation clauses are limited; for Sembcorp this is acute as module and battery swings drive capex and IRR sensitivity. Battery pack prices averaged about 132 USD/kWh in 2023 (BNEF), limiting pass-through if tariffs or hedges lag. Regulated tariff mechanisms and hedging can transfer costs but timing gaps create margin squeeze. Supplier leverage tightens in markets with long lead times and constrained supply.

EPC and balance-of-plant capacity constraints
In 2024 limited qualified EPC contractors in key jurisdictions allow bidders to push up prices, especially for complex balance-of-plant works, giving suppliers episodic bargaining power. Execution risk on multi-country pipelines increases Sembcorp's dependence on a narrow set of partners, raising schedule and cost exposure. Dual-sourcing and frame agreements mitigate but cannot replace scarce site-specific capabilities.

Grid connection and land access as quasi-suppliers
Transmission operators and land banks act as quasi-suppliers for Sembcorp, creating bottlenecks where queue positions, connection charges and land permits materially affect project timelines and IRR, with reported grid connection waits often in the range of 12–24 months and connection fees forming a noticeable share of upfront capex.
- Queue delays: 12–24 months
- Connection fees: significant share of capex
- Prime-node scarcity: lifts land premiums and project costs
Financing and tax equity availability
Capital providers set covenants and pricing that materially shape Sembcorp project economics; in 2024 lenders continued to demand tighter debt-service covenants and pricing spreads roughly 50–150bp above pre-2022 levels, and tax-equity pools remain constrained in key markets. Strong sponsor reputation can trim spreads but not remove cyclicality, as lenders’ bargaining power spikes in risk-off periods.
- 2024 YTD global green bond issuance ~150bn (H1)
- Debt spreads +50–150bp vs pre-2022
- Tax-equity scarcity increases financing rigidity
Concentrated gas, OEM dominance elevate supplier leverage; debt spreads +50-150bp squeeze IRR
Concentrated gas and dominant OEMs keep supplier leverage moderate-to-high, raising switching costs and price risk. Long-term contracts, qualified vendors and frame agreements partially cushion shocks but scarce EPCs, grid delays and land scarcity lift capex and schedule exposure. Financing tightened in 2024 (debt spreads +50–150bp), compressing IRR during input price spikes.
| Metric | 2024 figure | Impact |
|---|---|---|
| Battery price (BNEF) | ~132 USD/kWh (2023) | Capex sensitivity |
| Green bond H1 | ~150bn USD | liquidity pool |
| Queue delays | 12–24 months | timeline risk |
| Debt spread | +50–150bp vs pre-2022 | higher financing cost |
What is included in the product
 Detailed Word Document
Tailored Porter's Five Forces analysis for Sembcorp Industries revealing competitive intensity, supplier and buyer power, barriers deterring new entrants, and threat of substitutes; highlights disruptive technologies and regulatory risks shaping profitability.

 Customizable Excel Spreadsheet
Clear one-sheet summary of Sembcorp Industries' Porter's Five Forces for quick strategic decisions; customizable pressure levels and spider-chart visualization make it easy to swap in your data, copy into pitch decks or integrate into dashboards—no macros or complex code required.
Customers Bargaining Power

Large utility and corporate offtakers
Buyers are predominantly sophisticated utilities, governments and blue-chip corporates that run competitive tenders—often for 50+ MW projects—and push hard on pricing; as of 2024 many counterparties remain investment-grade. Their scale and repeat tendering give them strong negotiating leverage, driving 10–20 year PPAs with buyer-favourable clauses. Contract language on curtailment and penalties typically skews toward buyers, compressing margins for suppliers like Sembcorp.
Auctions and transparent tariffs
Renewable capacity is largely awarded via competitive auctions, compressing developer margins as bids in 2023–24 recorded lows around $10–30/MWh in some markets. Transparent tariffs raise price discovery and cut information asymmetry, while non-price criteria (grid readiness, financing) partly differentiate offers. Despite this, price typically decides awards, making buyers—offtakers and governments—structurally more powerful.

Switching costs tempered by long-term PPAs
Once signed, long-term PPAs (typically 10–25 years) lock in volume and price for Sembcorp projects, materially lowering churn and stabilizing cashflows. Pre-award, buyers can switch easily among bidders, giving high ex-ante bargaining power. Contract renegotiations are rare but can occur on regulatory change, leaving buyer power moderate ex-post.

Demand for green attributes and flexibility
Buyers increasingly demand renewable certificates and flexibility add-ons, using bundled storage and shaping services as negotiation levers; providers that deliver ESG reporting can command price premia, while where alternatives exist buyers push for value-added with minimal uplift.
- Renewable certificates
- Storage bundling
- ESG reporting premia
- Price pressure where alternatives exist
Cross-border and multi-site portfolios
Multinational customers increasingly demand standardized, cross-border portfolio PPAs, using aggregated volumes to secure step-down pricing and tougher commercial terms; suppliers lacking matched footprints often concede on price or scope. This scale dynamic amplifies buyer leverage against developers such as Sembcorp, whose renewables capacity was about 2.6 GW in 2024.
- Portfolio PPAs preferred by corporates
- Volume = stronger price/term leverage
- Non-matching suppliers concede on price/scope
- Scale amplifies buyer power; Sembcorp ~2.6 GW (2024)
Auctions push bids to $10–30/MWh; buyers lock 10–25yr PPAs
Buyers—mainly utilities, governments and blue-chip corporates—hold strong leverage through large, repeat tenders and tight pricing, driving buyer-favourable 10–25 year PPAs and compressing supplier margins. Competitive auctions in 2023–24 pushed bids as low as $10–30/MWh, increasing price sensitivity; non-price criteria only partially offset this. Multinational portfolio PPAs and demand for certificates, storage and ESG reporting further strengthen buyer bargaining power versus Sembcorp (≈2.6 GW renewables, 2024).
| Metric | Buyer Power Effect | 2023–24 Data |
|---|---|---|
| Average auction bids | Compress margins | $10–30/MWh |
| PPA length | Locks terms | 10–25 yrs |
| Sembcorp renewables | Supplier scale | ≈2.6 GW (2024) |
Full Version Awaits
Sembcorp Industries Porter's Five Forces Analysis
This preview shows the exact Sembcorp Industries Porter’s Five Forces analysis you'll receive immediately after purchase—no surprises, no placeholders. It covers competitive rivalry, supplier and buyer power, threats of new entrants and substitutes, and strategic implications. The document is fully formatted, professionally written, and ready for instant download and use.

Go Beyond the Preview—Access the Full Strategic Report
Sembcorp Industries faces moderate buyer power, variable supplier leverage across energy and utilities, and evolving threat from renewable-focused new entrants and substitutes; competitive rivalry hinges on scale and regulatory positioning. This brief snapshot only scratches the surface. Unlock the full Porter's Five Forces Analysis to explore Sembcorp’s competitive dynamics and strategic implications in detail.
Suppliers Bargaining Power
Concentrated fuel and equipment sources
Concentrated gas suppliers in Sembcorp’s key markets and dominant OEMs for turbines, panels and inverters raise switching costs and delivery risk, giving suppliers moderate-to-high leverage on price and contract terms. Long-term gas contracts and qualified vendor lists partially mitigate price volatility and availability shocks. Persistent supply-chain bottlenecks for grid equipment and transformers can extend project timelines and increase capital lock-up.
Commodity price volatility pass-through
Power of suppliers rises when commodity inputs spike and escalation clauses are limited; for Sembcorp this is acute as module and battery swings drive capex and IRR sensitivity. Battery pack prices averaged about 132 USD/kWh in 2023 (BNEF), limiting pass-through if tariffs or hedges lag. Regulated tariff mechanisms and hedging can transfer costs but timing gaps create margin squeeze. Supplier leverage tightens in markets with long lead times and constrained supply.
EPC and balance-of-plant capacity constraints
In 2024 limited qualified EPC contractors in key jurisdictions allow bidders to push up prices, especially for complex balance-of-plant works, giving suppliers episodic bargaining power. Execution risk on multi-country pipelines increases Sembcorp's dependence on a narrow set of partners, raising schedule and cost exposure. Dual-sourcing and frame agreements mitigate but cannot replace scarce site-specific capabilities.
Grid connection and land access as quasi-suppliers
Transmission operators and land banks act as quasi-suppliers for Sembcorp, creating bottlenecks where queue positions, connection charges and land permits materially affect project timelines and IRR, with reported grid connection waits often in the range of 12–24 months and connection fees forming a noticeable share of upfront capex.
- Queue delays: 12–24 months
- Connection fees: significant share of capex
- Prime-node scarcity: lifts land premiums and project costs
Financing and tax equity availability
Capital providers set covenants and pricing that materially shape Sembcorp project economics; in 2024 lenders continued to demand tighter debt-service covenants and pricing spreads roughly 50–150bp above pre-2022 levels, and tax-equity pools remain constrained in key markets. Strong sponsor reputation can trim spreads but not remove cyclicality, as lenders’ bargaining power spikes in risk-off periods.
- 2024 YTD global green bond issuance ~150bn (H1)
- Debt spreads +50–150bp vs pre-2022
- Tax-equity scarcity increases financing rigidity
Concentrated gas, OEM dominance elevate supplier leverage; debt spreads +50-150bp squeeze IRR
Concentrated gas and dominant OEMs keep supplier leverage moderate-to-high, raising switching costs and price risk. Long-term contracts, qualified vendors and frame agreements partially cushion shocks but scarce EPCs, grid delays and land scarcity lift capex and schedule exposure. Financing tightened in 2024 (debt spreads +50–150bp), compressing IRR during input price spikes.
| Metric | 2024 figure | Impact |
|---|---|---|
| Battery price (BNEF) | ~132 USD/kWh (2023) | Capex sensitivity |
| Green bond H1 | ~150bn USD | liquidity pool |
| Queue delays | 12–24 months | timeline risk |
| Debt spread | +50–150bp vs pre-2022 | higher financing cost |
What is included in the product
Detailed Word Document
Tailored Porter's Five Forces analysis for Sembcorp Industries revealing competitive intensity, supplier and buyer power, barriers deterring new entrants, and threat of substitutes; highlights disruptive technologies and regulatory risks shaping profitability.
Customizable Excel Spreadsheet
Clear one-sheet summary of Sembcorp Industries' Porter's Five Forces for quick strategic decisions; customizable pressure levels and spider-chart visualization make it easy to swap in your data, copy into pitch decks or integrate into dashboards—no macros or complex code required.
Customers Bargaining Power
Large utility and corporate offtakers
Buyers are predominantly sophisticated utilities, governments and blue-chip corporates that run competitive tenders—often for 50+ MW projects—and push hard on pricing; as of 2024 many counterparties remain investment-grade. Their scale and repeat tendering give them strong negotiating leverage, driving 10–20 year PPAs with buyer-favourable clauses. Contract language on curtailment and penalties typically skews toward buyers, compressing margins for suppliers like Sembcorp.
Auctions and transparent tariffs
Renewable capacity is largely awarded via competitive auctions, compressing developer margins as bids in 2023–24 recorded lows around $10–30/MWh in some markets. Transparent tariffs raise price discovery and cut information asymmetry, while non-price criteria (grid readiness, financing) partly differentiate offers. Despite this, price typically decides awards, making buyers—offtakers and governments—structurally more powerful.
Switching costs tempered by long-term PPAs
Once signed, long-term PPAs (typically 10–25 years) lock in volume and price for Sembcorp projects, materially lowering churn and stabilizing cashflows. Pre-award, buyers can switch easily among bidders, giving high ex-ante bargaining power. Contract renegotiations are rare but can occur on regulatory change, leaving buyer power moderate ex-post.
Demand for green attributes and flexibility
Buyers increasingly demand renewable certificates and flexibility add-ons, using bundled storage and shaping services as negotiation levers; providers that deliver ESG reporting can command price premia, while where alternatives exist buyers push for value-added with minimal uplift.
- Renewable certificates
- Storage bundling
- ESG reporting premia
- Price pressure where alternatives exist
Cross-border and multi-site portfolios
Multinational customers increasingly demand standardized, cross-border portfolio PPAs, using aggregated volumes to secure step-down pricing and tougher commercial terms; suppliers lacking matched footprints often concede on price or scope. This scale dynamic amplifies buyer leverage against developers such as Sembcorp, whose renewables capacity was about 2.6 GW in 2024.
- Portfolio PPAs preferred by corporates
- Volume = stronger price/term leverage
- Non-matching suppliers concede on price/scope
- Scale amplifies buyer power; Sembcorp ~2.6 GW (2024)
Auctions push bids to $10–30/MWh; buyers lock 10–25yr PPAs
Buyers—mainly utilities, governments and blue-chip corporates—hold strong leverage through large, repeat tenders and tight pricing, driving buyer-favourable 10–25 year PPAs and compressing supplier margins. Competitive auctions in 2023–24 pushed bids as low as $10–30/MWh, increasing price sensitivity; non-price criteria only partially offset this. Multinational portfolio PPAs and demand for certificates, storage and ESG reporting further strengthen buyer bargaining power versus Sembcorp (≈2.6 GW renewables, 2024).
| Metric | Buyer Power Effect | 2023–24 Data |
|---|---|---|
| Average auction bids | Compress margins | $10–30/MWh |
| PPA length | Locks terms | 10–25 yrs |
| Sembcorp renewables | Supplier scale | ≈2.6 GW (2024) |
Full Version Awaits
Sembcorp Industries Porter's Five Forces Analysis
This preview shows the exact Sembcorp Industries Porter’s Five Forces analysis you'll receive immediately after purchase—no surprises, no placeholders. It covers competitive rivalry, supplier and buyer power, threats of new entrants and substitutes, and strategic implications. The document is fully formatted, professionally written, and ready for instant download and use.
Description
Go Beyond the Preview—Access the Full Strategic Report
Sembcorp Industries faces moderate buyer power, variable supplier leverage across energy and utilities, and evolving threat from renewable-focused new entrants and substitutes; competitive rivalry hinges on scale and regulatory positioning. This brief snapshot only scratches the surface. Unlock the full Porter's Five Forces Analysis to explore Sembcorp’s competitive dynamics and strategic implications in detail.
Suppliers Bargaining Power
Concentrated fuel and equipment sources
Concentrated gas suppliers in Sembcorp’s key markets and dominant OEMs for turbines, panels and inverters raise switching costs and delivery risk, giving suppliers moderate-to-high leverage on price and contract terms. Long-term gas contracts and qualified vendor lists partially mitigate price volatility and availability shocks. Persistent supply-chain bottlenecks for grid equipment and transformers can extend project timelines and increase capital lock-up.
Commodity price volatility pass-through
Power of suppliers rises when commodity inputs spike and escalation clauses are limited; for Sembcorp this is acute as module and battery swings drive capex and IRR sensitivity. Battery pack prices averaged about 132 USD/kWh in 2023 (BNEF), limiting pass-through if tariffs or hedges lag. Regulated tariff mechanisms and hedging can transfer costs but timing gaps create margin squeeze. Supplier leverage tightens in markets with long lead times and constrained supply.
EPC and balance-of-plant capacity constraints
In 2024 limited qualified EPC contractors in key jurisdictions allow bidders to push up prices, especially for complex balance-of-plant works, giving suppliers episodic bargaining power. Execution risk on multi-country pipelines increases Sembcorp's dependence on a narrow set of partners, raising schedule and cost exposure. Dual-sourcing and frame agreements mitigate but cannot replace scarce site-specific capabilities.
Grid connection and land access as quasi-suppliers
Transmission operators and land banks act as quasi-suppliers for Sembcorp, creating bottlenecks where queue positions, connection charges and land permits materially affect project timelines and IRR, with reported grid connection waits often in the range of 12–24 months and connection fees forming a noticeable share of upfront capex.
- Queue delays: 12–24 months
- Connection fees: significant share of capex
- Prime-node scarcity: lifts land premiums and project costs
Financing and tax equity availability
Capital providers set covenants and pricing that materially shape Sembcorp project economics; in 2024 lenders continued to demand tighter debt-service covenants and pricing spreads roughly 50–150bp above pre-2022 levels, and tax-equity pools remain constrained in key markets. Strong sponsor reputation can trim spreads but not remove cyclicality, as lenders’ bargaining power spikes in risk-off periods.
- 2024 YTD global green bond issuance ~150bn (H1)
- Debt spreads +50–150bp vs pre-2022
- Tax-equity scarcity increases financing rigidity
Concentrated gas, OEM dominance elevate supplier leverage; debt spreads +50-150bp squeeze IRR
Concentrated gas and dominant OEMs keep supplier leverage moderate-to-high, raising switching costs and price risk. Long-term contracts, qualified vendors and frame agreements partially cushion shocks but scarce EPCs, grid delays and land scarcity lift capex and schedule exposure. Financing tightened in 2024 (debt spreads +50–150bp), compressing IRR during input price spikes.
| Metric | 2024 figure | Impact |
|---|---|---|
| Battery price (BNEF) | ~132 USD/kWh (2023) | Capex sensitivity |
| Green bond H1 | ~150bn USD | liquidity pool |
| Queue delays | 12–24 months | timeline risk |
| Debt spread | +50–150bp vs pre-2022 | higher financing cost |
What is included in the product
Detailed Word Document
Tailored Porter's Five Forces analysis for Sembcorp Industries revealing competitive intensity, supplier and buyer power, barriers deterring new entrants, and threat of substitutes; highlights disruptive technologies and regulatory risks shaping profitability.
Customizable Excel Spreadsheet
Clear one-sheet summary of Sembcorp Industries' Porter's Five Forces for quick strategic decisions; customizable pressure levels and spider-chart visualization make it easy to swap in your data, copy into pitch decks or integrate into dashboards—no macros or complex code required.
Customers Bargaining Power
Large utility and corporate offtakers
Buyers are predominantly sophisticated utilities, governments and blue-chip corporates that run competitive tenders—often for 50+ MW projects—and push hard on pricing; as of 2024 many counterparties remain investment-grade. Their scale and repeat tendering give them strong negotiating leverage, driving 10–20 year PPAs with buyer-favourable clauses. Contract language on curtailment and penalties typically skews toward buyers, compressing margins for suppliers like Sembcorp.
Auctions and transparent tariffs
Renewable capacity is largely awarded via competitive auctions, compressing developer margins as bids in 2023–24 recorded lows around $10–30/MWh in some markets. Transparent tariffs raise price discovery and cut information asymmetry, while non-price criteria (grid readiness, financing) partly differentiate offers. Despite this, price typically decides awards, making buyers—offtakers and governments—structurally more powerful.
Switching costs tempered by long-term PPAs
Once signed, long-term PPAs (typically 10–25 years) lock in volume and price for Sembcorp projects, materially lowering churn and stabilizing cashflows. Pre-award, buyers can switch easily among bidders, giving high ex-ante bargaining power. Contract renegotiations are rare but can occur on regulatory change, leaving buyer power moderate ex-post.
Demand for green attributes and flexibility
Buyers increasingly demand renewable certificates and flexibility add-ons, using bundled storage and shaping services as negotiation levers; providers that deliver ESG reporting can command price premia, while where alternatives exist buyers push for value-added with minimal uplift.
- Renewable certificates
- Storage bundling
- ESG reporting premia
- Price pressure where alternatives exist
Cross-border and multi-site portfolios
Multinational customers increasingly demand standardized, cross-border portfolio PPAs, using aggregated volumes to secure step-down pricing and tougher commercial terms; suppliers lacking matched footprints often concede on price or scope. This scale dynamic amplifies buyer leverage against developers such as Sembcorp, whose renewables capacity was about 2.6 GW in 2024.
- Portfolio PPAs preferred by corporates
- Volume = stronger price/term leverage
- Non-matching suppliers concede on price/scope
- Scale amplifies buyer power; Sembcorp ~2.6 GW (2024)
Auctions push bids to $10–30/MWh; buyers lock 10–25yr PPAs
Buyers—mainly utilities, governments and blue-chip corporates—hold strong leverage through large, repeat tenders and tight pricing, driving buyer-favourable 10–25 year PPAs and compressing supplier margins. Competitive auctions in 2023–24 pushed bids as low as $10–30/MWh, increasing price sensitivity; non-price criteria only partially offset this. Multinational portfolio PPAs and demand for certificates, storage and ESG reporting further strengthen buyer bargaining power versus Sembcorp (≈2.6 GW renewables, 2024).
| Metric | Buyer Power Effect | 2023–24 Data |
|---|---|---|
| Average auction bids | Compress margins | $10–30/MWh |
| PPA length | Locks terms | 10–25 yrs |
| Sembcorp renewables | Supplier scale | ≈2.6 GW (2024) |
Full Version Awaits
Sembcorp Industries Porter's Five Forces Analysis
This preview shows the exact Sembcorp Industries Porter’s Five Forces analysis you'll receive immediately after purchase—no surprises, no placeholders. It covers competitive rivalry, supplier and buyer power, threats of new entrants and substitutes, and strategic implications. The document is fully formatted, professionally written, and ready for instant download and use.











