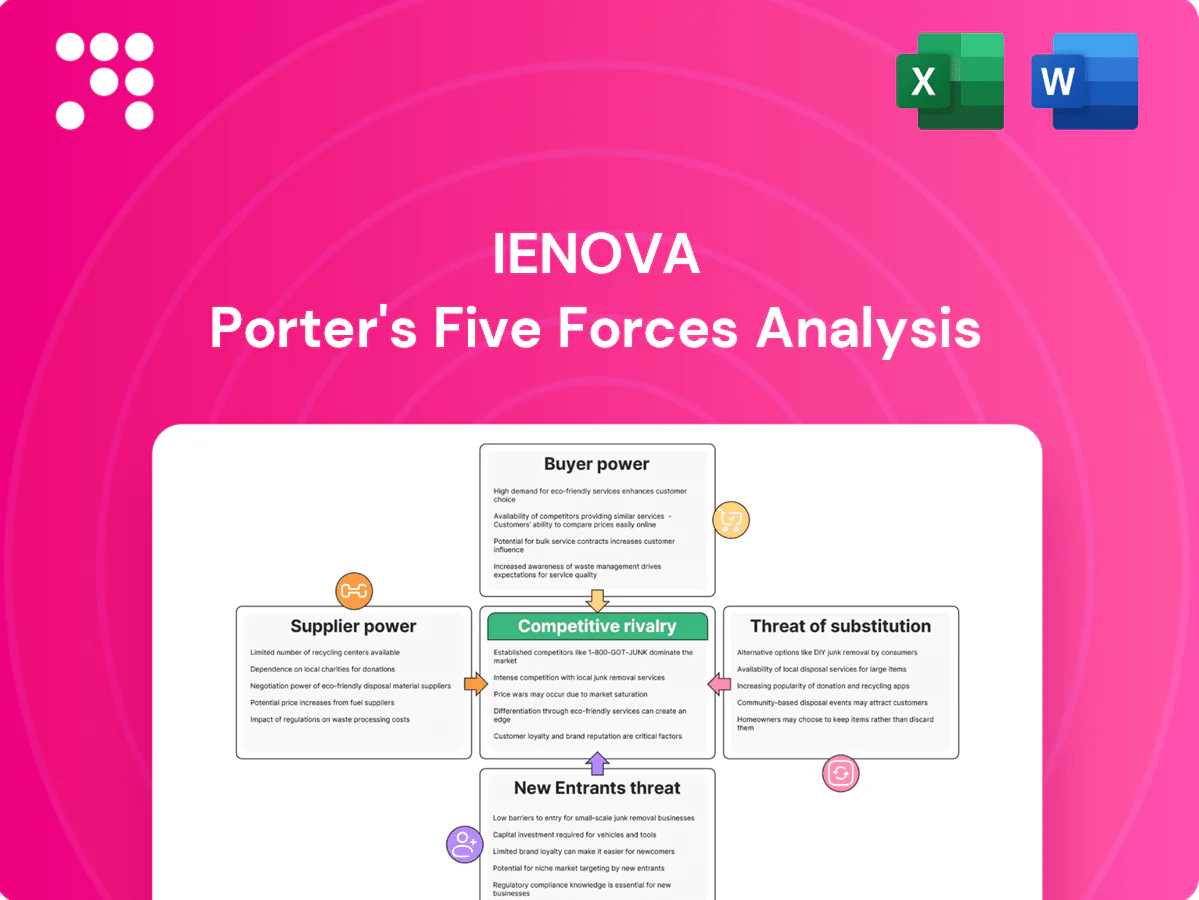
IEnova Porter's Five Forces Analysis

Don't Miss the Bigger Picture
This snapshot highlights IEnova’s competitive pressures—supplier influence, regulatory risk, buyer power, substitute threats and rivalry—framing core strategic challenges. It surfaces implications for margins, investment and growth but lacks force-by-force depth. Unlock the full Porter's Five Forces Analysis to explore IEnova’s competitive dynamics, market pressures, and strategic advantages in detail.
Suppliers Bargaining Power

Concentrated gas producers and LNG suppliers
IEnova relied on a limited set of upstream gas producers and LNG counterparties, often tied to long-term, indexed or take-or-pay contracts, so supplier concentration raises switching costs and exposure to price pass-through. As of 2024, take-or-pay and indexed terms helped stabilize margins, while Sempra Infraestructura’s portfolio aggregation modestly offsets supplier leverage.
Specialized EPC and steel pipe vendors
Pipeline-grade steel, compressors and EPC services are highly specialized, limiting vendor options. As of 2024, lead times for pipeline steel and large compressors commonly range 6–12 months, increasing dependence on qualified suppliers. Cost inflation or delivery delays can cascade into contractual penalties or offtaker claims on revenues. Framework agreements and dual‑sourcing mitigate exposure but do not eliminate single‑source technical risk.

Grid interconnection and land rights
Access to transmission nodes, rights-of-way and permits act as suppliers of critical inputs for IEnova; constrained corridors have been shown to increase landholder and agency leverage, sometimes adding 5–15% to project capex and causing 6–12 month schedule slippages. Negotiation frictions raise costs through compensation, mitigation and legal fees, while proactive community engagement and early permitting strategies can materially rebalance bargaining power and reduce delay risk.

Refined product supply and terminal logistics
Terminals rely on stable throughput from refiners and importers, notably state-linked PEMEX in 2024, giving suppliers strong leverage when alternate supply corridors are limited. Contractual minimums and storage fees mitigate short-term volume swings but lock terminals into counterparty terms. Operational reliability is critical to retain anchor suppliers and avoid volume loss.
- Dependence on PEMEX and major importers increases supplier bargaining power
- Limited alternate sources raise counterparty leverage
- Minimum off-take clauses and storage fees cushion volatility
- High uptime essential to keep anchor contracts
OEMs for renewable components
OEMs for wind turbines, inverters and utility-scale solar modules remain concentrated (Vestas/Siemens Gamesa/GE and major PV/inverter groups), giving suppliers leverage via 6–12 month lead times and warranty terms; global supply shocks have in recent cycles pushed capex spikes up to ~20% and delayed COD, while procurement under Sempra/Sempra Energy can pool demand to improve pricing and availability.
- Concentration: top OEMs dominate supply
- Lead times: 6–12 months (2024)
- Capex risk: supply shocks can raise costs ~20%
- Sempra procurement: improves volume pricing
Upstream take-or-pay, OEM lead times and permitting raise capex and delay projects
IEnova faces concentrated upstream suppliers (PEMEX/majors) with take‑or‑pay terms stabilizing margins; OEMs (Vestas/Siemens/GE) drive 6–12m lead times and ~20% capex spike risk; ROW/permitting added 5–15% capex and 6–12m delays in 2024; Sempra procurement partially reduces unit costs and improves availability.
| Supplier Type | 2024 Indicator | Impact |
|---|---|---|
| Upstream gas | PEMEX/majors, take‑or‑pay | High price pass‑through |
| OEMs | 6–12m lead time, ~20% capex spike | Schedule & cost risk |
| Permitting | 5–15% capex, 6–12m delays | Execution risk |
What is included in the product
 Detailed Word Document
Tailored exclusively for IEnova, this Porter's Five Forces analysis uncovers key drivers of competition, supplier and buyer power, threats from entrants and substitutes, and disruptive forces challenging market share, with strategic commentary for investors and internal strategy use.

 Customizable Excel Spreadsheet
A concise, one-sheet Porter's Five Forces for IEnova—instantly visualizes competitive pressure with a radar chart and customizable scores to reflect regulation, LNG/energy market shifts, and new entrants. Clean layout, no complex code, and easy integration into decks or dashboards for faster strategic decisions.
Customers Bargaining Power

Utility and industrial offtakers
Large CFE-linked entities and blue-chip industrial offtakers are highly price-sensitive and sophisticated, using scale and credit strength to extract better gas and power tariff terms. Long-term take-or-pay contracts (typically 10–20 years) reduce day-to-day price haggling but lock IEnova into fixed tariff structures. Creditworthy anchors improve project bankability yet demand higher service levels and contractual protections. Their negotiating leverage shapes tariff resets and capacity allocation.
Regulated tariff frameworks
Regulatory oversight by Mexico’s Comisión Reguladora de Energía (CRE) in 2024 caps returns and limits pricing flexibility for IEnova’s customers, constraining upside for operators. Transparent, formulaic tariff methodologies provide buyers predictability and stronger bargaining footing. Periodic CRE reviews expose operators to downward tariff pressure, while compliance and performance metrics are routinely used by buyers as negotiation chips.

Optionality from multiple interconnections
Where networks interconnect, buyers can diversify routes and suppliers, and as of 2024 IEnova maintains cross-border interconnections with US markets that increase such optionality.
Greater optionality heightens buyer bargaining power at contract renewal, pressuring tariffs and service terms.
In less connected regions IEnova’s entrenched assets temper buyer leverage, while network design and capacity allocation ultimately shape the balance.

Fuel-switching customers
Industrial clients can switch among gas, LPG, fuel oil or power when relative prices shift, creating latent substitutability that strengthens buyer leverage for lower tariffs and flexible terms; immediate switching is limited by firm capacity contracts and reliability needs, especially for continuous-process plants. Value-added services such as guaranteed availability, balancing and bundled logistics reduce defection risk.
- Buyer leverage from fuel substitutability
- Firm-capacity and reliability constraints
- Value-added services lower churn
Terminal users with storage flexibility
Terminal users with storage flexibility can shift refined-product volumes rapidly to capture arbitrage, with intra-regional spreads in 2024 averaging around $0.08–0.12 per gallon, allowing marketers to move volumes within days and exert downward pressure on handling fees during slack demand.
- Storage optionality reduced effective fees by up to 15% in low-utilization months
- Priority access and blending services increase customer stickiness
- Multi-year throughput commitments covering 50–70% of capacity rebalance power toward the operator
Scale, storage spreads and US interconnects sharpen buyer leverage on long-term gas contracts
Large CFE-linked and blue-chip buyers use scale and credit to press tariffs despite IEnova’s 10–20 yr take-or-pay contracts; CRE 2024 reviews cap upside and boost buyer predictability. Cross-border interconnects to US (2024) raise supplier optionality; storage spreads of $0.08–0.12/gal and up to 15% fee erosion increase bargaining power.
| Metric | 2024 |
|---|---|
| Contract length | 10–20 yrs |
| Storage spread | $0.08–0.12/gal |
| Fee reduction | up to 15% |
Full Version Awaits
IEnova Porter's Five Forces Analysis
This preview shows the exact IEnova Porter's Five Forces Analysis you'll receive—no placeholders or mockups. The report examines supplier power, buyer power, competitive rivalry, threat of substitutes, and barriers to entry with data-driven insights and strategic implications. After purchase you'll get this professionally formatted file instantly, ready for download and use.

Don't Miss the Bigger Picture
This snapshot highlights IEnova’s competitive pressures—supplier influence, regulatory risk, buyer power, substitute threats and rivalry—framing core strategic challenges. It surfaces implications for margins, investment and growth but lacks force-by-force depth. Unlock the full Porter's Five Forces Analysis to explore IEnova’s competitive dynamics, market pressures, and strategic advantages in detail.
Suppliers Bargaining Power
Concentrated gas producers and LNG suppliers
IEnova relied on a limited set of upstream gas producers and LNG counterparties, often tied to long-term, indexed or take-or-pay contracts, so supplier concentration raises switching costs and exposure to price pass-through. As of 2024, take-or-pay and indexed terms helped stabilize margins, while Sempra Infraestructura’s portfolio aggregation modestly offsets supplier leverage.
Specialized EPC and steel pipe vendors
Pipeline-grade steel, compressors and EPC services are highly specialized, limiting vendor options. As of 2024, lead times for pipeline steel and large compressors commonly range 6–12 months, increasing dependence on qualified suppliers. Cost inflation or delivery delays can cascade into contractual penalties or offtaker claims on revenues. Framework agreements and dual‑sourcing mitigate exposure but do not eliminate single‑source technical risk.
Grid interconnection and land rights
Access to transmission nodes, rights-of-way and permits act as suppliers of critical inputs for IEnova; constrained corridors have been shown to increase landholder and agency leverage, sometimes adding 5–15% to project capex and causing 6–12 month schedule slippages. Negotiation frictions raise costs through compensation, mitigation and legal fees, while proactive community engagement and early permitting strategies can materially rebalance bargaining power and reduce delay risk.
Refined product supply and terminal logistics
Terminals rely on stable throughput from refiners and importers, notably state-linked PEMEX in 2024, giving suppliers strong leverage when alternate supply corridors are limited. Contractual minimums and storage fees mitigate short-term volume swings but lock terminals into counterparty terms. Operational reliability is critical to retain anchor suppliers and avoid volume loss.
- Dependence on PEMEX and major importers increases supplier bargaining power
- Limited alternate sources raise counterparty leverage
- Minimum off-take clauses and storage fees cushion volatility
- High uptime essential to keep anchor contracts
OEMs for renewable components
OEMs for wind turbines, inverters and utility-scale solar modules remain concentrated (Vestas/Siemens Gamesa/GE and major PV/inverter groups), giving suppliers leverage via 6–12 month lead times and warranty terms; global supply shocks have in recent cycles pushed capex spikes up to ~20% and delayed COD, while procurement under Sempra/Sempra Energy can pool demand to improve pricing and availability.
- Concentration: top OEMs dominate supply
- Lead times: 6–12 months (2024)
- Capex risk: supply shocks can raise costs ~20%
- Sempra procurement: improves volume pricing
Upstream take-or-pay, OEM lead times and permitting raise capex and delay projects
IEnova faces concentrated upstream suppliers (PEMEX/majors) with take‑or‑pay terms stabilizing margins; OEMs (Vestas/Siemens/GE) drive 6–12m lead times and ~20% capex spike risk; ROW/permitting added 5–15% capex and 6–12m delays in 2024; Sempra procurement partially reduces unit costs and improves availability.
| Supplier Type | 2024 Indicator | Impact |
|---|---|---|
| Upstream gas | PEMEX/majors, take‑or‑pay | High price pass‑through |
| OEMs | 6–12m lead time, ~20% capex spike | Schedule & cost risk |
| Permitting | 5–15% capex, 6–12m delays | Execution risk |
What is included in the product
Detailed Word Document
Tailored exclusively for IEnova, this Porter's Five Forces analysis uncovers key drivers of competition, supplier and buyer power, threats from entrants and substitutes, and disruptive forces challenging market share, with strategic commentary for investors and internal strategy use.
Customizable Excel Spreadsheet
A concise, one-sheet Porter's Five Forces for IEnova—instantly visualizes competitive pressure with a radar chart and customizable scores to reflect regulation, LNG/energy market shifts, and new entrants. Clean layout, no complex code, and easy integration into decks or dashboards for faster strategic decisions.
Customers Bargaining Power
Utility and industrial offtakers
Large CFE-linked entities and blue-chip industrial offtakers are highly price-sensitive and sophisticated, using scale and credit strength to extract better gas and power tariff terms. Long-term take-or-pay contracts (typically 10–20 years) reduce day-to-day price haggling but lock IEnova into fixed tariff structures. Creditworthy anchors improve project bankability yet demand higher service levels and contractual protections. Their negotiating leverage shapes tariff resets and capacity allocation.
Regulated tariff frameworks
Regulatory oversight by Mexico’s Comisión Reguladora de Energía (CRE) in 2024 caps returns and limits pricing flexibility for IEnova’s customers, constraining upside for operators. Transparent, formulaic tariff methodologies provide buyers predictability and stronger bargaining footing. Periodic CRE reviews expose operators to downward tariff pressure, while compliance and performance metrics are routinely used by buyers as negotiation chips.
Optionality from multiple interconnections
Where networks interconnect, buyers can diversify routes and suppliers, and as of 2024 IEnova maintains cross-border interconnections with US markets that increase such optionality.
Greater optionality heightens buyer bargaining power at contract renewal, pressuring tariffs and service terms.
In less connected regions IEnova’s entrenched assets temper buyer leverage, while network design and capacity allocation ultimately shape the balance.
Fuel-switching customers
Industrial clients can switch among gas, LPG, fuel oil or power when relative prices shift, creating latent substitutability that strengthens buyer leverage for lower tariffs and flexible terms; immediate switching is limited by firm capacity contracts and reliability needs, especially for continuous-process plants. Value-added services such as guaranteed availability, balancing and bundled logistics reduce defection risk.
- Buyer leverage from fuel substitutability
- Firm-capacity and reliability constraints
- Value-added services lower churn
Terminal users with storage flexibility
Terminal users with storage flexibility can shift refined-product volumes rapidly to capture arbitrage, with intra-regional spreads in 2024 averaging around $0.08–0.12 per gallon, allowing marketers to move volumes within days and exert downward pressure on handling fees during slack demand.
- Storage optionality reduced effective fees by up to 15% in low-utilization months
- Priority access and blending services increase customer stickiness
- Multi-year throughput commitments covering 50–70% of capacity rebalance power toward the operator
Scale, storage spreads and US interconnects sharpen buyer leverage on long-term gas contracts
Large CFE-linked and blue-chip buyers use scale and credit to press tariffs despite IEnova’s 10–20 yr take-or-pay contracts; CRE 2024 reviews cap upside and boost buyer predictability. Cross-border interconnects to US (2024) raise supplier optionality; storage spreads of $0.08–0.12/gal and up to 15% fee erosion increase bargaining power.
| Metric | 2024 |
|---|---|
| Contract length | 10–20 yrs |
| Storage spread | $0.08–0.12/gal |
| Fee reduction | up to 15% |
Full Version Awaits
IEnova Porter's Five Forces Analysis
This preview shows the exact IEnova Porter's Five Forces Analysis you'll receive—no placeholders or mockups. The report examines supplier power, buyer power, competitive rivalry, threat of substitutes, and barriers to entry with data-driven insights and strategic implications. After purchase you'll get this professionally formatted file instantly, ready for download and use.
Original: $10.00
-65%$10.00
$3.50Description
Don't Miss the Bigger Picture
This snapshot highlights IEnova’s competitive pressures—supplier influence, regulatory risk, buyer power, substitute threats and rivalry—framing core strategic challenges. It surfaces implications for margins, investment and growth but lacks force-by-force depth. Unlock the full Porter's Five Forces Analysis to explore IEnova’s competitive dynamics, market pressures, and strategic advantages in detail.
Suppliers Bargaining Power
Concentrated gas producers and LNG suppliers
IEnova relied on a limited set of upstream gas producers and LNG counterparties, often tied to long-term, indexed or take-or-pay contracts, so supplier concentration raises switching costs and exposure to price pass-through. As of 2024, take-or-pay and indexed terms helped stabilize margins, while Sempra Infraestructura’s portfolio aggregation modestly offsets supplier leverage.
Specialized EPC and steel pipe vendors
Pipeline-grade steel, compressors and EPC services are highly specialized, limiting vendor options. As of 2024, lead times for pipeline steel and large compressors commonly range 6–12 months, increasing dependence on qualified suppliers. Cost inflation or delivery delays can cascade into contractual penalties or offtaker claims on revenues. Framework agreements and dual‑sourcing mitigate exposure but do not eliminate single‑source technical risk.
Grid interconnection and land rights
Access to transmission nodes, rights-of-way and permits act as suppliers of critical inputs for IEnova; constrained corridors have been shown to increase landholder and agency leverage, sometimes adding 5–15% to project capex and causing 6–12 month schedule slippages. Negotiation frictions raise costs through compensation, mitigation and legal fees, while proactive community engagement and early permitting strategies can materially rebalance bargaining power and reduce delay risk.
Refined product supply and terminal logistics
Terminals rely on stable throughput from refiners and importers, notably state-linked PEMEX in 2024, giving suppliers strong leverage when alternate supply corridors are limited. Contractual minimums and storage fees mitigate short-term volume swings but lock terminals into counterparty terms. Operational reliability is critical to retain anchor suppliers and avoid volume loss.
- Dependence on PEMEX and major importers increases supplier bargaining power
- Limited alternate sources raise counterparty leverage
- Minimum off-take clauses and storage fees cushion volatility
- High uptime essential to keep anchor contracts
OEMs for renewable components
OEMs for wind turbines, inverters and utility-scale solar modules remain concentrated (Vestas/Siemens Gamesa/GE and major PV/inverter groups), giving suppliers leverage via 6–12 month lead times and warranty terms; global supply shocks have in recent cycles pushed capex spikes up to ~20% and delayed COD, while procurement under Sempra/Sempra Energy can pool demand to improve pricing and availability.
- Concentration: top OEMs dominate supply
- Lead times: 6–12 months (2024)
- Capex risk: supply shocks can raise costs ~20%
- Sempra procurement: improves volume pricing
Upstream take-or-pay, OEM lead times and permitting raise capex and delay projects
IEnova faces concentrated upstream suppliers (PEMEX/majors) with take‑or‑pay terms stabilizing margins; OEMs (Vestas/Siemens/GE) drive 6–12m lead times and ~20% capex spike risk; ROW/permitting added 5–15% capex and 6–12m delays in 2024; Sempra procurement partially reduces unit costs and improves availability.
| Supplier Type | 2024 Indicator | Impact |
|---|---|---|
| Upstream gas | PEMEX/majors, take‑or‑pay | High price pass‑through |
| OEMs | 6–12m lead time, ~20% capex spike | Schedule & cost risk |
| Permitting | 5–15% capex, 6–12m delays | Execution risk |
What is included in the product
Detailed Word Document
Tailored exclusively for IEnova, this Porter's Five Forces analysis uncovers key drivers of competition, supplier and buyer power, threats from entrants and substitutes, and disruptive forces challenging market share, with strategic commentary for investors and internal strategy use.
Customizable Excel Spreadsheet
A concise, one-sheet Porter's Five Forces for IEnova—instantly visualizes competitive pressure with a radar chart and customizable scores to reflect regulation, LNG/energy market shifts, and new entrants. Clean layout, no complex code, and easy integration into decks or dashboards for faster strategic decisions.
Customers Bargaining Power
Utility and industrial offtakers
Large CFE-linked entities and blue-chip industrial offtakers are highly price-sensitive and sophisticated, using scale and credit strength to extract better gas and power tariff terms. Long-term take-or-pay contracts (typically 10–20 years) reduce day-to-day price haggling but lock IEnova into fixed tariff structures. Creditworthy anchors improve project bankability yet demand higher service levels and contractual protections. Their negotiating leverage shapes tariff resets and capacity allocation.
Regulated tariff frameworks
Regulatory oversight by Mexico’s Comisión Reguladora de Energía (CRE) in 2024 caps returns and limits pricing flexibility for IEnova’s customers, constraining upside for operators. Transparent, formulaic tariff methodologies provide buyers predictability and stronger bargaining footing. Periodic CRE reviews expose operators to downward tariff pressure, while compliance and performance metrics are routinely used by buyers as negotiation chips.
Optionality from multiple interconnections
Where networks interconnect, buyers can diversify routes and suppliers, and as of 2024 IEnova maintains cross-border interconnections with US markets that increase such optionality.
Greater optionality heightens buyer bargaining power at contract renewal, pressuring tariffs and service terms.
In less connected regions IEnova’s entrenched assets temper buyer leverage, while network design and capacity allocation ultimately shape the balance.
Fuel-switching customers
Industrial clients can switch among gas, LPG, fuel oil or power when relative prices shift, creating latent substitutability that strengthens buyer leverage for lower tariffs and flexible terms; immediate switching is limited by firm capacity contracts and reliability needs, especially for continuous-process plants. Value-added services such as guaranteed availability, balancing and bundled logistics reduce defection risk.
- Buyer leverage from fuel substitutability
- Firm-capacity and reliability constraints
- Value-added services lower churn
Terminal users with storage flexibility
Terminal users with storage flexibility can shift refined-product volumes rapidly to capture arbitrage, with intra-regional spreads in 2024 averaging around $0.08–0.12 per gallon, allowing marketers to move volumes within days and exert downward pressure on handling fees during slack demand.
- Storage optionality reduced effective fees by up to 15% in low-utilization months
- Priority access and blending services increase customer stickiness
- Multi-year throughput commitments covering 50–70% of capacity rebalance power toward the operator
Scale, storage spreads and US interconnects sharpen buyer leverage on long-term gas contracts
Large CFE-linked and blue-chip buyers use scale and credit to press tariffs despite IEnova’s 10–20 yr take-or-pay contracts; CRE 2024 reviews cap upside and boost buyer predictability. Cross-border interconnects to US (2024) raise supplier optionality; storage spreads of $0.08–0.12/gal and up to 15% fee erosion increase bargaining power.
| Metric | 2024 |
|---|---|
| Contract length | 10–20 yrs |
| Storage spread | $0.08–0.12/gal |
| Fee reduction | up to 15% |
Full Version Awaits
IEnova Porter's Five Forces Analysis
This preview shows the exact IEnova Porter's Five Forces Analysis you'll receive—no placeholders or mockups. The report examines supplier power, buyer power, competitive rivalry, threat of substitutes, and barriers to entry with data-driven insights and strategic implications. After purchase you'll get this professionally formatted file instantly, ready for download and use.











