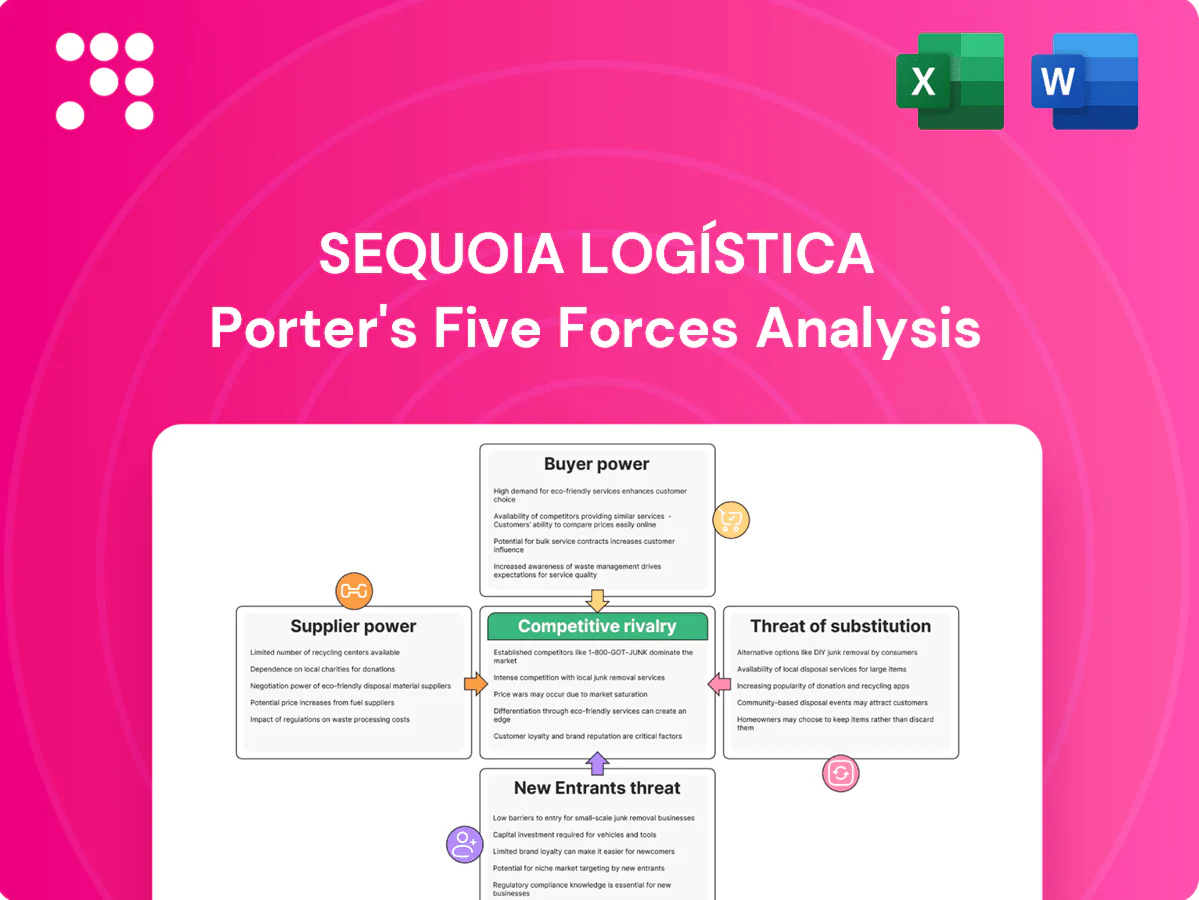
Sequoia Logística Porter's Five Forces Analysis

Don't Miss the Bigger Picture
Sequoia Logística faces intense competitive rivalry amid capacity-driven pricing and service differentiation, with supplier power moderate due to specialized equipment and buyer power rising as large shippers demand integrated solutions. Threat of new entrants is moderate given capital and network hurdles, while substitutes remain limited. This brief snapshot only scratches the surface—unlock the full Porter's Five Forces Analysis for detailed ratings, visuals, and strategic takeaways.
Suppliers Bargaining Power

Fuel and fleet providers influence costs
Diesel, gasoline suppliers, OEMs and leasing firms can swing operating costs via price and availability changes; ANP data showed average diesel around BRL 5.80/l in 2024, directly pressuring last-mile margins and feeding fuel surcharges. Long-term fuel and lease contracts often cover a large share of volumes and blunt spikes but do not eliminate exposure. Sequoia’s scale improves negotiating leverage, yet switching fleets or fuel arrangements involves fleet downtime, regulatory certification and leasing penalties.
Labor and contractor capacity tightness
Drivers, couriers and subcontracted 3PLs are critical inputs with variable availability; in 2024 peak-season day rates spiked as much as 30% on dense urban routes, boosting supplier power. Compliance, training and safety needs (certified-driver onboarding 4–8 weeks) limit rapid substitution, while balanced roster management and incentive schemes have cut volatility in pilots by ~15%.

Technology vendors and platforms
Route optimization, TMS/WMS and real-time tracking rely on software vendors and cloud providers (AWS ~32% market share in 2024), creating lock-in and integration complexity that raise switching costs; typical 99.95% uptime SLAs imply ~4.4 hours downtime/year as a negotiation lever. Cybersecurity stakes are high given average breach costs in the multi-million dollar range, while building in-house platforms cuts dependency but adds fixed costs often in the low- to mid-single-digit millions.

Real estate and micro-fulfillment landlords
Urban cross-docks, dark stores, and last-mile hubs are scarce in prime areas, pushing vacancy for urban logistics below 5% in many 2024 metros and allowing landlords to drive rents up, raising unit logistics costs. Long leases (often 5–10+ years) secure footprints but reduce operational flexibility, while multi-node network design spreads bargaining leverage across landlords and markets.
- Scarcity: prime urban vacancy <5% (2024)
- Rents: upward pressure in high-demand zones
- Lease terms: 5–10+ year commitments reduce flexibility
- Mitigation: multi-node networks dilute landlord power
Specialized equipment and parts
Specialized cold chain units, barcode scanners, automated sorting systems and OEM spare parts are sourced from a limited pool of global suppliers, with typical procurement lead times of 12–24 weeks and 2024 FX volatility (roughly 8–12% swings for emerging-market currencies) increasing cost and delivery risk.
Preventive maintenance programs and dual sourcing have cut scheduled downtime in comparable logistics operators by up to 15–20%, while standardizing equipment specs expands eligible vendors over time and reduces single‑supplier dependence.
- Limited supplier pool: cold chain, scanners, sorters, spare parts
- Procurement risk: 12–24 week lead times; 8–12% FX swings (2024)
- Mitigants: preventive maintenance; dual sourcing (15–20% downtime reduction)
- Strategy: standardize specs to broaden supplier base
Cost shocks: Diesel BRL 5.80/l, driver rates +30%, scarce urban sites
Suppliers exert moderate-to-high power: fuel (diesel ~BRL 5.80/l in 2024) and drivers (peak rates +30% in 2024; onboarding 4–8 weeks) directly raise costs; tech vendors (AWS ~32% share) and scarce urban sites (vacancy <5% in 2024) create lock-in. Procurement lead times 12–24 weeks and FX swings 8–12% increase risk; dual sourcing and scale cut exposure.
| Metric | 2024 |
|---|---|
| Diesel | BRL 5.80/l |
| Driver peak rate spike | +30% |
| Urban vacancy | <5% |
| AWS market share | ~32% |
| Lead times | 12–24 wks |
| FX volatility | 8–12% |
What is included in the product
 Detailed Word Document
Tailored Porter's Five Forces analysis for Sequoia Logística uncovering competitive rivalry, supplier and buyer power, entry barriers, and substitute threats, with strategic insights on disruptive trends and pricing leverage to guide investor and management decisions.

 Customizable Excel Spreadsheet
Clear one-sheet Porter's Five Forces for Sequoia Logística—instantly visualize competitive pressure with a customizable spider chart, swap in your data, adjust scenarios (pre/post regulation or new entrants) and export to decks or Word reports without macros for fast, boardroom-ready decision-making.
Customers Bargaining Power

Concentrated e-commerce giants
Large marketplaces and retailers in Brazil aggregate massive volumes and demand lower logistics rates, with the top five marketplaces accounting for over 60% of online GMV in recent market reports (2023–24), pressuring Sequoia on pricing. They impose strict SLAs, custom integrations and penalties that raise operating complexity and compliance costs. Their ability to multi-source logistics providers weakens Sequoia’s pricing power. Long-term contracts frequently trade 2–5 percentage points of margin for volume stability.
Low switching costs across 3PLs
Low switching costs are amplified by service comparability and API-enabled onboarding that cuts integration to days, making migration feasible; the global 3PL market was roughly $1.5 trillion in 2024, increasing buyer options. Customers benchmark primarily on price, speed and delivery success rates, driving tendering pressure. Regional carriers can replicate lanes quickly, raising buyer leverage. Differentiation via reliability and real-time visibility increases stickiness.

Seasonality and demand volatility
Peak events shift bargaining as clients pre-book capacity, with peak-week bookings often rising 20–35% in 2024, tightening supply and favoring carriers. Buyers with stable baseline volumes secure ~5–15% better year-round rates via volume contracts. Surge pricing is capped by competitive alternatives; forecast-accuracy programs commonly trade 3–8% discounts for predictable volumes.

Customization and integration demands
Clients increasingly demand tailored reverse logistics, bespoke packaging, and integrated omnichannel flows, driving operational complexity; e-commerce return rates averaged about 20% in 2024, amplifying reverse-logistics volume. Custom work raises cost-to-serve and gives buyers leverage to push scope creep and concessions, so clear catalogs and modular solutions are essential to protect margins.
- Tailored reverse logistics
- Omnichannel integration
- Scope creep pressure
- Modular catalogs protect margins
Service quality transparency
Real-time tracking and NPS expose performance gaps instantly, and Bain (2024) shows top-quartile NPS firms grow ~2.5x faster, raising customer leverage when scores dip. Poor on-time or first-attempt metrics commonly trigger contract rebates or re-allocations to rivals; maintaining >95% on-time/first-attempt lifts pricing power. Data-driven reviews and visibility enable conversion of service into premium positioning.
- Visibility: real-time tracking exposes failures
- NPS: top-quartile → ~2.5x revenue growth (Bain 2024)
- Operational threshold: >95% on-time/first-attempt
- Commercial impact: rebates, re-allocations, premium pricing
Marketplaces >60% GMV; 3PL $1.5T; peak +20-35%; >95% OT = pricing power
Large marketplaces (top 5 >60% online GMV 2023–24) force lower rates and strict SLAs; low switching costs and a $1.5T 3PL market (2024) amplify buyer leverage. Peak weeks (+20–35% demand in 2024) and 20% e‑commerce return rates raise complexity; >95% on‑time and top‑quartile NPS (~2.5x growth) restore pricing power.
| Metric | 2024 stat |
|---|---|
| Top‑5 marketplace GMV | >60% |
| 3PL market | $1.5T |
| Peak demand lift | +20–35% |
| Returns | 20% |
| On‑time target | >95% |
Preview the Actual Deliverable
Sequoia Logística Porter's Five Forces Analysis
This preview shows the exact Sequoia Logística Porter’s Five Forces analysis you’ll receive immediately after purchase—fully formatted, data-driven and ready to deploy. No excerpts or placeholders are used; the file is complete and professional. Completing your purchase grants instant access to this identical document with no further setup required.

Don't Miss the Bigger Picture
Sequoia Logística faces intense competitive rivalry amid capacity-driven pricing and service differentiation, with supplier power moderate due to specialized equipment and buyer power rising as large shippers demand integrated solutions. Threat of new entrants is moderate given capital and network hurdles, while substitutes remain limited. This brief snapshot only scratches the surface—unlock the full Porter's Five Forces Analysis for detailed ratings, visuals, and strategic takeaways.
Suppliers Bargaining Power
Fuel and fleet providers influence costs
Diesel, gasoline suppliers, OEMs and leasing firms can swing operating costs via price and availability changes; ANP data showed average diesel around BRL 5.80/l in 2024, directly pressuring last-mile margins and feeding fuel surcharges. Long-term fuel and lease contracts often cover a large share of volumes and blunt spikes but do not eliminate exposure. Sequoia’s scale improves negotiating leverage, yet switching fleets or fuel arrangements involves fleet downtime, regulatory certification and leasing penalties.
Labor and contractor capacity tightness
Drivers, couriers and subcontracted 3PLs are critical inputs with variable availability; in 2024 peak-season day rates spiked as much as 30% on dense urban routes, boosting supplier power. Compliance, training and safety needs (certified-driver onboarding 4–8 weeks) limit rapid substitution, while balanced roster management and incentive schemes have cut volatility in pilots by ~15%.
Technology vendors and platforms
Route optimization, TMS/WMS and real-time tracking rely on software vendors and cloud providers (AWS ~32% market share in 2024), creating lock-in and integration complexity that raise switching costs; typical 99.95% uptime SLAs imply ~4.4 hours downtime/year as a negotiation lever. Cybersecurity stakes are high given average breach costs in the multi-million dollar range, while building in-house platforms cuts dependency but adds fixed costs often in the low- to mid-single-digit millions.
Real estate and micro-fulfillment landlords
Urban cross-docks, dark stores, and last-mile hubs are scarce in prime areas, pushing vacancy for urban logistics below 5% in many 2024 metros and allowing landlords to drive rents up, raising unit logistics costs. Long leases (often 5–10+ years) secure footprints but reduce operational flexibility, while multi-node network design spreads bargaining leverage across landlords and markets.
- Scarcity: prime urban vacancy <5% (2024)
- Rents: upward pressure in high-demand zones
- Lease terms: 5–10+ year commitments reduce flexibility
- Mitigation: multi-node networks dilute landlord power
Specialized equipment and parts
Specialized cold chain units, barcode scanners, automated sorting systems and OEM spare parts are sourced from a limited pool of global suppliers, with typical procurement lead times of 12–24 weeks and 2024 FX volatility (roughly 8–12% swings for emerging-market currencies) increasing cost and delivery risk.
Preventive maintenance programs and dual sourcing have cut scheduled downtime in comparable logistics operators by up to 15–20%, while standardizing equipment specs expands eligible vendors over time and reduces single‑supplier dependence.
- Limited supplier pool: cold chain, scanners, sorters, spare parts
- Procurement risk: 12–24 week lead times; 8–12% FX swings (2024)
- Mitigants: preventive maintenance; dual sourcing (15–20% downtime reduction)
- Strategy: standardize specs to broaden supplier base
Cost shocks: Diesel BRL 5.80/l, driver rates +30%, scarce urban sites
Suppliers exert moderate-to-high power: fuel (diesel ~BRL 5.80/l in 2024) and drivers (peak rates +30% in 2024; onboarding 4–8 weeks) directly raise costs; tech vendors (AWS ~32% share) and scarce urban sites (vacancy <5% in 2024) create lock-in. Procurement lead times 12–24 weeks and FX swings 8–12% increase risk; dual sourcing and scale cut exposure.
| Metric | 2024 |
|---|---|
| Diesel | BRL 5.80/l |
| Driver peak rate spike | +30% |
| Urban vacancy | <5% |
| AWS market share | ~32% |
| Lead times | 12–24 wks |
| FX volatility | 8–12% |
What is included in the product
Detailed Word Document
Tailored Porter's Five Forces analysis for Sequoia Logística uncovering competitive rivalry, supplier and buyer power, entry barriers, and substitute threats, with strategic insights on disruptive trends and pricing leverage to guide investor and management decisions.
Customizable Excel Spreadsheet
Clear one-sheet Porter's Five Forces for Sequoia Logística—instantly visualize competitive pressure with a customizable spider chart, swap in your data, adjust scenarios (pre/post regulation or new entrants) and export to decks or Word reports without macros for fast, boardroom-ready decision-making.
Customers Bargaining Power
Concentrated e-commerce giants
Large marketplaces and retailers in Brazil aggregate massive volumes and demand lower logistics rates, with the top five marketplaces accounting for over 60% of online GMV in recent market reports (2023–24), pressuring Sequoia on pricing. They impose strict SLAs, custom integrations and penalties that raise operating complexity and compliance costs. Their ability to multi-source logistics providers weakens Sequoia’s pricing power. Long-term contracts frequently trade 2–5 percentage points of margin for volume stability.
Low switching costs across 3PLs
Low switching costs are amplified by service comparability and API-enabled onboarding that cuts integration to days, making migration feasible; the global 3PL market was roughly $1.5 trillion in 2024, increasing buyer options. Customers benchmark primarily on price, speed and delivery success rates, driving tendering pressure. Regional carriers can replicate lanes quickly, raising buyer leverage. Differentiation via reliability and real-time visibility increases stickiness.
Seasonality and demand volatility
Peak events shift bargaining as clients pre-book capacity, with peak-week bookings often rising 20–35% in 2024, tightening supply and favoring carriers. Buyers with stable baseline volumes secure ~5–15% better year-round rates via volume contracts. Surge pricing is capped by competitive alternatives; forecast-accuracy programs commonly trade 3–8% discounts for predictable volumes.
Customization and integration demands
Clients increasingly demand tailored reverse logistics, bespoke packaging, and integrated omnichannel flows, driving operational complexity; e-commerce return rates averaged about 20% in 2024, amplifying reverse-logistics volume. Custom work raises cost-to-serve and gives buyers leverage to push scope creep and concessions, so clear catalogs and modular solutions are essential to protect margins.
- Tailored reverse logistics
- Omnichannel integration
- Scope creep pressure
- Modular catalogs protect margins
Service quality transparency
Real-time tracking and NPS expose performance gaps instantly, and Bain (2024) shows top-quartile NPS firms grow ~2.5x faster, raising customer leverage when scores dip. Poor on-time or first-attempt metrics commonly trigger contract rebates or re-allocations to rivals; maintaining >95% on-time/first-attempt lifts pricing power. Data-driven reviews and visibility enable conversion of service into premium positioning.
- Visibility: real-time tracking exposes failures
- NPS: top-quartile → ~2.5x revenue growth (Bain 2024)
- Operational threshold: >95% on-time/first-attempt
- Commercial impact: rebates, re-allocations, premium pricing
Marketplaces >60% GMV; 3PL $1.5T; peak +20-35%; >95% OT = pricing power
Large marketplaces (top 5 >60% online GMV 2023–24) force lower rates and strict SLAs; low switching costs and a $1.5T 3PL market (2024) amplify buyer leverage. Peak weeks (+20–35% demand in 2024) and 20% e‑commerce return rates raise complexity; >95% on‑time and top‑quartile NPS (~2.5x growth) restore pricing power.
| Metric | 2024 stat |
|---|---|
| Top‑5 marketplace GMV | >60% |
| 3PL market | $1.5T |
| Peak demand lift | +20–35% |
| Returns | 20% |
| On‑time target | >95% |
Preview the Actual Deliverable
Sequoia Logística Porter's Five Forces Analysis
This preview shows the exact Sequoia Logística Porter’s Five Forces analysis you’ll receive immediately after purchase—fully formatted, data-driven and ready to deploy. No excerpts or placeholders are used; the file is complete and professional. Completing your purchase grants instant access to this identical document with no further setup required.
Original: $10.00
-65%$10.00
$3.50Description
Don't Miss the Bigger Picture
Sequoia Logística faces intense competitive rivalry amid capacity-driven pricing and service differentiation, with supplier power moderate due to specialized equipment and buyer power rising as large shippers demand integrated solutions. Threat of new entrants is moderate given capital and network hurdles, while substitutes remain limited. This brief snapshot only scratches the surface—unlock the full Porter's Five Forces Analysis for detailed ratings, visuals, and strategic takeaways.
Suppliers Bargaining Power
Fuel and fleet providers influence costs
Diesel, gasoline suppliers, OEMs and leasing firms can swing operating costs via price and availability changes; ANP data showed average diesel around BRL 5.80/l in 2024, directly pressuring last-mile margins and feeding fuel surcharges. Long-term fuel and lease contracts often cover a large share of volumes and blunt spikes but do not eliminate exposure. Sequoia’s scale improves negotiating leverage, yet switching fleets or fuel arrangements involves fleet downtime, regulatory certification and leasing penalties.
Labor and contractor capacity tightness
Drivers, couriers and subcontracted 3PLs are critical inputs with variable availability; in 2024 peak-season day rates spiked as much as 30% on dense urban routes, boosting supplier power. Compliance, training and safety needs (certified-driver onboarding 4–8 weeks) limit rapid substitution, while balanced roster management and incentive schemes have cut volatility in pilots by ~15%.
Technology vendors and platforms
Route optimization, TMS/WMS and real-time tracking rely on software vendors and cloud providers (AWS ~32% market share in 2024), creating lock-in and integration complexity that raise switching costs; typical 99.95% uptime SLAs imply ~4.4 hours downtime/year as a negotiation lever. Cybersecurity stakes are high given average breach costs in the multi-million dollar range, while building in-house platforms cuts dependency but adds fixed costs often in the low- to mid-single-digit millions.
Real estate and micro-fulfillment landlords
Urban cross-docks, dark stores, and last-mile hubs are scarce in prime areas, pushing vacancy for urban logistics below 5% in many 2024 metros and allowing landlords to drive rents up, raising unit logistics costs. Long leases (often 5–10+ years) secure footprints but reduce operational flexibility, while multi-node network design spreads bargaining leverage across landlords and markets.
- Scarcity: prime urban vacancy <5% (2024)
- Rents: upward pressure in high-demand zones
- Lease terms: 5–10+ year commitments reduce flexibility
- Mitigation: multi-node networks dilute landlord power
Specialized equipment and parts
Specialized cold chain units, barcode scanners, automated sorting systems and OEM spare parts are sourced from a limited pool of global suppliers, with typical procurement lead times of 12–24 weeks and 2024 FX volatility (roughly 8–12% swings for emerging-market currencies) increasing cost and delivery risk.
Preventive maintenance programs and dual sourcing have cut scheduled downtime in comparable logistics operators by up to 15–20%, while standardizing equipment specs expands eligible vendors over time and reduces single‑supplier dependence.
- Limited supplier pool: cold chain, scanners, sorters, spare parts
- Procurement risk: 12–24 week lead times; 8–12% FX swings (2024)
- Mitigants: preventive maintenance; dual sourcing (15–20% downtime reduction)
- Strategy: standardize specs to broaden supplier base
Cost shocks: Diesel BRL 5.80/l, driver rates +30%, scarce urban sites
Suppliers exert moderate-to-high power: fuel (diesel ~BRL 5.80/l in 2024) and drivers (peak rates +30% in 2024; onboarding 4–8 weeks) directly raise costs; tech vendors (AWS ~32% share) and scarce urban sites (vacancy <5% in 2024) create lock-in. Procurement lead times 12–24 weeks and FX swings 8–12% increase risk; dual sourcing and scale cut exposure.
| Metric | 2024 |
|---|---|
| Diesel | BRL 5.80/l |
| Driver peak rate spike | +30% |
| Urban vacancy | <5% |
| AWS market share | ~32% |
| Lead times | 12–24 wks |
| FX volatility | 8–12% |
What is included in the product
Detailed Word Document
Tailored Porter's Five Forces analysis for Sequoia Logística uncovering competitive rivalry, supplier and buyer power, entry barriers, and substitute threats, with strategic insights on disruptive trends and pricing leverage to guide investor and management decisions.
Customizable Excel Spreadsheet
Clear one-sheet Porter's Five Forces for Sequoia Logística—instantly visualize competitive pressure with a customizable spider chart, swap in your data, adjust scenarios (pre/post regulation or new entrants) and export to decks or Word reports without macros for fast, boardroom-ready decision-making.
Customers Bargaining Power
Concentrated e-commerce giants
Large marketplaces and retailers in Brazil aggregate massive volumes and demand lower logistics rates, with the top five marketplaces accounting for over 60% of online GMV in recent market reports (2023–24), pressuring Sequoia on pricing. They impose strict SLAs, custom integrations and penalties that raise operating complexity and compliance costs. Their ability to multi-source logistics providers weakens Sequoia’s pricing power. Long-term contracts frequently trade 2–5 percentage points of margin for volume stability.
Low switching costs across 3PLs
Low switching costs are amplified by service comparability and API-enabled onboarding that cuts integration to days, making migration feasible; the global 3PL market was roughly $1.5 trillion in 2024, increasing buyer options. Customers benchmark primarily on price, speed and delivery success rates, driving tendering pressure. Regional carriers can replicate lanes quickly, raising buyer leverage. Differentiation via reliability and real-time visibility increases stickiness.
Seasonality and demand volatility
Peak events shift bargaining as clients pre-book capacity, with peak-week bookings often rising 20–35% in 2024, tightening supply and favoring carriers. Buyers with stable baseline volumes secure ~5–15% better year-round rates via volume contracts. Surge pricing is capped by competitive alternatives; forecast-accuracy programs commonly trade 3–8% discounts for predictable volumes.
Customization and integration demands
Clients increasingly demand tailored reverse logistics, bespoke packaging, and integrated omnichannel flows, driving operational complexity; e-commerce return rates averaged about 20% in 2024, amplifying reverse-logistics volume. Custom work raises cost-to-serve and gives buyers leverage to push scope creep and concessions, so clear catalogs and modular solutions are essential to protect margins.
- Tailored reverse logistics
- Omnichannel integration
- Scope creep pressure
- Modular catalogs protect margins
Service quality transparency
Real-time tracking and NPS expose performance gaps instantly, and Bain (2024) shows top-quartile NPS firms grow ~2.5x faster, raising customer leverage when scores dip. Poor on-time or first-attempt metrics commonly trigger contract rebates or re-allocations to rivals; maintaining >95% on-time/first-attempt lifts pricing power. Data-driven reviews and visibility enable conversion of service into premium positioning.
- Visibility: real-time tracking exposes failures
- NPS: top-quartile → ~2.5x revenue growth (Bain 2024)
- Operational threshold: >95% on-time/first-attempt
- Commercial impact: rebates, re-allocations, premium pricing
Marketplaces >60% GMV; 3PL $1.5T; peak +20-35%; >95% OT = pricing power
Large marketplaces (top 5 >60% online GMV 2023–24) force lower rates and strict SLAs; low switching costs and a $1.5T 3PL market (2024) amplify buyer leverage. Peak weeks (+20–35% demand in 2024) and 20% e‑commerce return rates raise complexity; >95% on‑time and top‑quartile NPS (~2.5x growth) restore pricing power.
| Metric | 2024 stat |
|---|---|
| Top‑5 marketplace GMV | >60% |
| 3PL market | $1.5T |
| Peak demand lift | +20–35% |
| Returns | 20% |
| On‑time target | >95% |
Preview the Actual Deliverable
Sequoia Logística Porter's Five Forces Analysis
This preview shows the exact Sequoia Logística Porter’s Five Forces analysis you’ll receive immediately after purchase—fully formatted, data-driven and ready to deploy. No excerpts or placeholders are used; the file is complete and professional. Completing your purchase grants instant access to this identical document with no further setup required.











