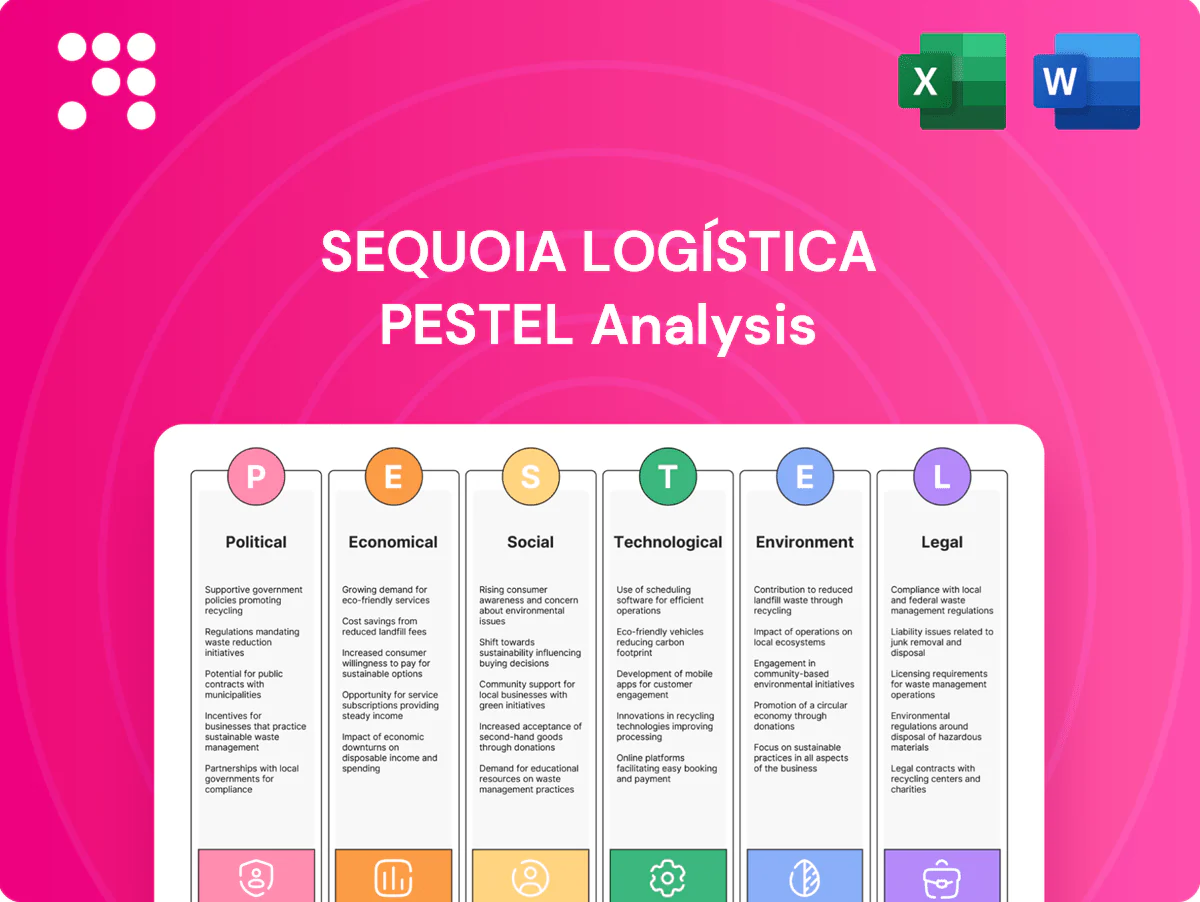
Sequoia Logística PESTLE Analysis

Skip the Research. Get the Strategy.
Our Sequoia Logística PESTLE Analysis reveals how political shifts, economic cycles, social trends, technological advances, legal changes, and environmental forces converge to shape growth and risk. Insightful for investors and strategists, it highlights immediate threats and opportunity pockets. Purchase the full report to get the complete, actionable breakdown and downloadable charts.
Political factors

Logistics infrastructure policy
Government investments and concessions in highways, ports and airports directly affect Sequoia Logística by altering delivery speed and costs; for example the US Bipartisan Infrastructure Law commits 1.2 trillion USD (550 billion USD new) which shifts freight flows and tariffing frameworks. Participation in federal/state PPPs expands capacity and geographic reach via concessioned terminals and road corridors. Delays or budget cuts stall network efficiency, raise maintenance burdens, and undermine long-term capex planning for hubs and cross-docks.
Taxation and fuel policy
Diesel taxes and subsidies materially shift margins: diesel represents roughly 30% of road-freight operating cost and Brazil’s mandatory biodiesel blend reached 12% (B12) per ANP policy from 2023, changing input pricing. ICMS rates vary by state (commonly 12–25%), so harmonization can simplify or complicate route economics. Sudden federal or state tax reforms force contract repricing, while predictable fuel policy enables hedging and fuel-surcharge mechanisms.

Security and public order
Public security measures influence theft risk and insurance premiums on last-mile routes. Political focus on urban safety improves delivery reliability; last-mile can represent up to 53% of delivery costs, so reduced theft lowers operating expense. Protests or road blockades disrupt networks and SLA compliance. Coordination with authorities mitigates high-risk corridor exposure.

Trade and customs stance
Mercosur (Argentina, Brazil, Paraguay, Uruguay) customs rules and import procedures directly shape cross-border lead times and compliance for Sequoia Logística. Brazil and Uruguay had national single windows in place by 2024, helping speed clearances and e-commerce inflows. Protectionist shifts raise administrative costs and unpredictability, while efficient customs interfaces support reverse logistics—returns can represent roughly 8–10% of e-commerce sales (McKinsey 2023).
- Mercosur members: Argentina, Brazil, Paraguay, Uruguay
- Single windows: Brazil, Uruguay (by 2024)
- Returns cost: ~8–10% of e-commerce sales (McKinsey 2023)
- Protectionism increases admin costs, slows lead times
Election cycles and governance
Election-year spending and regulatory shifts create planning uncertainty for Sequoia Logística, as OECD data shows public procurement averages about 12% of GDP, concentrating demand and political scrutiny; leadership changes in transport agencies can quickly reset infrastructure and safety priorities, while B2G procurement cycles may pause or accelerate around budget and electoral timetables, increasing cash-flow and scheduling risk; strong compliance and stakeholder engagement materially reduce policy risk.
- Election-year volatility — higher regulatory change risk
- Agency leadership turnover — resets transport priorities
- B2G procurement — timing swings around budgets
- Compliance & engagement — lowers policy exposure
1.2T US infra & PPPs reshape routes; diesel, ICMS, customs and elections squeeze margins
Government infrastructure programs (US 1.2 trillion USD law; 550 billion USD new) and PPPs reshape routes and capex. Fuel policy (diesel ~30% of costs; Brazil B12 from 2023) and ICMS (12–25%) affect margins and contract pricing. Customs, security, election cycles (procurement ~12% GDP) drive lead-time and risk.
| Metric | Value |
|---|---|
| Bipartisan Infra. | 1.2T USD (550B new) |
| Diesel share | ~30% |
| ICMS range | 12–25% |
| Last-mile cost | up to 53% |
| Procurement | ~12% GDP |
What is included in the product
 Detailed Word Document
Explores how macro-environmental forces uniquely affect Sequoia Logística across Political, Economic, Social, Technological, Environmental and Legal dimensions, with data-backed trends and region-specific examples to identify risks and opportunities for executives, investors and strategists.

 Customizable Excel Spreadsheet
A concise, visually segmented PESTLE summary for Sequoia Logística that’s easily dropped into presentations, editable for regional or business-line context, and ideal for quick cross-team alignment, risk discussions and client-ready strategy packs.
Economic factors

GDP and retail demand
Brazil’s GDP trajectory — roughly 3% growth in 2024 with forecasts near 2% for 2025 — directly drives volumes across Sequoia’s B2C and B2B flows. Rising e-commerce penetration (double-digit annual growth) amplifies peak-season volumes. Macro slowdowns compress yields and utilization rates. Diversification across industrial, FMCG and healthcare clients cushions demand shocks.
Inflation and interest rates
High inflation in 2023–24 pushed wages, fuel and equipment costs higher, pressuring margins; Sequoia offsets this via indexation clauses and dynamic pricing. Elevated Selic (peaked at 13.75% in the 2023–24 tightening cycle) raises leasing and working-capital costs. Rigorous cost discipline and targeted automation projects reduce unit costs and partly offset monetary headwinds.

FX volatility (BRL)
FX volatility around the BRL, which hovered near 5.0 per USD in 2024–25, increases costs for imported vehicles, parts and tech licenses, directly lifting capex and maintenance outlays when the real weakens. Hedging programs and increased local sourcing have reduced Sequoia Logística’s net exposure to swings. Multinational client flows can reallocate freight volumes between domestic and cross-border lanes, affecting lane profitability.

Fuel and energy prices
Diesel price volatility remains a primary cost driver for Sequoia Logística, pushing linehaul and last-mile fuel spend and prompting widespread use of indexed surcharges and targeted efficiency programs to stabilize unit economics. Transition to electric vans/trucks hinges on total cost of ownership versus diesel; fleet pilots in 2024–25 show TCO gaps narrowing but payback still dependent on duty cycle and incentives. Route optimization and telematics routinely cut idle time and fuel burn by roughly 10–20%, directly improving margins.
- Diesel volatility: major cost driver
- Surcharges + efficiency: stabilize unit economics
- EV adoption: contingent on TCO parity
- Route optimization: ~10–20% fuel/idle reduction
Market consolidation
Competitive pressure from integrators and marketplaces is intensifying pricing pressure as e-commerce reached about 23% of global retail sales in 2024, compressing spot rates and margins.
M&A (≈$95bn logistics deals in 2023) is driving scale benefits in density and tech; fragmented regions remain ripe for roll-ups, while service differentiation preserves 10–20% higher yields on premium lanes.
- competitive-pressure
- ecommerce-23%-2024
- M&A-$95bn-2023
- roll-up-opportunity
- service-differentiation-10–20%-yield
1.2T US infra & PPPs reshape routes; diesel, ICMS, customs and elections squeeze margins
Brazil GDP ~3% (2024) then ~2% (2025) drives volumes; e‑commerce ~23% (2024) boosts peak demand. Selic peaked 13.75% (2023–24) and BRL ≈5.0/USD raise capex and working capital; hedging and local sourcing reduce FX risk. Diesel volatility and fuel surcharges remain key cost levers; route optimization cuts fuel/idle ~10–20%. M&A (~$95bn logistics deals 2023) increases scale benefits.
| Metric | Value |
|---|---|
| GDP growth | ~3% (2024), ~2% (2025) |
| E‑commerce | 23% (2024) |
| Selic peak | 13.75% |
| BRL/USD | ~5.0 |
| Diesel savings | 10–20% |
| M&A | $95bn (2023) |
What You See Is What You Get
Sequoia Logística PESTLE Analysis
The Sequoia Logística PESTLE Analysis preview shown here is the exact document you’ll receive after purchase—fully formatted and ready to use. It contains the complete political, economic, social, technological, legal, and environmental assessment as displayed. No placeholders or teasers—this is the final file you’ll download immediately after checkout.

Skip the Research. Get the Strategy.
Our Sequoia Logística PESTLE Analysis reveals how political shifts, economic cycles, social trends, technological advances, legal changes, and environmental forces converge to shape growth and risk. Insightful for investors and strategists, it highlights immediate threats and opportunity pockets. Purchase the full report to get the complete, actionable breakdown and downloadable charts.
Political factors
Logistics infrastructure policy
Government investments and concessions in highways, ports and airports directly affect Sequoia Logística by altering delivery speed and costs; for example the US Bipartisan Infrastructure Law commits 1.2 trillion USD (550 billion USD new) which shifts freight flows and tariffing frameworks. Participation in federal/state PPPs expands capacity and geographic reach via concessioned terminals and road corridors. Delays or budget cuts stall network efficiency, raise maintenance burdens, and undermine long-term capex planning for hubs and cross-docks.
Taxation and fuel policy
Diesel taxes and subsidies materially shift margins: diesel represents roughly 30% of road-freight operating cost and Brazil’s mandatory biodiesel blend reached 12% (B12) per ANP policy from 2023, changing input pricing. ICMS rates vary by state (commonly 12–25%), so harmonization can simplify or complicate route economics. Sudden federal or state tax reforms force contract repricing, while predictable fuel policy enables hedging and fuel-surcharge mechanisms.
Security and public order
Public security measures influence theft risk and insurance premiums on last-mile routes. Political focus on urban safety improves delivery reliability; last-mile can represent up to 53% of delivery costs, so reduced theft lowers operating expense. Protests or road blockades disrupt networks and SLA compliance. Coordination with authorities mitigates high-risk corridor exposure.
Trade and customs stance
Mercosur (Argentina, Brazil, Paraguay, Uruguay) customs rules and import procedures directly shape cross-border lead times and compliance for Sequoia Logística. Brazil and Uruguay had national single windows in place by 2024, helping speed clearances and e-commerce inflows. Protectionist shifts raise administrative costs and unpredictability, while efficient customs interfaces support reverse logistics—returns can represent roughly 8–10% of e-commerce sales (McKinsey 2023).
- Mercosur members: Argentina, Brazil, Paraguay, Uruguay
- Single windows: Brazil, Uruguay (by 2024)
- Returns cost: ~8–10% of e-commerce sales (McKinsey 2023)
- Protectionism increases admin costs, slows lead times
Election cycles and governance
Election-year spending and regulatory shifts create planning uncertainty for Sequoia Logística, as OECD data shows public procurement averages about 12% of GDP, concentrating demand and political scrutiny; leadership changes in transport agencies can quickly reset infrastructure and safety priorities, while B2G procurement cycles may pause or accelerate around budget and electoral timetables, increasing cash-flow and scheduling risk; strong compliance and stakeholder engagement materially reduce policy risk.
- Election-year volatility — higher regulatory change risk
- Agency leadership turnover — resets transport priorities
- B2G procurement — timing swings around budgets
- Compliance & engagement — lowers policy exposure
1.2T US infra & PPPs reshape routes; diesel, ICMS, customs and elections squeeze margins
Government infrastructure programs (US 1.2 trillion USD law; 550 billion USD new) and PPPs reshape routes and capex. Fuel policy (diesel ~30% of costs; Brazil B12 from 2023) and ICMS (12–25%) affect margins and contract pricing. Customs, security, election cycles (procurement ~12% GDP) drive lead-time and risk.
| Metric | Value |
|---|---|
| Bipartisan Infra. | 1.2T USD (550B new) |
| Diesel share | ~30% |
| ICMS range | 12–25% |
| Last-mile cost | up to 53% |
| Procurement | ~12% GDP |
What is included in the product
Detailed Word Document
Explores how macro-environmental forces uniquely affect Sequoia Logística across Political, Economic, Social, Technological, Environmental and Legal dimensions, with data-backed trends and region-specific examples to identify risks and opportunities for executives, investors and strategists.
Customizable Excel Spreadsheet
A concise, visually segmented PESTLE summary for Sequoia Logística that’s easily dropped into presentations, editable for regional or business-line context, and ideal for quick cross-team alignment, risk discussions and client-ready strategy packs.
Economic factors
GDP and retail demand
Brazil’s GDP trajectory — roughly 3% growth in 2024 with forecasts near 2% for 2025 — directly drives volumes across Sequoia’s B2C and B2B flows. Rising e-commerce penetration (double-digit annual growth) amplifies peak-season volumes. Macro slowdowns compress yields and utilization rates. Diversification across industrial, FMCG and healthcare clients cushions demand shocks.
Inflation and interest rates
High inflation in 2023–24 pushed wages, fuel and equipment costs higher, pressuring margins; Sequoia offsets this via indexation clauses and dynamic pricing. Elevated Selic (peaked at 13.75% in the 2023–24 tightening cycle) raises leasing and working-capital costs. Rigorous cost discipline and targeted automation projects reduce unit costs and partly offset monetary headwinds.
FX volatility (BRL)
FX volatility around the BRL, which hovered near 5.0 per USD in 2024–25, increases costs for imported vehicles, parts and tech licenses, directly lifting capex and maintenance outlays when the real weakens. Hedging programs and increased local sourcing have reduced Sequoia Logística’s net exposure to swings. Multinational client flows can reallocate freight volumes between domestic and cross-border lanes, affecting lane profitability.
Fuel and energy prices
Diesel price volatility remains a primary cost driver for Sequoia Logística, pushing linehaul and last-mile fuel spend and prompting widespread use of indexed surcharges and targeted efficiency programs to stabilize unit economics. Transition to electric vans/trucks hinges on total cost of ownership versus diesel; fleet pilots in 2024–25 show TCO gaps narrowing but payback still dependent on duty cycle and incentives. Route optimization and telematics routinely cut idle time and fuel burn by roughly 10–20%, directly improving margins.
- Diesel volatility: major cost driver
- Surcharges + efficiency: stabilize unit economics
- EV adoption: contingent on TCO parity
- Route optimization: ~10–20% fuel/idle reduction
Market consolidation
Competitive pressure from integrators and marketplaces is intensifying pricing pressure as e-commerce reached about 23% of global retail sales in 2024, compressing spot rates and margins.
M&A (≈$95bn logistics deals in 2023) is driving scale benefits in density and tech; fragmented regions remain ripe for roll-ups, while service differentiation preserves 10–20% higher yields on premium lanes.
- competitive-pressure
- ecommerce-23%-2024
- M&A-$95bn-2023
- roll-up-opportunity
- service-differentiation-10–20%-yield
1.2T US infra & PPPs reshape routes; diesel, ICMS, customs and elections squeeze margins
Brazil GDP ~3% (2024) then ~2% (2025) drives volumes; e‑commerce ~23% (2024) boosts peak demand. Selic peaked 13.75% (2023–24) and BRL ≈5.0/USD raise capex and working capital; hedging and local sourcing reduce FX risk. Diesel volatility and fuel surcharges remain key cost levers; route optimization cuts fuel/idle ~10–20%. M&A (~$95bn logistics deals 2023) increases scale benefits.
| Metric | Value |
|---|---|
| GDP growth | ~3% (2024), ~2% (2025) |
| E‑commerce | 23% (2024) |
| Selic peak | 13.75% |
| BRL/USD | ~5.0 |
| Diesel savings | 10–20% |
| M&A | $95bn (2023) |
What You See Is What You Get
Sequoia Logística PESTLE Analysis
The Sequoia Logística PESTLE Analysis preview shown here is the exact document you’ll receive after purchase—fully formatted and ready to use. It contains the complete political, economic, social, technological, legal, and environmental assessment as displayed. No placeholders or teasers—this is the final file you’ll download immediately after checkout.
Original: $10.00
-65%$10.00
$3.50Description
Skip the Research. Get the Strategy.
Our Sequoia Logística PESTLE Analysis reveals how political shifts, economic cycles, social trends, technological advances, legal changes, and environmental forces converge to shape growth and risk. Insightful for investors and strategists, it highlights immediate threats and opportunity pockets. Purchase the full report to get the complete, actionable breakdown and downloadable charts.
Political factors
Logistics infrastructure policy
Government investments and concessions in highways, ports and airports directly affect Sequoia Logística by altering delivery speed and costs; for example the US Bipartisan Infrastructure Law commits 1.2 trillion USD (550 billion USD new) which shifts freight flows and tariffing frameworks. Participation in federal/state PPPs expands capacity and geographic reach via concessioned terminals and road corridors. Delays or budget cuts stall network efficiency, raise maintenance burdens, and undermine long-term capex planning for hubs and cross-docks.
Taxation and fuel policy
Diesel taxes and subsidies materially shift margins: diesel represents roughly 30% of road-freight operating cost and Brazil’s mandatory biodiesel blend reached 12% (B12) per ANP policy from 2023, changing input pricing. ICMS rates vary by state (commonly 12–25%), so harmonization can simplify or complicate route economics. Sudden federal or state tax reforms force contract repricing, while predictable fuel policy enables hedging and fuel-surcharge mechanisms.
Security and public order
Public security measures influence theft risk and insurance premiums on last-mile routes. Political focus on urban safety improves delivery reliability; last-mile can represent up to 53% of delivery costs, so reduced theft lowers operating expense. Protests or road blockades disrupt networks and SLA compliance. Coordination with authorities mitigates high-risk corridor exposure.
Trade and customs stance
Mercosur (Argentina, Brazil, Paraguay, Uruguay) customs rules and import procedures directly shape cross-border lead times and compliance for Sequoia Logística. Brazil and Uruguay had national single windows in place by 2024, helping speed clearances and e-commerce inflows. Protectionist shifts raise administrative costs and unpredictability, while efficient customs interfaces support reverse logistics—returns can represent roughly 8–10% of e-commerce sales (McKinsey 2023).
- Mercosur members: Argentina, Brazil, Paraguay, Uruguay
- Single windows: Brazil, Uruguay (by 2024)
- Returns cost: ~8–10% of e-commerce sales (McKinsey 2023)
- Protectionism increases admin costs, slows lead times
Election cycles and governance
Election-year spending and regulatory shifts create planning uncertainty for Sequoia Logística, as OECD data shows public procurement averages about 12% of GDP, concentrating demand and political scrutiny; leadership changes in transport agencies can quickly reset infrastructure and safety priorities, while B2G procurement cycles may pause or accelerate around budget and electoral timetables, increasing cash-flow and scheduling risk; strong compliance and stakeholder engagement materially reduce policy risk.
- Election-year volatility — higher regulatory change risk
- Agency leadership turnover — resets transport priorities
- B2G procurement — timing swings around budgets
- Compliance & engagement — lowers policy exposure
1.2T US infra & PPPs reshape routes; diesel, ICMS, customs and elections squeeze margins
Government infrastructure programs (US 1.2 trillion USD law; 550 billion USD new) and PPPs reshape routes and capex. Fuel policy (diesel ~30% of costs; Brazil B12 from 2023) and ICMS (12–25%) affect margins and contract pricing. Customs, security, election cycles (procurement ~12% GDP) drive lead-time and risk.
| Metric | Value |
|---|---|
| Bipartisan Infra. | 1.2T USD (550B new) |
| Diesel share | ~30% |
| ICMS range | 12–25% |
| Last-mile cost | up to 53% |
| Procurement | ~12% GDP |
What is included in the product
Detailed Word Document
Explores how macro-environmental forces uniquely affect Sequoia Logística across Political, Economic, Social, Technological, Environmental and Legal dimensions, with data-backed trends and region-specific examples to identify risks and opportunities for executives, investors and strategists.
Customizable Excel Spreadsheet
A concise, visually segmented PESTLE summary for Sequoia Logística that’s easily dropped into presentations, editable for regional or business-line context, and ideal for quick cross-team alignment, risk discussions and client-ready strategy packs.
Economic factors
GDP and retail demand
Brazil’s GDP trajectory — roughly 3% growth in 2024 with forecasts near 2% for 2025 — directly drives volumes across Sequoia’s B2C and B2B flows. Rising e-commerce penetration (double-digit annual growth) amplifies peak-season volumes. Macro slowdowns compress yields and utilization rates. Diversification across industrial, FMCG and healthcare clients cushions demand shocks.
Inflation and interest rates
High inflation in 2023–24 pushed wages, fuel and equipment costs higher, pressuring margins; Sequoia offsets this via indexation clauses and dynamic pricing. Elevated Selic (peaked at 13.75% in the 2023–24 tightening cycle) raises leasing and working-capital costs. Rigorous cost discipline and targeted automation projects reduce unit costs and partly offset monetary headwinds.
FX volatility (BRL)
FX volatility around the BRL, which hovered near 5.0 per USD in 2024–25, increases costs for imported vehicles, parts and tech licenses, directly lifting capex and maintenance outlays when the real weakens. Hedging programs and increased local sourcing have reduced Sequoia Logística’s net exposure to swings. Multinational client flows can reallocate freight volumes between domestic and cross-border lanes, affecting lane profitability.
Fuel and energy prices
Diesel price volatility remains a primary cost driver for Sequoia Logística, pushing linehaul and last-mile fuel spend and prompting widespread use of indexed surcharges and targeted efficiency programs to stabilize unit economics. Transition to electric vans/trucks hinges on total cost of ownership versus diesel; fleet pilots in 2024–25 show TCO gaps narrowing but payback still dependent on duty cycle and incentives. Route optimization and telematics routinely cut idle time and fuel burn by roughly 10–20%, directly improving margins.
- Diesel volatility: major cost driver
- Surcharges + efficiency: stabilize unit economics
- EV adoption: contingent on TCO parity
- Route optimization: ~10–20% fuel/idle reduction
Market consolidation
Competitive pressure from integrators and marketplaces is intensifying pricing pressure as e-commerce reached about 23% of global retail sales in 2024, compressing spot rates and margins.
M&A (≈$95bn logistics deals in 2023) is driving scale benefits in density and tech; fragmented regions remain ripe for roll-ups, while service differentiation preserves 10–20% higher yields on premium lanes.
- competitive-pressure
- ecommerce-23%-2024
- M&A-$95bn-2023
- roll-up-opportunity
- service-differentiation-10–20%-yield
1.2T US infra & PPPs reshape routes; diesel, ICMS, customs and elections squeeze margins
Brazil GDP ~3% (2024) then ~2% (2025) drives volumes; e‑commerce ~23% (2024) boosts peak demand. Selic peaked 13.75% (2023–24) and BRL ≈5.0/USD raise capex and working capital; hedging and local sourcing reduce FX risk. Diesel volatility and fuel surcharges remain key cost levers; route optimization cuts fuel/idle ~10–20%. M&A (~$95bn logistics deals 2023) increases scale benefits.
| Metric | Value |
|---|---|
| GDP growth | ~3% (2024), ~2% (2025) |
| E‑commerce | 23% (2024) |
| Selic peak | 13.75% |
| BRL/USD | ~5.0 |
| Diesel savings | 10–20% |
| M&A | $95bn (2023) |
What You See Is What You Get
Sequoia Logística PESTLE Analysis
The Sequoia Logística PESTLE Analysis preview shown here is the exact document you’ll receive after purchase—fully formatted and ready to use. It contains the complete political, economic, social, technological, legal, and environmental assessment as displayed. No placeholders or teasers—this is the final file you’ll download immediately after checkout.











