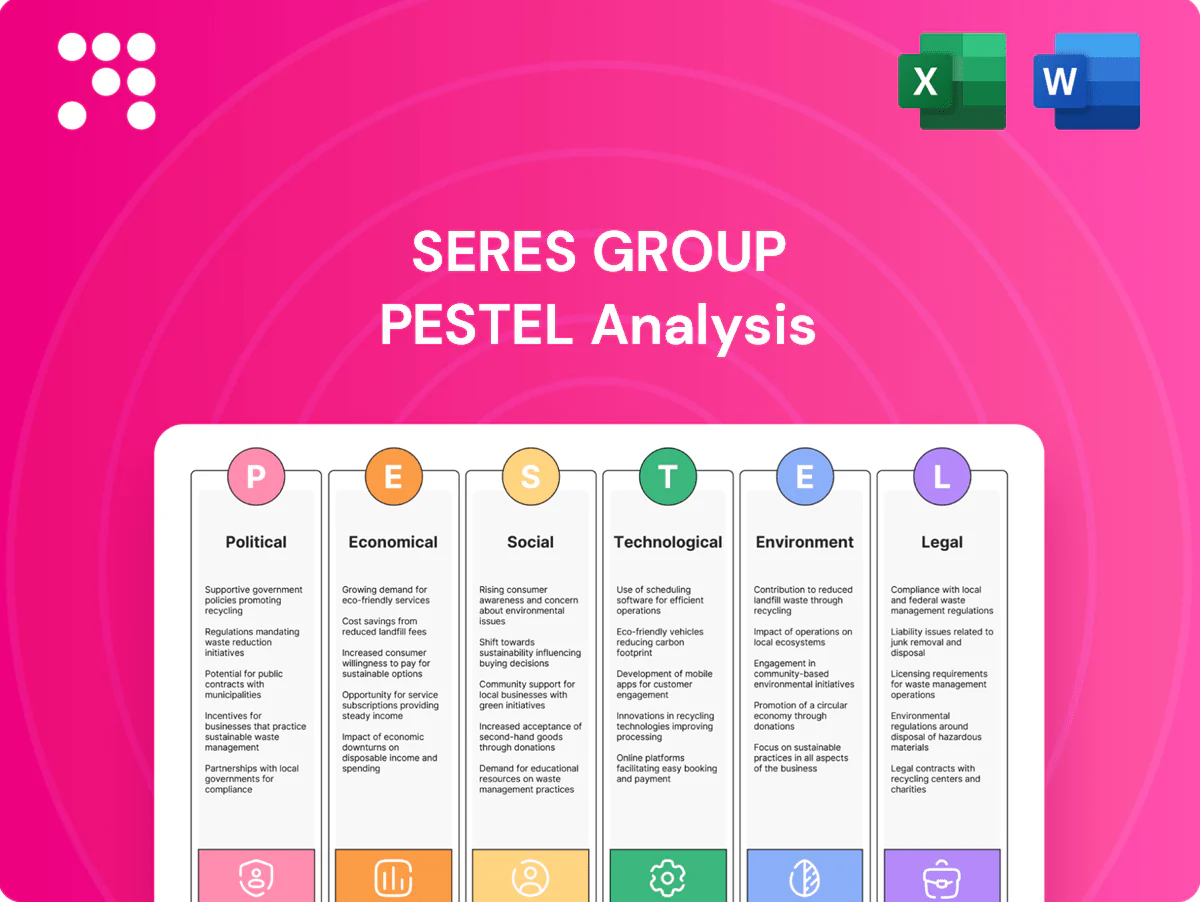
Seres Group PESTLE Analysis

Make Smarter Strategic Decisions with a Complete PESTEL View
Unlock strategic clarity with our PESTLE Analysis of Seres Group — concise, actionable insights into political, economic, social, technological, legal, and environmental forces shaping its trajectory. Perfect for investors and strategists seeking an immediate edge, this brief highlights key risks and opportunities. Purchase the full report to access the complete, ready-to-use analysis and make smarter decisions faster.
Political factors

China NEV industrial policy
China’s NEV industrial policy—central and provincial purchase subsidies now largely phased out—shifts incentives to charging infrastructure and license‑plate privileges, directly shaping Seres’ demand and cost curves; NEVs represented roughly 40% of new car sales in 2024. Policy moves from purchase to usage incentives reduce Seres’ upfront pricing power but raise lifetime value via charging and OTA services. Inclusion in MIIT catalogs and government white lists determines model eligibility for procurement and fleet sales. Close alignment with state decarbonization targets can unlock grants, tax breaks and preferential procurement.
Trade tensions and tariffs
EU provisional anti-subsidy duties on Chinese EVs, announced in 2023 and reaching as high as about 38%, plus heightened U.S. tariff scrutiny in 2023–24, materially squeeze export margins and volumes for Seres. To offset border costs Seres must evaluate CKD/SKD assembly or overseas plants. Retaliatory measures risk reducing parts sales and disrupting supplier networks. Strategic market selection and localized supply chains become critical.

Geopolitical supply chain risk
Export controls on advanced chips, battery inputs and software can derail Seres Group roadmaps given TSMC and Samsung account for roughly 70% of advanced logic capacity and China processes about 60% of battery-grade lithium chemicals; US CHIPS Act funding of $52bn and EU raw materials measures aim to shield supply. Diversifying lithium, nickel and semiconductor suppliers and locking government-backed resource deals can reduce exposure, while rigorous scenario planning is required for sudden regulatory shocks.

Local government support
City-level incentives, land grants and tax holidays materially shape Seres Group plant siting and dealership rollout; China ended national NEV purchase subsidies in 2023, leaving municipalities as primary local incentive providers. Ties with municipal fleets can seed initial volumes, but performance-linked subsidies raise execution and clawback risk. Monitoring local fiscal health is essential to avoid reversals.
- City incentives drive capex/location decisions
- Land grants reduce upfront costs
- Tax holidays aid early cashflow
- Performance clauses increase execution risk
- Monitor municipal fiscal metrics to prevent clawbacks
Overseas market access rules
Overseas market access rules force Seres to navigate differing homologation standards (EU/UNECE vs national rules cover 50+ markets), variable localization mandates and mixed political attitudes to Chinese brands. Participation in Belt and Road markets (149 partner countries) can lower entry barriers but raises exposure to regional instability and tariff/policy shifts. Government-to-government MOUs have shortened approvals in several cases, so a tailored diplomacy-plus-compliance strategy is required.
- homologation: EU/UNECE vs national (50+ markets)
- localization: local content thresholds, tax incentives
- belt-and-road: 149 countries—easier entry, higher political risk
- govt MOUs: accelerate approvals; need diplomacy + compliance
China NEV 40% sales; EU duty ~38%; CHIPS $52bn; BRI 149
China NEV policy shifts to usage/charging incentives after 2023 purchase subsidy end; NEVs ~40% of new car sales in 2024, raising lifetime service revenue but lowering upfront pricing power. EU provisional anti-subsidy duties ~38% and US tariff scrutiny compress export margins; CHIPS Act $52bn heightens semiconductor access risks. Municipal incentives and Belt & Road (149 countries) shape siting and market access.
| Factor | Metric | Immediate Impact |
|---|---|---|
| Domestic policy | NEV 40% (2024) | Service revenue ↑, pricing power ↓ |
| Trade | EU duty ~38% | Export margin compression |
| Supply controls | CHIPS Act $52bn | Semiconductor access risk |
| Market access | Belt & Road 149 | Entry ease vs political risk |
What is included in the product
 Detailed Word Document
Explores how macro-environmental factors uniquely affect Seres Group across Political, Economic, Social, Technological, Environmental and Legal dimensions, using current market and regulatory dynamics relevant to its region and EV/automotive industry. Each section includes data-backed trends, actionable risks/opportunities and forward-looking insights for strategy and investor use.

 Customizable Excel Spreadsheet
A compact Seres Group PESTLE summary that isolates regulatory, technological, and supply-chain risks to quickly resolve strategic blind spots and accelerate decision-making in meetings or investor decks.
Economic factors

EV demand cyclicality
Macro slowdowns and weak consumer confidence depress big-ticket EV purchases, visible as global EV sales slowed to about 14.2 million in 2024 with China accounting for roughly 9.1 million. Aggressive price wars in China compress margins but lifted volumes, forcing Seres to balance premium tech trims against entry models. Elastic pricing and rigorous cost control—R&D, supply chain and localization—are decisive for margin recovery.
Battery cost trajectory
LFP and high-manganese chemistries have pushed average pack costs down from about 132 USD/kWh in 2023 toward ~110–120 USD/kWh in 2024, with LFP offering ~10–20% savings; metal price volatility (nickel, cobalt) still creates margin risk. Long-term offtakes and recycling can cut input spend by an estimated 10–15%, while pack standardization yields 5–8% BOM savings across models; these cost saves should be reinvested into software and UX to drive value.

Currency and financing
RMB volatility (around 7.3 CNY/USD in mid‑2025) affects Seres export pricing competitiveness and raises costs for imported components; a 5–10% yuan swing can materially change margins. Consumer credit availability and typical auto loan rates of roughly 4–7% in 2024–25 influence retail conversion. Captive finance or dealer partnerships often raise affordability and can lift conversion by around 10–20%. Active hedging (for USD, EUR, JPY) is needed to manage multi‑currency exposure.

Diversification earnings mix
Engines, motorcycles and real estate diversify Seres Group revenues, cushioning cyclicality; ICE-related product lines face structural decline as global electric vehicle adoption—which exceeded 10 million annual sales by 2022—continued rising into 2024. Cross-subsidization from ICE and real-estate cashflows can fund EV R&D amid price competition, while portfolio pruning of low-ROIC assets could lift returns.
- ICE-decline
- Cross-subsidize-EV-R&D
- Real-estate-buffer
- Prune-to-improve-ROIC
Scale and operating leverage
Scale and operating leverage at Seres Group lowers unit costs as higher plant utilization spreads fixed manufacturing overhead, while platform sharing across segments increases parts commonality and simplifies supply chains. Improved distribution efficiency reduces customer acquisition cost and inventory days, and measured expansion mitigates fixed-cost drag on margins.
- higher utilization lowers unit fixed costs
- platform sharing increases parts commonality
- distribution efficiency cuts CAC and inventory days
- measured expansion avoids fixed-cost drag
China NEV 40% sales; EU duty ~38%; CHIPS $52bn; BRI 149
Macro slowdown cut big‑ticket EV demand; global EV sales ~14.2M in 2024 with China ~9.1M, forcing price competition and margin pressure. Pack costs fell toward 110–120 USD/kWh in 2024; LFP offers ~10–20% savings but nickel/cobalt volatility remains. RMB ~7.3 CNY/USD (mid‑2025) and 4–7% auto loan rates affect pricing and conversion; hedging and captive finance lift resilience.
| Metric | Value |
|---|---|
| Global EV sales 2024 | 14.2M |
| China EV sales 2024 | 9.1M |
| Avg pack cost 2024 | 110–120 USD/kWh |
| RMB (mid‑2025) | ~7.3 CNY/USD |
| Auto loan rates 2024–25 | 4–7% |
Preview the Actual Deliverable
Seres Group PESTLE Analysis
The Seres Group PESTLE Analysis offers concise insights into political, economic, social, technological, legal, and environmental factors shaping the company and EV sector. The preview shown here is the exact document you’ll receive after purchase—fully formatted and ready to use. It’s professionally structured for immediate application.

Make Smarter Strategic Decisions with a Complete PESTEL View
Unlock strategic clarity with our PESTLE Analysis of Seres Group — concise, actionable insights into political, economic, social, technological, legal, and environmental forces shaping its trajectory. Perfect for investors and strategists seeking an immediate edge, this brief highlights key risks and opportunities. Purchase the full report to access the complete, ready-to-use analysis and make smarter decisions faster.
Political factors
China NEV industrial policy
China’s NEV industrial policy—central and provincial purchase subsidies now largely phased out—shifts incentives to charging infrastructure and license‑plate privileges, directly shaping Seres’ demand and cost curves; NEVs represented roughly 40% of new car sales in 2024. Policy moves from purchase to usage incentives reduce Seres’ upfront pricing power but raise lifetime value via charging and OTA services. Inclusion in MIIT catalogs and government white lists determines model eligibility for procurement and fleet sales. Close alignment with state decarbonization targets can unlock grants, tax breaks and preferential procurement.
Trade tensions and tariffs
EU provisional anti-subsidy duties on Chinese EVs, announced in 2023 and reaching as high as about 38%, plus heightened U.S. tariff scrutiny in 2023–24, materially squeeze export margins and volumes for Seres. To offset border costs Seres must evaluate CKD/SKD assembly or overseas plants. Retaliatory measures risk reducing parts sales and disrupting supplier networks. Strategic market selection and localized supply chains become critical.
Geopolitical supply chain risk
Export controls on advanced chips, battery inputs and software can derail Seres Group roadmaps given TSMC and Samsung account for roughly 70% of advanced logic capacity and China processes about 60% of battery-grade lithium chemicals; US CHIPS Act funding of $52bn and EU raw materials measures aim to shield supply. Diversifying lithium, nickel and semiconductor suppliers and locking government-backed resource deals can reduce exposure, while rigorous scenario planning is required for sudden regulatory shocks.
Local government support
City-level incentives, land grants and tax holidays materially shape Seres Group plant siting and dealership rollout; China ended national NEV purchase subsidies in 2023, leaving municipalities as primary local incentive providers. Ties with municipal fleets can seed initial volumes, but performance-linked subsidies raise execution and clawback risk. Monitoring local fiscal health is essential to avoid reversals.
- City incentives drive capex/location decisions
- Land grants reduce upfront costs
- Tax holidays aid early cashflow
- Performance clauses increase execution risk
- Monitor municipal fiscal metrics to prevent clawbacks
Overseas market access rules
Overseas market access rules force Seres to navigate differing homologation standards (EU/UNECE vs national rules cover 50+ markets), variable localization mandates and mixed political attitudes to Chinese brands. Participation in Belt and Road markets (149 partner countries) can lower entry barriers but raises exposure to regional instability and tariff/policy shifts. Government-to-government MOUs have shortened approvals in several cases, so a tailored diplomacy-plus-compliance strategy is required.
- homologation: EU/UNECE vs national (50+ markets)
- localization: local content thresholds, tax incentives
- belt-and-road: 149 countries—easier entry, higher political risk
- govt MOUs: accelerate approvals; need diplomacy + compliance
China NEV 40% sales; EU duty ~38%; CHIPS $52bn; BRI 149
China NEV policy shifts to usage/charging incentives after 2023 purchase subsidy end; NEVs ~40% of new car sales in 2024, raising lifetime service revenue but lowering upfront pricing power. EU provisional anti-subsidy duties ~38% and US tariff scrutiny compress export margins; CHIPS Act $52bn heightens semiconductor access risks. Municipal incentives and Belt & Road (149 countries) shape siting and market access.
| Factor | Metric | Immediate Impact |
|---|---|---|
| Domestic policy | NEV 40% (2024) | Service revenue ↑, pricing power ↓ |
| Trade | EU duty ~38% | Export margin compression |
| Supply controls | CHIPS Act $52bn | Semiconductor access risk |
| Market access | Belt & Road 149 | Entry ease vs political risk |
What is included in the product
Detailed Word Document
Explores how macro-environmental factors uniquely affect Seres Group across Political, Economic, Social, Technological, Environmental and Legal dimensions, using current market and regulatory dynamics relevant to its region and EV/automotive industry. Each section includes data-backed trends, actionable risks/opportunities and forward-looking insights for strategy and investor use.
Customizable Excel Spreadsheet
A compact Seres Group PESTLE summary that isolates regulatory, technological, and supply-chain risks to quickly resolve strategic blind spots and accelerate decision-making in meetings or investor decks.
Economic factors
EV demand cyclicality
Macro slowdowns and weak consumer confidence depress big-ticket EV purchases, visible as global EV sales slowed to about 14.2 million in 2024 with China accounting for roughly 9.1 million. Aggressive price wars in China compress margins but lifted volumes, forcing Seres to balance premium tech trims against entry models. Elastic pricing and rigorous cost control—R&D, supply chain and localization—are decisive for margin recovery.
Battery cost trajectory
LFP and high-manganese chemistries have pushed average pack costs down from about 132 USD/kWh in 2023 toward ~110–120 USD/kWh in 2024, with LFP offering ~10–20% savings; metal price volatility (nickel, cobalt) still creates margin risk. Long-term offtakes and recycling can cut input spend by an estimated 10–15%, while pack standardization yields 5–8% BOM savings across models; these cost saves should be reinvested into software and UX to drive value.
Currency and financing
RMB volatility (around 7.3 CNY/USD in mid‑2025) affects Seres export pricing competitiveness and raises costs for imported components; a 5–10% yuan swing can materially change margins. Consumer credit availability and typical auto loan rates of roughly 4–7% in 2024–25 influence retail conversion. Captive finance or dealer partnerships often raise affordability and can lift conversion by around 10–20%. Active hedging (for USD, EUR, JPY) is needed to manage multi‑currency exposure.
Diversification earnings mix
Engines, motorcycles and real estate diversify Seres Group revenues, cushioning cyclicality; ICE-related product lines face structural decline as global electric vehicle adoption—which exceeded 10 million annual sales by 2022—continued rising into 2024. Cross-subsidization from ICE and real-estate cashflows can fund EV R&D amid price competition, while portfolio pruning of low-ROIC assets could lift returns.
- ICE-decline
- Cross-subsidize-EV-R&D
- Real-estate-buffer
- Prune-to-improve-ROIC
Scale and operating leverage
Scale and operating leverage at Seres Group lowers unit costs as higher plant utilization spreads fixed manufacturing overhead, while platform sharing across segments increases parts commonality and simplifies supply chains. Improved distribution efficiency reduces customer acquisition cost and inventory days, and measured expansion mitigates fixed-cost drag on margins.
- higher utilization lowers unit fixed costs
- platform sharing increases parts commonality
- distribution efficiency cuts CAC and inventory days
- measured expansion avoids fixed-cost drag
China NEV 40% sales; EU duty ~38%; CHIPS $52bn; BRI 149
Macro slowdown cut big‑ticket EV demand; global EV sales ~14.2M in 2024 with China ~9.1M, forcing price competition and margin pressure. Pack costs fell toward 110–120 USD/kWh in 2024; LFP offers ~10–20% savings but nickel/cobalt volatility remains. RMB ~7.3 CNY/USD (mid‑2025) and 4–7% auto loan rates affect pricing and conversion; hedging and captive finance lift resilience.
| Metric | Value |
|---|---|
| Global EV sales 2024 | 14.2M |
| China EV sales 2024 | 9.1M |
| Avg pack cost 2024 | 110–120 USD/kWh |
| RMB (mid‑2025) | ~7.3 CNY/USD |
| Auto loan rates 2024–25 | 4–7% |
Preview the Actual Deliverable
Seres Group PESTLE Analysis
The Seres Group PESTLE Analysis offers concise insights into political, economic, social, technological, legal, and environmental factors shaping the company and EV sector. The preview shown here is the exact document you’ll receive after purchase—fully formatted and ready to use. It’s professionally structured for immediate application.
Description
Make Smarter Strategic Decisions with a Complete PESTEL View
Unlock strategic clarity with our PESTLE Analysis of Seres Group — concise, actionable insights into political, economic, social, technological, legal, and environmental forces shaping its trajectory. Perfect for investors and strategists seeking an immediate edge, this brief highlights key risks and opportunities. Purchase the full report to access the complete, ready-to-use analysis and make smarter decisions faster.
Political factors
China NEV industrial policy
China’s NEV industrial policy—central and provincial purchase subsidies now largely phased out—shifts incentives to charging infrastructure and license‑plate privileges, directly shaping Seres’ demand and cost curves; NEVs represented roughly 40% of new car sales in 2024. Policy moves from purchase to usage incentives reduce Seres’ upfront pricing power but raise lifetime value via charging and OTA services. Inclusion in MIIT catalogs and government white lists determines model eligibility for procurement and fleet sales. Close alignment with state decarbonization targets can unlock grants, tax breaks and preferential procurement.
Trade tensions and tariffs
EU provisional anti-subsidy duties on Chinese EVs, announced in 2023 and reaching as high as about 38%, plus heightened U.S. tariff scrutiny in 2023–24, materially squeeze export margins and volumes for Seres. To offset border costs Seres must evaluate CKD/SKD assembly or overseas plants. Retaliatory measures risk reducing parts sales and disrupting supplier networks. Strategic market selection and localized supply chains become critical.
Geopolitical supply chain risk
Export controls on advanced chips, battery inputs and software can derail Seres Group roadmaps given TSMC and Samsung account for roughly 70% of advanced logic capacity and China processes about 60% of battery-grade lithium chemicals; US CHIPS Act funding of $52bn and EU raw materials measures aim to shield supply. Diversifying lithium, nickel and semiconductor suppliers and locking government-backed resource deals can reduce exposure, while rigorous scenario planning is required for sudden regulatory shocks.
Local government support
City-level incentives, land grants and tax holidays materially shape Seres Group plant siting and dealership rollout; China ended national NEV purchase subsidies in 2023, leaving municipalities as primary local incentive providers. Ties with municipal fleets can seed initial volumes, but performance-linked subsidies raise execution and clawback risk. Monitoring local fiscal health is essential to avoid reversals.
- City incentives drive capex/location decisions
- Land grants reduce upfront costs
- Tax holidays aid early cashflow
- Performance clauses increase execution risk
- Monitor municipal fiscal metrics to prevent clawbacks
Overseas market access rules
Overseas market access rules force Seres to navigate differing homologation standards (EU/UNECE vs national rules cover 50+ markets), variable localization mandates and mixed political attitudes to Chinese brands. Participation in Belt and Road markets (149 partner countries) can lower entry barriers but raises exposure to regional instability and tariff/policy shifts. Government-to-government MOUs have shortened approvals in several cases, so a tailored diplomacy-plus-compliance strategy is required.
- homologation: EU/UNECE vs national (50+ markets)
- localization: local content thresholds, tax incentives
- belt-and-road: 149 countries—easier entry, higher political risk
- govt MOUs: accelerate approvals; need diplomacy + compliance
China NEV 40% sales; EU duty ~38%; CHIPS $52bn; BRI 149
China NEV policy shifts to usage/charging incentives after 2023 purchase subsidy end; NEVs ~40% of new car sales in 2024, raising lifetime service revenue but lowering upfront pricing power. EU provisional anti-subsidy duties ~38% and US tariff scrutiny compress export margins; CHIPS Act $52bn heightens semiconductor access risks. Municipal incentives and Belt & Road (149 countries) shape siting and market access.
| Factor | Metric | Immediate Impact |
|---|---|---|
| Domestic policy | NEV 40% (2024) | Service revenue ↑, pricing power ↓ |
| Trade | EU duty ~38% | Export margin compression |
| Supply controls | CHIPS Act $52bn | Semiconductor access risk |
| Market access | Belt & Road 149 | Entry ease vs political risk |
What is included in the product
Detailed Word Document
Explores how macro-environmental factors uniquely affect Seres Group across Political, Economic, Social, Technological, Environmental and Legal dimensions, using current market and regulatory dynamics relevant to its region and EV/automotive industry. Each section includes data-backed trends, actionable risks/opportunities and forward-looking insights for strategy and investor use.
Customizable Excel Spreadsheet
A compact Seres Group PESTLE summary that isolates regulatory, technological, and supply-chain risks to quickly resolve strategic blind spots and accelerate decision-making in meetings or investor decks.
Economic factors
EV demand cyclicality
Macro slowdowns and weak consumer confidence depress big-ticket EV purchases, visible as global EV sales slowed to about 14.2 million in 2024 with China accounting for roughly 9.1 million. Aggressive price wars in China compress margins but lifted volumes, forcing Seres to balance premium tech trims against entry models. Elastic pricing and rigorous cost control—R&D, supply chain and localization—are decisive for margin recovery.
Battery cost trajectory
LFP and high-manganese chemistries have pushed average pack costs down from about 132 USD/kWh in 2023 toward ~110–120 USD/kWh in 2024, with LFP offering ~10–20% savings; metal price volatility (nickel, cobalt) still creates margin risk. Long-term offtakes and recycling can cut input spend by an estimated 10–15%, while pack standardization yields 5–8% BOM savings across models; these cost saves should be reinvested into software and UX to drive value.
Currency and financing
RMB volatility (around 7.3 CNY/USD in mid‑2025) affects Seres export pricing competitiveness and raises costs for imported components; a 5–10% yuan swing can materially change margins. Consumer credit availability and typical auto loan rates of roughly 4–7% in 2024–25 influence retail conversion. Captive finance or dealer partnerships often raise affordability and can lift conversion by around 10–20%. Active hedging (for USD, EUR, JPY) is needed to manage multi‑currency exposure.
Diversification earnings mix
Engines, motorcycles and real estate diversify Seres Group revenues, cushioning cyclicality; ICE-related product lines face structural decline as global electric vehicle adoption—which exceeded 10 million annual sales by 2022—continued rising into 2024. Cross-subsidization from ICE and real-estate cashflows can fund EV R&D amid price competition, while portfolio pruning of low-ROIC assets could lift returns.
- ICE-decline
- Cross-subsidize-EV-R&D
- Real-estate-buffer
- Prune-to-improve-ROIC
Scale and operating leverage
Scale and operating leverage at Seres Group lowers unit costs as higher plant utilization spreads fixed manufacturing overhead, while platform sharing across segments increases parts commonality and simplifies supply chains. Improved distribution efficiency reduces customer acquisition cost and inventory days, and measured expansion mitigates fixed-cost drag on margins.
- higher utilization lowers unit fixed costs
- platform sharing increases parts commonality
- distribution efficiency cuts CAC and inventory days
- measured expansion avoids fixed-cost drag
China NEV 40% sales; EU duty ~38%; CHIPS $52bn; BRI 149
Macro slowdown cut big‑ticket EV demand; global EV sales ~14.2M in 2024 with China ~9.1M, forcing price competition and margin pressure. Pack costs fell toward 110–120 USD/kWh in 2024; LFP offers ~10–20% savings but nickel/cobalt volatility remains. RMB ~7.3 CNY/USD (mid‑2025) and 4–7% auto loan rates affect pricing and conversion; hedging and captive finance lift resilience.
| Metric | Value |
|---|---|
| Global EV sales 2024 | 14.2M |
| China EV sales 2024 | 9.1M |
| Avg pack cost 2024 | 110–120 USD/kWh |
| RMB (mid‑2025) | ~7.3 CNY/USD |
| Auto loan rates 2024–25 | 4–7% |
Preview the Actual Deliverable
Seres Group PESTLE Analysis
The Seres Group PESTLE Analysis offers concise insights into political, economic, social, technological, legal, and environmental factors shaping the company and EV sector. The preview shown here is the exact document you’ll receive after purchase—fully formatted and ready to use. It’s professionally structured for immediate application.











