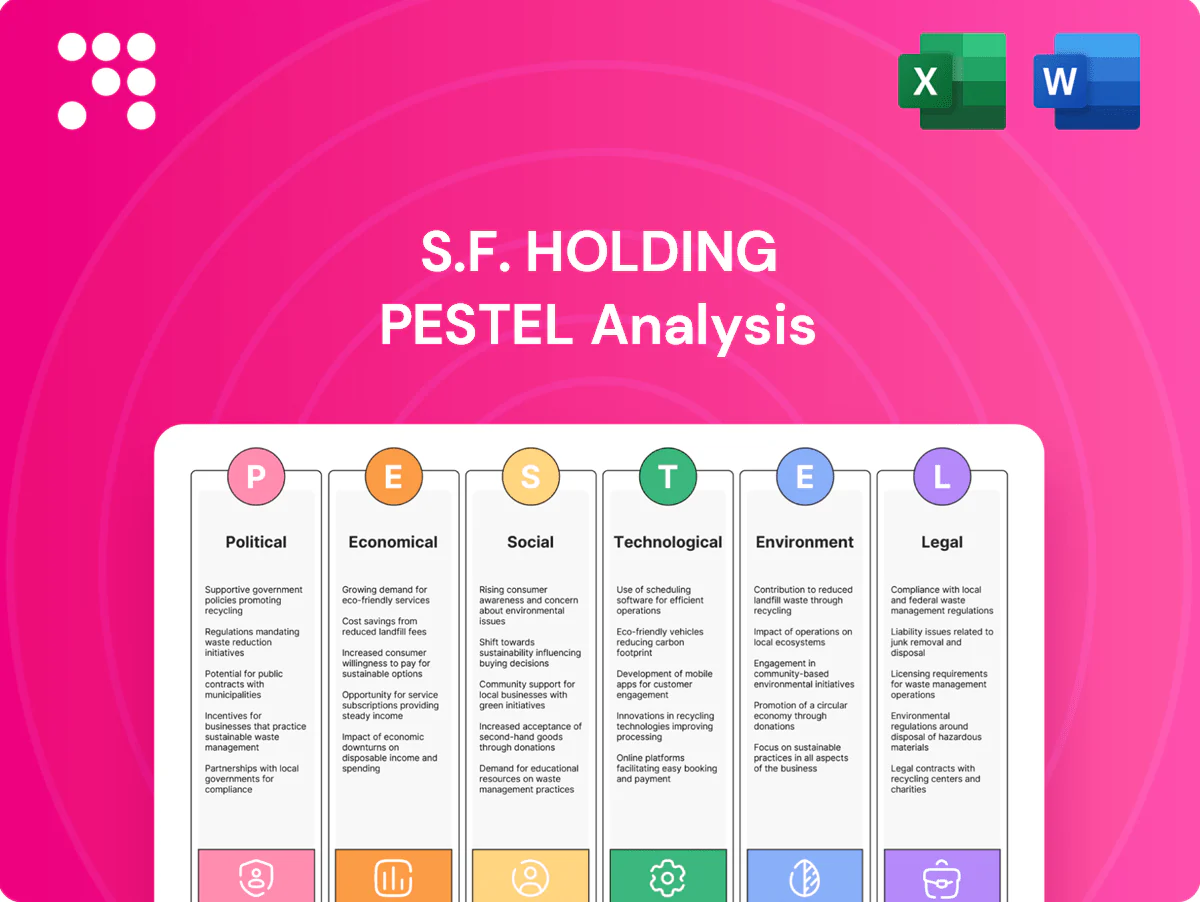
S.F. Holding PESTLE Analysis

Skip the Research. Get the Strategy.
Discover how political, economic, social, technological, legal and environmental forces shape S.F. Holding’s strategy and risk profile. Our concise PESTLE highlights regulation, logistics trends, digital transformation and sustainability pressures—insights tailored for investors and strategists. Purchase the full, editable analysis for a detailed roadmap and actionable recommendations.
Political factors

State logistics and infrastructure policy
China treats logistics as a strategic sector—its logistics market exceeded RMB 15 trillion in 2023—shaping air-cargo routes, bonded zones and hub approvals that determine S.F. Holding’s network footprint. S.F. benefits from targeted infrastructure investment but must align investments with national development plans and customs/bonded-zone policies. Changes in subsidy focus or capacity allocation can materially shift cost structures and service levels, so close public–private coordination is essential for planned network expansion.
Cross-border trade and customs regimes
Customs digitization and trade facilitation shorten international express lead times, while changes in tariffs, de minimis rules (US de minimis US$800; EU removed low‑value VAT relief in July 2021) and inspection intensity can swing pricing and demand. RCEP, in force since Jan 1 2022, covers roughly 30% of global GDP and can unlock volume growth for SF. Geopolitical frictions, however, add clearance delays; SF’s brokerage capabilities mitigate variability but increase compliance costs and operational complexity.

Geopolitical and airspace risks
Airspace restrictions and bilateral aviation rights materially influence SF’s air network utilization, forcing reroutes that extend block hours; SF Airlines operates over 70 freighters, increasing exposure. Geopolitical tensions since 2022 have driven fuel-driven block-hour costs and insurance premiums higher, with fuel representing roughly 20–30% of airline operating costs. Export controls on high-tech goods (tightened 2022–24) complicate shipment mix and screening. Diversified routing and fleet planning reduce disruption exposure.

Local government regulation and permits
Provincial and municipal rules govern S.F. Holding’s last-mile operations, facility siting and vehicle access, with last-mile accounting for up to 53% of total logistics costs. Urban traffic controls and delivery time windows cut productivity and extend dwell times; urban consolidation centers have reduced inner-city vehicle-km by 20–30% in trials. Securing permits for electric fleets and consolidation hubs is operationally critical amid divergent city policies.
- Regulation scope: provincial + municipal
- Cost impact: last-mile up to 53%
- UCC impact: −20–30% vehicle-km
- Execution risk: high policy variability across cities
Government data governance priorities
China’s Data Security Law (2021) and Personal Information Protection Law (2021), alongside Critical Information Infrastructure (CII) rules, constrain logistics data handling and force localization and CAC cross-border security assessments (implemented 2022). Political emphasis on supply-chain resilience raises reporting/visibility for public projects; PIPL fines can reach 50 million RMB or 5% of annual turnover, increasing compliance costs.
- Regulations: DSL, PIPL (2021)
- Cross-border: CAC security assessments since 2022
- Fines: up to 50 million RMB or 5% of annual turnover
- Impact: stricter IT architecture, higher compliance costs
Political rules raise Chinese logistics firms' fuel, insurance, compliance and IT costs
Political drivers shape S.F. Holding via strategic logistics policy (China logistics market RMB 15 trillion in 2023), trade regimes (RCEP since 1 Jan 2022) and airspace/export controls that raise fuel/insurance and compliance costs; provincial city rules dictate last‑mile limits (up to 53% cost) and data laws (PIPL fines up to RMB 50m or 5% turnover) increase IT/localization spend.
| Metric | Value |
|---|---|
| China logistics market | RMB 15 tn (2023) |
| RCEP | In force 1‑Jan‑2022 (~30% global GDP) |
| SF Airlines fleet | >70 freighters |
| Last‑mile cost | Up to 53% |
| PIPL fines | RMB 50m or 5% turnover |
What is included in the product
 Detailed Word Document
Explores how Political, Economic, Social, Technological, Environmental and Legal forces uniquely impact S.F. Holding, with data-driven, region- and industry-specific insights; designed for executives and investors, formatted for reports and decks, and offering forward-looking scenarios to spot risks, opportunities and strategic responses.

 Customizable Excel Spreadsheet
Concise PESTLE summary of S.F. Holding that streamlines external risk assessment for faster decision-making and meeting prep. Visually segmented and editable for region- or line-specific notes, making it easy to share across teams and drop into slides or strategy packs.
Economic factors

E-commerce growth and consumption cycles
Parcel volumes closely track online retail expansion — global e-commerce is projected to reach about $7.4 trillion by 2025, driving volume growth and mirroring consumer sentiment shifts. Economic downturns push mix toward economy services, compressing yields and margins. Major promotions create sharp seasonal peaks that demand elastic capacity. SF’s premium and economy tiers provide pricing and capacity levers to manage this volatility.
Fuel, labor, and aircraft cost inflation
Jet fuel and trucking diesel are major variable costs for S.F. Holding; US diesel averaged about $3.70/gal in 2024 and Brent crude ~85 USD/bbl, driving frequent surcharge adjustments. Urban wage pressures and pilot scarcity — Boeing forecast ~650,000 pilot demand over 20 years and pilot pay rose ~10% in 2023–24 — squeeze margins. Rising aircraft lease rates (narrowbody ~200–350k USD/month) and heavier maintenance cycles raise capital intensity. Profitability hinges on cost pass-through, historically 70–90% effective for fuel surcharges.

Exchange rates and global trade flows
RMB volatility (USD/CNY around 7.15 in mid-2025) alters international pricing and raises foreign‑denominated input costs for S.F. Holding, squeezing margins on cross-border services. Global trade softness has reduced cross‑border express and freight forwarding volumes, while reshoring and nearshoring shift lane balances and lower asset utilization in once‑dense routes. Active hedging and diversification across lanes help mitigate currency swings and volume volatility.

B2B supply chain and industrial activity
Manufacturing PMI fluctuations directly steer contract logistics and freight volumes; a recovering PMI lifts freight demand and warehousing utilization for SF Holding.
Electronics, pharmaceuticals, and cold chain segments command higher margins due to specialized handling and rising e-commerce medical and refrigerated flows.
Capex cycles of anchor clients determine timing and scale of SF’s warehouse and fleet investments, with upcycles prompting rapid capacity expansion.
SF’s integrated end-to-end solutions—warehousing, last-mile, cold chain—allow capture of upstream and downstream value during demand upswings.
- Manufacturing PMI → logistics demand
- Electronics/pharma/cold chain → premium margins
- Client capex cycles → warehouse/fleet capex
- Integrated solutions → end-to-end value capture
Capital market access and financing costs
Rising benchmark rates (US fed funds 5.25–5.50% in 2024, 10‑yr Treasury ~4.0–4.5%) lengthen payback for fleet expansion, hubs and automation and raise financing costs. Equity/bond market depth dictates growth pacing and M&A tempo; prudent net debt/EBITDA around 2–3x preserves network reliability. Government green financing programs can cut WACC via concessional pricing.
- Interest rates: 5.25–5.50%
- 10‑yr yield: ~4.0–4.5%
- Leverage target: net debt/EBITDA 2–3x
- Green finance: reduces WACC
Political rules raise Chinese logistics firms' fuel, insurance, compliance and IT costs
Parcel volumes follow e‑commerce (~$7.4T by 2025), fuel/diesel (US ~$3.70/gal in 2024; Brent ~$85/bbl) and RMB volatility (USD/CNY ~7.15 mid‑2025) to shape yields; wage and pilot shortages (pilot demand ~650k next 20 years) and rising lease rates (narrowbody $200–350k/mo) compress margins; interest rates (Fed 5.25–5.50%, 10yr ~4.0–4.5%) lengthen payback for capex.
| Metric | Value |
|---|---|
| E‑commerce 2025 | $7.4T |
| USD/CNY | 7.15 |
| Fed rate | 5.25–5.50% |
Full Version Awaits
S.F. Holding PESTLE Analysis
The preview shown here is the exact S.F. Holding PESTLE Analysis document you’ll receive after purchase—fully formatted and ready to use. The content, layout, and structure in this screenshot are the final file. No placeholders or teasers—what you see is what you’ll download immediately after payment. Use it directly for reports, presentations, or strategic planning.

Skip the Research. Get the Strategy.
Discover how political, economic, social, technological, legal and environmental forces shape S.F. Holding’s strategy and risk profile. Our concise PESTLE highlights regulation, logistics trends, digital transformation and sustainability pressures—insights tailored for investors and strategists. Purchase the full, editable analysis for a detailed roadmap and actionable recommendations.
Political factors
State logistics and infrastructure policy
China treats logistics as a strategic sector—its logistics market exceeded RMB 15 trillion in 2023—shaping air-cargo routes, bonded zones and hub approvals that determine S.F. Holding’s network footprint. S.F. benefits from targeted infrastructure investment but must align investments with national development plans and customs/bonded-zone policies. Changes in subsidy focus or capacity allocation can materially shift cost structures and service levels, so close public–private coordination is essential for planned network expansion.
Cross-border trade and customs regimes
Customs digitization and trade facilitation shorten international express lead times, while changes in tariffs, de minimis rules (US de minimis US$800; EU removed low‑value VAT relief in July 2021) and inspection intensity can swing pricing and demand. RCEP, in force since Jan 1 2022, covers roughly 30% of global GDP and can unlock volume growth for SF. Geopolitical frictions, however, add clearance delays; SF’s brokerage capabilities mitigate variability but increase compliance costs and operational complexity.
Geopolitical and airspace risks
Airspace restrictions and bilateral aviation rights materially influence SF’s air network utilization, forcing reroutes that extend block hours; SF Airlines operates over 70 freighters, increasing exposure. Geopolitical tensions since 2022 have driven fuel-driven block-hour costs and insurance premiums higher, with fuel representing roughly 20–30% of airline operating costs. Export controls on high-tech goods (tightened 2022–24) complicate shipment mix and screening. Diversified routing and fleet planning reduce disruption exposure.
Local government regulation and permits
Provincial and municipal rules govern S.F. Holding’s last-mile operations, facility siting and vehicle access, with last-mile accounting for up to 53% of total logistics costs. Urban traffic controls and delivery time windows cut productivity and extend dwell times; urban consolidation centers have reduced inner-city vehicle-km by 20–30% in trials. Securing permits for electric fleets and consolidation hubs is operationally critical amid divergent city policies.
- Regulation scope: provincial + municipal
- Cost impact: last-mile up to 53%
- UCC impact: −20–30% vehicle-km
- Execution risk: high policy variability across cities
Government data governance priorities
China’s Data Security Law (2021) and Personal Information Protection Law (2021), alongside Critical Information Infrastructure (CII) rules, constrain logistics data handling and force localization and CAC cross-border security assessments (implemented 2022). Political emphasis on supply-chain resilience raises reporting/visibility for public projects; PIPL fines can reach 50 million RMB or 5% of annual turnover, increasing compliance costs.
- Regulations: DSL, PIPL (2021)
- Cross-border: CAC security assessments since 2022
- Fines: up to 50 million RMB or 5% of annual turnover
- Impact: stricter IT architecture, higher compliance costs
Political rules raise Chinese logistics firms' fuel, insurance, compliance and IT costs
Political drivers shape S.F. Holding via strategic logistics policy (China logistics market RMB 15 trillion in 2023), trade regimes (RCEP since 1 Jan 2022) and airspace/export controls that raise fuel/insurance and compliance costs; provincial city rules dictate last‑mile limits (up to 53% cost) and data laws (PIPL fines up to RMB 50m or 5% turnover) increase IT/localization spend.
| Metric | Value |
|---|---|
| China logistics market | RMB 15 tn (2023) |
| RCEP | In force 1‑Jan‑2022 (~30% global GDP) |
| SF Airlines fleet | >70 freighters |
| Last‑mile cost | Up to 53% |
| PIPL fines | RMB 50m or 5% turnover |
What is included in the product
Detailed Word Document
Explores how Political, Economic, Social, Technological, Environmental and Legal forces uniquely impact S.F. Holding, with data-driven, region- and industry-specific insights; designed for executives and investors, formatted for reports and decks, and offering forward-looking scenarios to spot risks, opportunities and strategic responses.
Customizable Excel Spreadsheet
Concise PESTLE summary of S.F. Holding that streamlines external risk assessment for faster decision-making and meeting prep. Visually segmented and editable for region- or line-specific notes, making it easy to share across teams and drop into slides or strategy packs.
Economic factors
E-commerce growth and consumption cycles
Parcel volumes closely track online retail expansion — global e-commerce is projected to reach about $7.4 trillion by 2025, driving volume growth and mirroring consumer sentiment shifts. Economic downturns push mix toward economy services, compressing yields and margins. Major promotions create sharp seasonal peaks that demand elastic capacity. SF’s premium and economy tiers provide pricing and capacity levers to manage this volatility.
Fuel, labor, and aircraft cost inflation
Jet fuel and trucking diesel are major variable costs for S.F. Holding; US diesel averaged about $3.70/gal in 2024 and Brent crude ~85 USD/bbl, driving frequent surcharge adjustments. Urban wage pressures and pilot scarcity — Boeing forecast ~650,000 pilot demand over 20 years and pilot pay rose ~10% in 2023–24 — squeeze margins. Rising aircraft lease rates (narrowbody ~200–350k USD/month) and heavier maintenance cycles raise capital intensity. Profitability hinges on cost pass-through, historically 70–90% effective for fuel surcharges.
Exchange rates and global trade flows
RMB volatility (USD/CNY around 7.15 in mid-2025) alters international pricing and raises foreign‑denominated input costs for S.F. Holding, squeezing margins on cross-border services. Global trade softness has reduced cross‑border express and freight forwarding volumes, while reshoring and nearshoring shift lane balances and lower asset utilization in once‑dense routes. Active hedging and diversification across lanes help mitigate currency swings and volume volatility.
B2B supply chain and industrial activity
Manufacturing PMI fluctuations directly steer contract logistics and freight volumes; a recovering PMI lifts freight demand and warehousing utilization for SF Holding.
Electronics, pharmaceuticals, and cold chain segments command higher margins due to specialized handling and rising e-commerce medical and refrigerated flows.
Capex cycles of anchor clients determine timing and scale of SF’s warehouse and fleet investments, with upcycles prompting rapid capacity expansion.
SF’s integrated end-to-end solutions—warehousing, last-mile, cold chain—allow capture of upstream and downstream value during demand upswings.
- Manufacturing PMI → logistics demand
- Electronics/pharma/cold chain → premium margins
- Client capex cycles → warehouse/fleet capex
- Integrated solutions → end-to-end value capture
Capital market access and financing costs
Rising benchmark rates (US fed funds 5.25–5.50% in 2024, 10‑yr Treasury ~4.0–4.5%) lengthen payback for fleet expansion, hubs and automation and raise financing costs. Equity/bond market depth dictates growth pacing and M&A tempo; prudent net debt/EBITDA around 2–3x preserves network reliability. Government green financing programs can cut WACC via concessional pricing.
- Interest rates: 5.25–5.50%
- 10‑yr yield: ~4.0–4.5%
- Leverage target: net debt/EBITDA 2–3x
- Green finance: reduces WACC
Political rules raise Chinese logistics firms' fuel, insurance, compliance and IT costs
Parcel volumes follow e‑commerce (~$7.4T by 2025), fuel/diesel (US ~$3.70/gal in 2024; Brent ~$85/bbl) and RMB volatility (USD/CNY ~7.15 mid‑2025) to shape yields; wage and pilot shortages (pilot demand ~650k next 20 years) and rising lease rates (narrowbody $200–350k/mo) compress margins; interest rates (Fed 5.25–5.50%, 10yr ~4.0–4.5%) lengthen payback for capex.
| Metric | Value |
|---|---|
| E‑commerce 2025 | $7.4T |
| USD/CNY | 7.15 |
| Fed rate | 5.25–5.50% |
Full Version Awaits
S.F. Holding PESTLE Analysis
The preview shown here is the exact S.F. Holding PESTLE Analysis document you’ll receive after purchase—fully formatted and ready to use. The content, layout, and structure in this screenshot are the final file. No placeholders or teasers—what you see is what you’ll download immediately after payment. Use it directly for reports, presentations, or strategic planning.
Original: $10.00
-65%$10.00
$3.50Description
Skip the Research. Get the Strategy.
Discover how political, economic, social, technological, legal and environmental forces shape S.F. Holding’s strategy and risk profile. Our concise PESTLE highlights regulation, logistics trends, digital transformation and sustainability pressures—insights tailored for investors and strategists. Purchase the full, editable analysis for a detailed roadmap and actionable recommendations.
Political factors
State logistics and infrastructure policy
China treats logistics as a strategic sector—its logistics market exceeded RMB 15 trillion in 2023—shaping air-cargo routes, bonded zones and hub approvals that determine S.F. Holding’s network footprint. S.F. benefits from targeted infrastructure investment but must align investments with national development plans and customs/bonded-zone policies. Changes in subsidy focus or capacity allocation can materially shift cost structures and service levels, so close public–private coordination is essential for planned network expansion.
Cross-border trade and customs regimes
Customs digitization and trade facilitation shorten international express lead times, while changes in tariffs, de minimis rules (US de minimis US$800; EU removed low‑value VAT relief in July 2021) and inspection intensity can swing pricing and demand. RCEP, in force since Jan 1 2022, covers roughly 30% of global GDP and can unlock volume growth for SF. Geopolitical frictions, however, add clearance delays; SF’s brokerage capabilities mitigate variability but increase compliance costs and operational complexity.
Geopolitical and airspace risks
Airspace restrictions and bilateral aviation rights materially influence SF’s air network utilization, forcing reroutes that extend block hours; SF Airlines operates over 70 freighters, increasing exposure. Geopolitical tensions since 2022 have driven fuel-driven block-hour costs and insurance premiums higher, with fuel representing roughly 20–30% of airline operating costs. Export controls on high-tech goods (tightened 2022–24) complicate shipment mix and screening. Diversified routing and fleet planning reduce disruption exposure.
Local government regulation and permits
Provincial and municipal rules govern S.F. Holding’s last-mile operations, facility siting and vehicle access, with last-mile accounting for up to 53% of total logistics costs. Urban traffic controls and delivery time windows cut productivity and extend dwell times; urban consolidation centers have reduced inner-city vehicle-km by 20–30% in trials. Securing permits for electric fleets and consolidation hubs is operationally critical amid divergent city policies.
- Regulation scope: provincial + municipal
- Cost impact: last-mile up to 53%
- UCC impact: −20–30% vehicle-km
- Execution risk: high policy variability across cities
Government data governance priorities
China’s Data Security Law (2021) and Personal Information Protection Law (2021), alongside Critical Information Infrastructure (CII) rules, constrain logistics data handling and force localization and CAC cross-border security assessments (implemented 2022). Political emphasis on supply-chain resilience raises reporting/visibility for public projects; PIPL fines can reach 50 million RMB or 5% of annual turnover, increasing compliance costs.
- Regulations: DSL, PIPL (2021)
- Cross-border: CAC security assessments since 2022
- Fines: up to 50 million RMB or 5% of annual turnover
- Impact: stricter IT architecture, higher compliance costs
Political rules raise Chinese logistics firms' fuel, insurance, compliance and IT costs
Political drivers shape S.F. Holding via strategic logistics policy (China logistics market RMB 15 trillion in 2023), trade regimes (RCEP since 1 Jan 2022) and airspace/export controls that raise fuel/insurance and compliance costs; provincial city rules dictate last‑mile limits (up to 53% cost) and data laws (PIPL fines up to RMB 50m or 5% turnover) increase IT/localization spend.
| Metric | Value |
|---|---|
| China logistics market | RMB 15 tn (2023) |
| RCEP | In force 1‑Jan‑2022 (~30% global GDP) |
| SF Airlines fleet | >70 freighters |
| Last‑mile cost | Up to 53% |
| PIPL fines | RMB 50m or 5% turnover |
What is included in the product
Detailed Word Document
Explores how Political, Economic, Social, Technological, Environmental and Legal forces uniquely impact S.F. Holding, with data-driven, region- and industry-specific insights; designed for executives and investors, formatted for reports and decks, and offering forward-looking scenarios to spot risks, opportunities and strategic responses.
Customizable Excel Spreadsheet
Concise PESTLE summary of S.F. Holding that streamlines external risk assessment for faster decision-making and meeting prep. Visually segmented and editable for region- or line-specific notes, making it easy to share across teams and drop into slides or strategy packs.
Economic factors
E-commerce growth and consumption cycles
Parcel volumes closely track online retail expansion — global e-commerce is projected to reach about $7.4 trillion by 2025, driving volume growth and mirroring consumer sentiment shifts. Economic downturns push mix toward economy services, compressing yields and margins. Major promotions create sharp seasonal peaks that demand elastic capacity. SF’s premium and economy tiers provide pricing and capacity levers to manage this volatility.
Fuel, labor, and aircraft cost inflation
Jet fuel and trucking diesel are major variable costs for S.F. Holding; US diesel averaged about $3.70/gal in 2024 and Brent crude ~85 USD/bbl, driving frequent surcharge adjustments. Urban wage pressures and pilot scarcity — Boeing forecast ~650,000 pilot demand over 20 years and pilot pay rose ~10% in 2023–24 — squeeze margins. Rising aircraft lease rates (narrowbody ~200–350k USD/month) and heavier maintenance cycles raise capital intensity. Profitability hinges on cost pass-through, historically 70–90% effective for fuel surcharges.
Exchange rates and global trade flows
RMB volatility (USD/CNY around 7.15 in mid-2025) alters international pricing and raises foreign‑denominated input costs for S.F. Holding, squeezing margins on cross-border services. Global trade softness has reduced cross‑border express and freight forwarding volumes, while reshoring and nearshoring shift lane balances and lower asset utilization in once‑dense routes. Active hedging and diversification across lanes help mitigate currency swings and volume volatility.
B2B supply chain and industrial activity
Manufacturing PMI fluctuations directly steer contract logistics and freight volumes; a recovering PMI lifts freight demand and warehousing utilization for SF Holding.
Electronics, pharmaceuticals, and cold chain segments command higher margins due to specialized handling and rising e-commerce medical and refrigerated flows.
Capex cycles of anchor clients determine timing and scale of SF’s warehouse and fleet investments, with upcycles prompting rapid capacity expansion.
SF’s integrated end-to-end solutions—warehousing, last-mile, cold chain—allow capture of upstream and downstream value during demand upswings.
- Manufacturing PMI → logistics demand
- Electronics/pharma/cold chain → premium margins
- Client capex cycles → warehouse/fleet capex
- Integrated solutions → end-to-end value capture
Capital market access and financing costs
Rising benchmark rates (US fed funds 5.25–5.50% in 2024, 10‑yr Treasury ~4.0–4.5%) lengthen payback for fleet expansion, hubs and automation and raise financing costs. Equity/bond market depth dictates growth pacing and M&A tempo; prudent net debt/EBITDA around 2–3x preserves network reliability. Government green financing programs can cut WACC via concessional pricing.
- Interest rates: 5.25–5.50%
- 10‑yr yield: ~4.0–4.5%
- Leverage target: net debt/EBITDA 2–3x
- Green finance: reduces WACC
Political rules raise Chinese logistics firms' fuel, insurance, compliance and IT costs
Parcel volumes follow e‑commerce (~$7.4T by 2025), fuel/diesel (US ~$3.70/gal in 2024; Brent ~$85/bbl) and RMB volatility (USD/CNY ~7.15 mid‑2025) to shape yields; wage and pilot shortages (pilot demand ~650k next 20 years) and rising lease rates (narrowbody $200–350k/mo) compress margins; interest rates (Fed 5.25–5.50%, 10yr ~4.0–4.5%) lengthen payback for capex.
| Metric | Value |
|---|---|
| E‑commerce 2025 | $7.4T |
| USD/CNY | 7.15 |
| Fed rate | 5.25–5.50% |
Full Version Awaits
S.F. Holding PESTLE Analysis
The preview shown here is the exact S.F. Holding PESTLE Analysis document you’ll receive after purchase—fully formatted and ready to use. The content, layout, and structure in this screenshot are the final file. No placeholders or teasers—what you see is what you’ll download immediately after payment. Use it directly for reports, presentations, or strategic planning.











