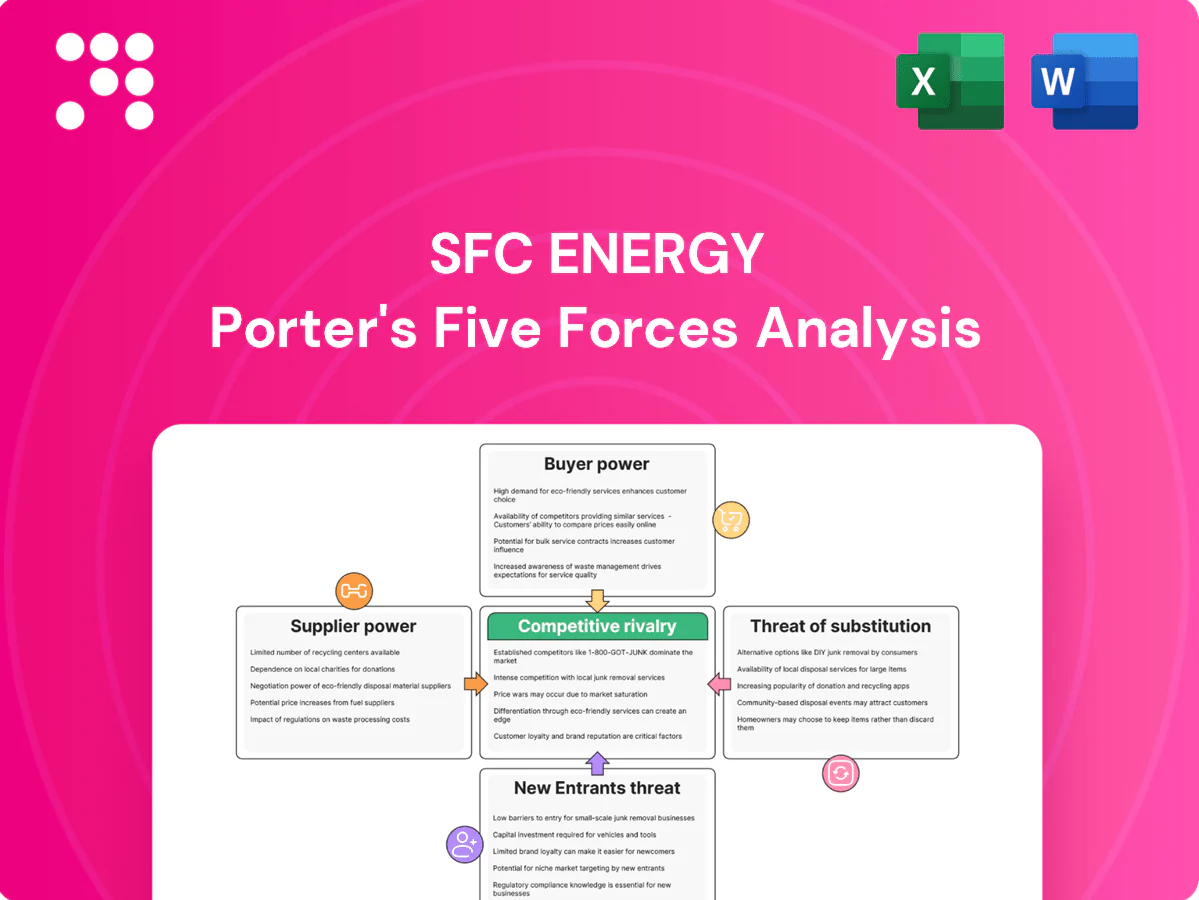
SFC Energy Porter's Five Forces Analysis

Don't Miss the Bigger Picture
SFC Energy’s Porter's Five Forces snapshot highlights supplier leverage in fuel-cell components, moderate buyer power from industrial clients, limited substitutes for off-grid power, and competitive rivalry from niche cleantech firms—threat of new entrants is tempered by certification and tech barriers. This brief teases strategic insights; unlock the full Porter's Five Forces Analysis for force-by-force ratings, visuals, and actionable recommendations.
Suppliers Bargaining Power

Scarce catalyst metals
Platinum-group catalysts are sourced from a concentrated supplier base (South Africa ~70% of platinum mine supply in 2024; Russia ~40% of palladium), giving suppliers strong leverage. 2024 average prices: platinum ~$1,050/oz, palladium ~$1,300/oz, directly pushing SFC Energy stack costs and compressing margins. Long-term offtakes and recycling (recovering ~20–30% of PGM demand) mitigate but do not eliminate exposure. Geopolitical or ESG disruptions can still ripple into multi-week production delays.
Specialized MEA components
Membrane electrode assemblies, bipolar plates and ionomer resins are supplied by a small set of qualified vendors due to tight specifications, creating concentrated supplier power. Industry reports (2024) show MEA lead times commonly at 12–24 weeks, and requalification/durability testing for new suppliers often takes 6–12 months, raising switching costs. Suppliers with proven reliability command premium pricing and priority lead times. Dual-sourcing is feasible but typically extends validation cycles by 3–9 months.

Hydrogen and methanol logistics
Continuous access to high-purity hydrogen and methanol relies on regional distributors and transport safety regimes; IEA reports global hydrogen demand was 94 Mt (2021) and methanol output ~110 Mt (2022), underscoring large, concentrated flows. In remote/off-grid cases delivery constraints and safety-driven routing give local suppliers clear negotiating leverage. Long-term supply contracts and on-site storage lower but do not remove dependency. Fuel purity directly affects fuel-cell stack life, forcing tighter vendor specs and premium pricing.

Power electronics and semiconductors
Power electronics (inverters, DC-DC converters, control boards) depend on niche semiconductors; lead times peaked near 22 weeks in 2021–22 and eased to ~14 weeks by 2024, showing suppliers can reprioritize large-volume customers and tighten allocations. Design-for-substitution mitigates risk but certification cycles often take 6–12 months, so volume commitments and 3–9 months of strategic inventory remain critical to secure supply.
- Supplier concentration: high
- Lead time 2024: ~14 weeks
- Certification lag: 6–12 months
- Recommended inventory: 3–9 months
Custom manufacturing tooling
Custom tooling for stack assembly and coating lines creates supplier leverage: 2024 industry data show tooling investments of roughly €0.5–2.0m with lead times of 6–12 months, making upgrades or replacements potential capacity bottlenecks; service contracts and spare parts typically carry 20–40% markups; bringing tooling in-house reduces supplier power but raises fixed CapEx and operating overhead.
- Tooling cost range: €0.5–2.0m (2024)
- Lead times: 6–12 months (2024)
- Spare parts/service markups: 20–40%
- In‑house: lowers supplier leverage but increases fixed CapEx
Supplier risk: Pt $1,050/oz, Pd $1,300/oz, MEA 12-24 wks
Suppliers exert high bargaining power due to concentrated PGM and MEA vendors, long lead times and costly requalification; 2024 PGM prices (Pt ~$1,050/oz, Pd ~$1,300/oz) and MEA lead times (12–24 weeks) squeeze margins. Dual‑sourcing and recycling mitigate risk but require capex and inventory (recommended 3–9 months).
| Metric | 2024 Value |
|---|---|
| Pt price | $1,050/oz |
| Pd price | $1,300/oz |
| MEA lead time | 12–24 weeks |
| Recommended inventory | 3–9 months |
What is included in the product
 Detailed Word Document
Comprehensive Porter’s Five Forces analysis for SFC Energy revealing competitive intensity, supplier and buyer power, threat of substitutes and entrants, plus strategic vulnerabilities and opportunities shaping its profitability.

 Customizable Excel Spreadsheet
A clear one-sheet Porter’s Five Forces for SFC Energy that instantly highlights strategic pressures, offers customizable force levels and spider-chart visualization, requires no macros, and plugs into decks or dashboards to relieve analysis bottlenecks and speed high-quality decision-making.
Customers Bargaining Power

Concentrated enterprise buyers
Defense, industrial and telecom clients buy in multi-million-euro batches, giving them leverage to negotiate price and service levels. Competitive tenders are common and frequently compress supplier margins, pushing vendors to offer customization and systems integration as baseline requirements. Long multi-year lifecycles (often 3–7 years) and extended support contracts further increase buyer influence over terms and pricing.
High performance switching costs
Once installed, SFC Energy systems embed into site design, safety and maintenance regimes, creating high switching costs that reduce buyer leverage post-installation. Upfront buyers commonly run multi-vendor pilots, often evaluating 2–4 suppliers to preserve options. Performance warranties typically run 12–36 months and SLAs target 99.9% uptime, remaining key negotiation levers.

Total cost of ownership focus
Customers in 2024 benchmark CAPEX, fuel logistics, uptime and maintenance of SFC Energy fuel-cell systems directly against diesel gensets and battery systems, demanding transparent TCO models and payback analyses (buyers typically target 3–7 year paybacks). Fuel can represent ≈65% of diesel genset OPEX, so fuel-price pass-throughs are frequently contested in contracts. Proven field reliability reduces required discounting and buyer price pressure.

Global compliance requirements
Buyers demand adherence to defense, industrial and environmental standards across jurisdictions, with export controls like ITAR and data rules such as GDPR (fines up to 4% of global turnover or €20m) raising buyer sensitivity to supplier compliance. Vendors with multi-standard certification reduce buyer risk and can weaken buyer bargaining power, while failure to meet niche specs can fully exclude a supplier.
- Certification breadth as leverage
- ITAR/Export controls shape access
- GDPR fines increase compliance premium
Option to defer purchases
Buyers can defer SFC Energy purchases in volatile energy markets, gaining timing leverage as projects are postponed and budgets are reallocated across 2023–2024 funding cycles in public and enterprise sectors.
Framework agreements with volume-flex clauses smooth demand while diversified backlog reduces exposure to any single buyer’s deferral risk.
- Timing leverage from deferrals
- Budget-cycle amplification
- Volume-flex frameworks
- Backlog diversification
Buyers wield pre-purchase leverage: pilots, long lifecycles, tight SLAs, fuel-led TCO disputes
Large defense, industrial and telecom orders (multi‑million-euro) and competitive 2–4 supplier pilots give buyers strong pre‑purchase leverage, driving tight margins and customization demands. Long 3–7 year lifecycles, 12–36 month warranties and 99.9% SLAs increase negotiation on pricing and support. Buyers benchmark TCO vs diesel/battery (3–7 year payback); fuel ≈65% of diesel OPEX, raising disputes on pass‑throughs. Certifications (ITAR, GDPR) and multi‑standard compliance materially alter buyer risk and leverage.
| Metric | Value |
|---|---|
| Pilot vendors | 2–4 |
| Payback target | 3–7 yrs |
| Diesel fuel OPEX | ≈65% |
| SLA | 99.9% |
Same Document Delivered
SFC Energy Porter's Five Forces Analysis
This preview is the exact Porter's Five Forces analysis for SFC Energy you’ll receive—no samples, placeholders, or edits. The document shown is the final, professionally formatted file, ready for immediate download and use upon purchase. What you see here is precisely what will be delivered to you.

Don't Miss the Bigger Picture
SFC Energy’s Porter's Five Forces snapshot highlights supplier leverage in fuel-cell components, moderate buyer power from industrial clients, limited substitutes for off-grid power, and competitive rivalry from niche cleantech firms—threat of new entrants is tempered by certification and tech barriers. This brief teases strategic insights; unlock the full Porter's Five Forces Analysis for force-by-force ratings, visuals, and actionable recommendations.
Suppliers Bargaining Power
Scarce catalyst metals
Platinum-group catalysts are sourced from a concentrated supplier base (South Africa ~70% of platinum mine supply in 2024; Russia ~40% of palladium), giving suppliers strong leverage. 2024 average prices: platinum ~$1,050/oz, palladium ~$1,300/oz, directly pushing SFC Energy stack costs and compressing margins. Long-term offtakes and recycling (recovering ~20–30% of PGM demand) mitigate but do not eliminate exposure. Geopolitical or ESG disruptions can still ripple into multi-week production delays.
Specialized MEA components
Membrane electrode assemblies, bipolar plates and ionomer resins are supplied by a small set of qualified vendors due to tight specifications, creating concentrated supplier power. Industry reports (2024) show MEA lead times commonly at 12–24 weeks, and requalification/durability testing for new suppliers often takes 6–12 months, raising switching costs. Suppliers with proven reliability command premium pricing and priority lead times. Dual-sourcing is feasible but typically extends validation cycles by 3–9 months.
Hydrogen and methanol logistics
Continuous access to high-purity hydrogen and methanol relies on regional distributors and transport safety regimes; IEA reports global hydrogen demand was 94 Mt (2021) and methanol output ~110 Mt (2022), underscoring large, concentrated flows. In remote/off-grid cases delivery constraints and safety-driven routing give local suppliers clear negotiating leverage. Long-term supply contracts and on-site storage lower but do not remove dependency. Fuel purity directly affects fuel-cell stack life, forcing tighter vendor specs and premium pricing.
Power electronics and semiconductors
Power electronics (inverters, DC-DC converters, control boards) depend on niche semiconductors; lead times peaked near 22 weeks in 2021–22 and eased to ~14 weeks by 2024, showing suppliers can reprioritize large-volume customers and tighten allocations. Design-for-substitution mitigates risk but certification cycles often take 6–12 months, so volume commitments and 3–9 months of strategic inventory remain critical to secure supply.
- Supplier concentration: high
- Lead time 2024: ~14 weeks
- Certification lag: 6–12 months
- Recommended inventory: 3–9 months
Custom manufacturing tooling
Custom tooling for stack assembly and coating lines creates supplier leverage: 2024 industry data show tooling investments of roughly €0.5–2.0m with lead times of 6–12 months, making upgrades or replacements potential capacity bottlenecks; service contracts and spare parts typically carry 20–40% markups; bringing tooling in-house reduces supplier power but raises fixed CapEx and operating overhead.
- Tooling cost range: €0.5–2.0m (2024)
- Lead times: 6–12 months (2024)
- Spare parts/service markups: 20–40%
- In‑house: lowers supplier leverage but increases fixed CapEx
Supplier risk: Pt $1,050/oz, Pd $1,300/oz, MEA 12-24 wks
Suppliers exert high bargaining power due to concentrated PGM and MEA vendors, long lead times and costly requalification; 2024 PGM prices (Pt ~$1,050/oz, Pd ~$1,300/oz) and MEA lead times (12–24 weeks) squeeze margins. Dual‑sourcing and recycling mitigate risk but require capex and inventory (recommended 3–9 months).
| Metric | 2024 Value |
|---|---|
| Pt price | $1,050/oz |
| Pd price | $1,300/oz |
| MEA lead time | 12–24 weeks |
| Recommended inventory | 3–9 months |
What is included in the product
Detailed Word Document
Comprehensive Porter’s Five Forces analysis for SFC Energy revealing competitive intensity, supplier and buyer power, threat of substitutes and entrants, plus strategic vulnerabilities and opportunities shaping its profitability.
Customizable Excel Spreadsheet
A clear one-sheet Porter’s Five Forces for SFC Energy that instantly highlights strategic pressures, offers customizable force levels and spider-chart visualization, requires no macros, and plugs into decks or dashboards to relieve analysis bottlenecks and speed high-quality decision-making.
Customers Bargaining Power
Concentrated enterprise buyers
Defense, industrial and telecom clients buy in multi-million-euro batches, giving them leverage to negotiate price and service levels. Competitive tenders are common and frequently compress supplier margins, pushing vendors to offer customization and systems integration as baseline requirements. Long multi-year lifecycles (often 3–7 years) and extended support contracts further increase buyer influence over terms and pricing.
High performance switching costs
Once installed, SFC Energy systems embed into site design, safety and maintenance regimes, creating high switching costs that reduce buyer leverage post-installation. Upfront buyers commonly run multi-vendor pilots, often evaluating 2–4 suppliers to preserve options. Performance warranties typically run 12–36 months and SLAs target 99.9% uptime, remaining key negotiation levers.
Total cost of ownership focus
Customers in 2024 benchmark CAPEX, fuel logistics, uptime and maintenance of SFC Energy fuel-cell systems directly against diesel gensets and battery systems, demanding transparent TCO models and payback analyses (buyers typically target 3–7 year paybacks). Fuel can represent ≈65% of diesel genset OPEX, so fuel-price pass-throughs are frequently contested in contracts. Proven field reliability reduces required discounting and buyer price pressure.
Global compliance requirements
Buyers demand adherence to defense, industrial and environmental standards across jurisdictions, with export controls like ITAR and data rules such as GDPR (fines up to 4% of global turnover or €20m) raising buyer sensitivity to supplier compliance. Vendors with multi-standard certification reduce buyer risk and can weaken buyer bargaining power, while failure to meet niche specs can fully exclude a supplier.
- Certification breadth as leverage
- ITAR/Export controls shape access
- GDPR fines increase compliance premium
Option to defer purchases
Buyers can defer SFC Energy purchases in volatile energy markets, gaining timing leverage as projects are postponed and budgets are reallocated across 2023–2024 funding cycles in public and enterprise sectors.
Framework agreements with volume-flex clauses smooth demand while diversified backlog reduces exposure to any single buyer’s deferral risk.
- Timing leverage from deferrals
- Budget-cycle amplification
- Volume-flex frameworks
- Backlog diversification
Buyers wield pre-purchase leverage: pilots, long lifecycles, tight SLAs, fuel-led TCO disputes
Large defense, industrial and telecom orders (multi‑million-euro) and competitive 2–4 supplier pilots give buyers strong pre‑purchase leverage, driving tight margins and customization demands. Long 3–7 year lifecycles, 12–36 month warranties and 99.9% SLAs increase negotiation on pricing and support. Buyers benchmark TCO vs diesel/battery (3–7 year payback); fuel ≈65% of diesel OPEX, raising disputes on pass‑throughs. Certifications (ITAR, GDPR) and multi‑standard compliance materially alter buyer risk and leverage.
| Metric | Value |
|---|---|
| Pilot vendors | 2–4 |
| Payback target | 3–7 yrs |
| Diesel fuel OPEX | ≈65% |
| SLA | 99.9% |
Same Document Delivered
SFC Energy Porter's Five Forces Analysis
This preview is the exact Porter's Five Forces analysis for SFC Energy you’ll receive—no samples, placeholders, or edits. The document shown is the final, professionally formatted file, ready for immediate download and use upon purchase. What you see here is precisely what will be delivered to you.
Original: $10.00
-65%$10.00
$3.50Description
Don't Miss the Bigger Picture
SFC Energy’s Porter's Five Forces snapshot highlights supplier leverage in fuel-cell components, moderate buyer power from industrial clients, limited substitutes for off-grid power, and competitive rivalry from niche cleantech firms—threat of new entrants is tempered by certification and tech barriers. This brief teases strategic insights; unlock the full Porter's Five Forces Analysis for force-by-force ratings, visuals, and actionable recommendations.
Suppliers Bargaining Power
Scarce catalyst metals
Platinum-group catalysts are sourced from a concentrated supplier base (South Africa ~70% of platinum mine supply in 2024; Russia ~40% of palladium), giving suppliers strong leverage. 2024 average prices: platinum ~$1,050/oz, palladium ~$1,300/oz, directly pushing SFC Energy stack costs and compressing margins. Long-term offtakes and recycling (recovering ~20–30% of PGM demand) mitigate but do not eliminate exposure. Geopolitical or ESG disruptions can still ripple into multi-week production delays.
Specialized MEA components
Membrane electrode assemblies, bipolar plates and ionomer resins are supplied by a small set of qualified vendors due to tight specifications, creating concentrated supplier power. Industry reports (2024) show MEA lead times commonly at 12–24 weeks, and requalification/durability testing for new suppliers often takes 6–12 months, raising switching costs. Suppliers with proven reliability command premium pricing and priority lead times. Dual-sourcing is feasible but typically extends validation cycles by 3–9 months.
Hydrogen and methanol logistics
Continuous access to high-purity hydrogen and methanol relies on regional distributors and transport safety regimes; IEA reports global hydrogen demand was 94 Mt (2021) and methanol output ~110 Mt (2022), underscoring large, concentrated flows. In remote/off-grid cases delivery constraints and safety-driven routing give local suppliers clear negotiating leverage. Long-term supply contracts and on-site storage lower but do not remove dependency. Fuel purity directly affects fuel-cell stack life, forcing tighter vendor specs and premium pricing.
Power electronics and semiconductors
Power electronics (inverters, DC-DC converters, control boards) depend on niche semiconductors; lead times peaked near 22 weeks in 2021–22 and eased to ~14 weeks by 2024, showing suppliers can reprioritize large-volume customers and tighten allocations. Design-for-substitution mitigates risk but certification cycles often take 6–12 months, so volume commitments and 3–9 months of strategic inventory remain critical to secure supply.
- Supplier concentration: high
- Lead time 2024: ~14 weeks
- Certification lag: 6–12 months
- Recommended inventory: 3–9 months
Custom manufacturing tooling
Custom tooling for stack assembly and coating lines creates supplier leverage: 2024 industry data show tooling investments of roughly €0.5–2.0m with lead times of 6–12 months, making upgrades or replacements potential capacity bottlenecks; service contracts and spare parts typically carry 20–40% markups; bringing tooling in-house reduces supplier power but raises fixed CapEx and operating overhead.
- Tooling cost range: €0.5–2.0m (2024)
- Lead times: 6–12 months (2024)
- Spare parts/service markups: 20–40%
- In‑house: lowers supplier leverage but increases fixed CapEx
Supplier risk: Pt $1,050/oz, Pd $1,300/oz, MEA 12-24 wks
Suppliers exert high bargaining power due to concentrated PGM and MEA vendors, long lead times and costly requalification; 2024 PGM prices (Pt ~$1,050/oz, Pd ~$1,300/oz) and MEA lead times (12–24 weeks) squeeze margins. Dual‑sourcing and recycling mitigate risk but require capex and inventory (recommended 3–9 months).
| Metric | 2024 Value |
|---|---|
| Pt price | $1,050/oz |
| Pd price | $1,300/oz |
| MEA lead time | 12–24 weeks |
| Recommended inventory | 3–9 months |
What is included in the product
Detailed Word Document
Comprehensive Porter’s Five Forces analysis for SFC Energy revealing competitive intensity, supplier and buyer power, threat of substitutes and entrants, plus strategic vulnerabilities and opportunities shaping its profitability.
Customizable Excel Spreadsheet
A clear one-sheet Porter’s Five Forces for SFC Energy that instantly highlights strategic pressures, offers customizable force levels and spider-chart visualization, requires no macros, and plugs into decks or dashboards to relieve analysis bottlenecks and speed high-quality decision-making.
Customers Bargaining Power
Concentrated enterprise buyers
Defense, industrial and telecom clients buy in multi-million-euro batches, giving them leverage to negotiate price and service levels. Competitive tenders are common and frequently compress supplier margins, pushing vendors to offer customization and systems integration as baseline requirements. Long multi-year lifecycles (often 3–7 years) and extended support contracts further increase buyer influence over terms and pricing.
High performance switching costs
Once installed, SFC Energy systems embed into site design, safety and maintenance regimes, creating high switching costs that reduce buyer leverage post-installation. Upfront buyers commonly run multi-vendor pilots, often evaluating 2–4 suppliers to preserve options. Performance warranties typically run 12–36 months and SLAs target 99.9% uptime, remaining key negotiation levers.
Total cost of ownership focus
Customers in 2024 benchmark CAPEX, fuel logistics, uptime and maintenance of SFC Energy fuel-cell systems directly against diesel gensets and battery systems, demanding transparent TCO models and payback analyses (buyers typically target 3–7 year paybacks). Fuel can represent ≈65% of diesel genset OPEX, so fuel-price pass-throughs are frequently contested in contracts. Proven field reliability reduces required discounting and buyer price pressure.
Global compliance requirements
Buyers demand adherence to defense, industrial and environmental standards across jurisdictions, with export controls like ITAR and data rules such as GDPR (fines up to 4% of global turnover or €20m) raising buyer sensitivity to supplier compliance. Vendors with multi-standard certification reduce buyer risk and can weaken buyer bargaining power, while failure to meet niche specs can fully exclude a supplier.
- Certification breadth as leverage
- ITAR/Export controls shape access
- GDPR fines increase compliance premium
Option to defer purchases
Buyers can defer SFC Energy purchases in volatile energy markets, gaining timing leverage as projects are postponed and budgets are reallocated across 2023–2024 funding cycles in public and enterprise sectors.
Framework agreements with volume-flex clauses smooth demand while diversified backlog reduces exposure to any single buyer’s deferral risk.
- Timing leverage from deferrals
- Budget-cycle amplification
- Volume-flex frameworks
- Backlog diversification
Buyers wield pre-purchase leverage: pilots, long lifecycles, tight SLAs, fuel-led TCO disputes
Large defense, industrial and telecom orders (multi‑million-euro) and competitive 2–4 supplier pilots give buyers strong pre‑purchase leverage, driving tight margins and customization demands. Long 3–7 year lifecycles, 12–36 month warranties and 99.9% SLAs increase negotiation on pricing and support. Buyers benchmark TCO vs diesel/battery (3–7 year payback); fuel ≈65% of diesel OPEX, raising disputes on pass‑throughs. Certifications (ITAR, GDPR) and multi‑standard compliance materially alter buyer risk and leverage.
| Metric | Value |
|---|---|
| Pilot vendors | 2–4 |
| Payback target | 3–7 yrs |
| Diesel fuel OPEX | ≈65% |
| SLA | 99.9% |
Same Document Delivered
SFC Energy Porter's Five Forces Analysis
This preview is the exact Porter's Five Forces analysis for SFC Energy you’ll receive—no samples, placeholders, or edits. The document shown is the final, professionally formatted file, ready for immediate download and use upon purchase. What you see here is precisely what will be delivered to you.











