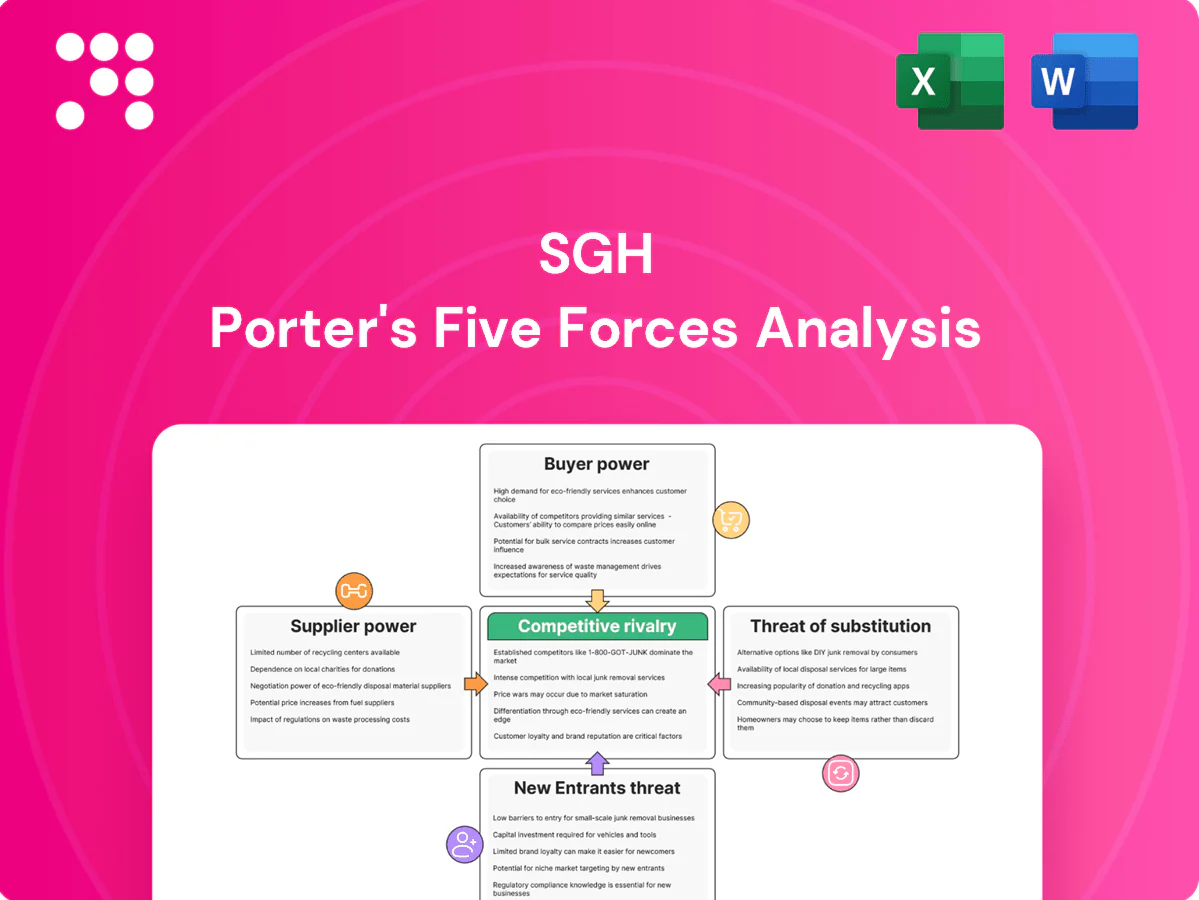
SGH Porter's Five Forces Analysis

A Must-Have Tool for Decision-Makers
SGH faces moderate supplier power, evolving buyer expectations, and rising competitive intensity driven by digital entrants; regulatory shifts and substitutes create hidden downside risks. This brief snapshot only scratches the surface. Unlock the full Porter's Five Forces Analysis to explore SGH’s competitive dynamics, market pressures, and strategic advantages in detail.
Suppliers Bargaining Power

Concentrated chip sources
In 2024 the top three DRAM suppliers—Samsung ~43%, SK hynix ~27%, Micron ~22%—held roughly 92% combined, while NAND is likewise concentrated with Samsung, Kioxia, Micron and SK hynix controlling about 70–80% of supply, giving upstream leverage to set prices and allocations in tight cycles; SGH must enforce multi-sourcing, higher safety stock and long-term contracts to temper but not eliminate exposure.
GPU/CPU dependency
HPC offerings depend on CPU/GPU vendors (NVIDIA ~80% datacenter GPU share in 2024, AMD and Intel smaller), giving suppliers strong bargaining power. Allocation priority typically favors hyperscalers and tier‑1 OEMs, limiting SGH access and pushing lead times longer. SGH’s differentiated integration and services partially offset supplier power, but supply constraints in 2024 delayed revenue recognition and compressed margins.

Controller and firmware IP
SSD controller and firmware IP from Marvell or Phison — together exceeding 50% of controller shipments in 2024 — materially influence cost and performance, giving suppliers leverage; SGH’s in-house engineering and customization capability mitigates this by enabling alternative qualification, but controller transitions still typically add 6–12 months and $1–5M in validation cost and program risk.

OSAT and substrate bottlenecks
Packaging, testing and substrate availability (ASE, Amkor and others) tighten in upcycles—TrendForce reported OSAT utilization >90% in 2024—elevating supplier power and lengthening lead times; SGH must forecast demand accurately and secure capacity reservations. Dual-sourcing and geographic diversification materially reduce interruption risk and pricing pressure.
- OSAT utilization >90% (TrendForce 2024)
- Reserve capacity agreements
- Dual-source substrates
Specialized components
Specialized components like industrial-grade DRAM, ruggedized parts, and secure elements have few qualified sources, raising supplier pricing power as niche specs increase switching frictions; the DRAM market remained highly concentrated in 2024 with the top three suppliers accounting for roughly 92% of capacity. SGH’s scale in specialty memory provides some negotiation balance, while qualification roadmaps and multi-quarter qualification cycles gradually expand sourcing options.
DRAM/NAND/GPU concentration drives pricing; customers rely on multi-sourcing and stock
In 2024 DRAM top3 ~92% and NAND top4 ~75% concentrate upstream power, enabling price/allocations control; SGH relies on multi-sourcing, safety stock and long-term contracts to manage exposure. GPU vendor NVIDIA held ~80% datacenter GPU share in 2024, tightening HPC supply. OSAT utilization >90% raised lead times and costs.
| Metric | 2024 |
|---|---|
| Top3 DRAM share | ~92% |
| NAND top4 | ~75% |
| NVIDIA datacenter GPU | ~80% |
| OSAT utilization | >90% |
What is included in the product
 Detailed Word Document
Comprehensive Porter's Five Forces analysis tailored for SGH that uncovers competitive drivers, buyer/supplier power, entry barriers, substitutes and disruptive threats, with strategic implications for pricing and market positioning.

 Customizable Excel Spreadsheet
A concise one-sheet SGH Porter's Five Forces summary that pinpoints competitive pressures and relief strategies—perfect for fast strategic decisions, slide-ready presentations, and easy customization as market conditions evolve.
Customers Bargaining Power

Diverse customer mix
Enterprise, government, defense and embedded clients exert varied bargaining power: large OEMs and integrators press hard on price and contract terms, while niche and regulated defense/government buyers pay premiums for proven reliability and longevity; global military spending was $2.24 trillion in 2023 (SIPRI), and broad customer mix helps SGH balance concentration risk.
Qualification-driven stickiness
Long validation cycles in industrial and defense often exceed 12 months, creating high switching costs and qualification-driven stickiness. Once designed-in, buyers become materially less price-sensitive mid-lifecycle, while platform redesign or reprocurement typically occurs every 5–7 years and triggers competitive rebids. Service quality and lifecycle support remain primary retention levers during multi-year programs.

Price transparency
Memory markets are commodity-like with visible spot trends, giving buyers strong price transparency and leverage against suppliers. Customers benchmark prices and yields versus tier-1 vendors and distributors, who held roughly 70% market share in 2024. SGH must justify premiums through clear performance bins, value-added services and lower TCO. Contract structures (typically 12–24 months) can smooth volatility but remain subject to frequent renegotiation.

Volume leverage
Larger buyers secure volume discounts and favorable SLAs—enterprise deals often include tiered discounts (up to 25%) and multi-year SLAs, while smaller and mid-market customers have less negotiating power but remain highly cost-sensitive. SGH’s configurable solutions allow segmented pricing by capacity and support level; bundling HPC with memory and storage improves deal economics and increases average contract value.
- Larger buyers: tiered discounts, stronger SLAs
- Mid/small customers: price-sensitive, lower leverage
- Configurable pricing: segment by features/support
- Bundling HPC+memory/storage: boosts margins & ACV
Compliance and assurance
Defense and regulated industries demand certifications such as ISO 27001 and CMMC; by 2024 CMMC 2.0 had been integrated into DoD procurement guidance. Meeting these requirements—traceability and secure supply chains—reduces buyer options and softens price pressure, while failure to comply shifts power back to buyers seeking alternatives. SGH’s proven certified contract performance is a clear differentiator.
- Certifications: ISO 27001, CMMC 2.0 (2024)
- Impact: fewer vendor options, lower price pressure
- Risk: noncompliance → buyer migration
- Strength: SGH track record in certified contracts
OEMs up to 25% discounts; distributors ~70%; defense pays premiums
Customers wield mixed power: large OEMs secure discounts up to 25% and strong SLAs, distributors held ~70% market share in 2024, while defense/government accept premiums (global military spend $2.24T in 2023) and require CMMC 2.0/ISO 27001; validation cycles >12 months and 5–7 year redesigns increase stickiness.
| Metric | Value |
|---|---|
| Distributor share (2024) | ~70% |
| Military spend (2023) | $2.24T |
| Tier discounts | Up to 25% |
Preview Before You Purchase
SGH Porter's Five Forces Analysis
This preview shows the exact SGH Porter's Five Forces Analysis you'll receive after purchase—no placeholders or mockups. The file is fully formatted, professionally written, and ready for immediate download and use. What you see here is precisely the deliverable you'll get upon completing payment.

A Must-Have Tool for Decision-Makers
SGH faces moderate supplier power, evolving buyer expectations, and rising competitive intensity driven by digital entrants; regulatory shifts and substitutes create hidden downside risks. This brief snapshot only scratches the surface. Unlock the full Porter's Five Forces Analysis to explore SGH’s competitive dynamics, market pressures, and strategic advantages in detail.
Suppliers Bargaining Power
Concentrated chip sources
In 2024 the top three DRAM suppliers—Samsung ~43%, SK hynix ~27%, Micron ~22%—held roughly 92% combined, while NAND is likewise concentrated with Samsung, Kioxia, Micron and SK hynix controlling about 70–80% of supply, giving upstream leverage to set prices and allocations in tight cycles; SGH must enforce multi-sourcing, higher safety stock and long-term contracts to temper but not eliminate exposure.
GPU/CPU dependency
HPC offerings depend on CPU/GPU vendors (NVIDIA ~80% datacenter GPU share in 2024, AMD and Intel smaller), giving suppliers strong bargaining power. Allocation priority typically favors hyperscalers and tier‑1 OEMs, limiting SGH access and pushing lead times longer. SGH’s differentiated integration and services partially offset supplier power, but supply constraints in 2024 delayed revenue recognition and compressed margins.
Controller and firmware IP
SSD controller and firmware IP from Marvell or Phison — together exceeding 50% of controller shipments in 2024 — materially influence cost and performance, giving suppliers leverage; SGH’s in-house engineering and customization capability mitigates this by enabling alternative qualification, but controller transitions still typically add 6–12 months and $1–5M in validation cost and program risk.
OSAT and substrate bottlenecks
Packaging, testing and substrate availability (ASE, Amkor and others) tighten in upcycles—TrendForce reported OSAT utilization >90% in 2024—elevating supplier power and lengthening lead times; SGH must forecast demand accurately and secure capacity reservations. Dual-sourcing and geographic diversification materially reduce interruption risk and pricing pressure.
- OSAT utilization >90% (TrendForce 2024)
- Reserve capacity agreements
- Dual-source substrates
Specialized components
Specialized components like industrial-grade DRAM, ruggedized parts, and secure elements have few qualified sources, raising supplier pricing power as niche specs increase switching frictions; the DRAM market remained highly concentrated in 2024 with the top three suppliers accounting for roughly 92% of capacity. SGH’s scale in specialty memory provides some negotiation balance, while qualification roadmaps and multi-quarter qualification cycles gradually expand sourcing options.
DRAM/NAND/GPU concentration drives pricing; customers rely on multi-sourcing and stock
In 2024 DRAM top3 ~92% and NAND top4 ~75% concentrate upstream power, enabling price/allocations control; SGH relies on multi-sourcing, safety stock and long-term contracts to manage exposure. GPU vendor NVIDIA held ~80% datacenter GPU share in 2024, tightening HPC supply. OSAT utilization >90% raised lead times and costs.
| Metric | 2024 |
|---|---|
| Top3 DRAM share | ~92% |
| NAND top4 | ~75% |
| NVIDIA datacenter GPU | ~80% |
| OSAT utilization | >90% |
What is included in the product
Detailed Word Document
Comprehensive Porter's Five Forces analysis tailored for SGH that uncovers competitive drivers, buyer/supplier power, entry barriers, substitutes and disruptive threats, with strategic implications for pricing and market positioning.
Customizable Excel Spreadsheet
A concise one-sheet SGH Porter's Five Forces summary that pinpoints competitive pressures and relief strategies—perfect for fast strategic decisions, slide-ready presentations, and easy customization as market conditions evolve.
Customers Bargaining Power
Diverse customer mix
Enterprise, government, defense and embedded clients exert varied bargaining power: large OEMs and integrators press hard on price and contract terms, while niche and regulated defense/government buyers pay premiums for proven reliability and longevity; global military spending was $2.24 trillion in 2023 (SIPRI), and broad customer mix helps SGH balance concentration risk.
Qualification-driven stickiness
Long validation cycles in industrial and defense often exceed 12 months, creating high switching costs and qualification-driven stickiness. Once designed-in, buyers become materially less price-sensitive mid-lifecycle, while platform redesign or reprocurement typically occurs every 5–7 years and triggers competitive rebids. Service quality and lifecycle support remain primary retention levers during multi-year programs.
Price transparency
Memory markets are commodity-like with visible spot trends, giving buyers strong price transparency and leverage against suppliers. Customers benchmark prices and yields versus tier-1 vendors and distributors, who held roughly 70% market share in 2024. SGH must justify premiums through clear performance bins, value-added services and lower TCO. Contract structures (typically 12–24 months) can smooth volatility but remain subject to frequent renegotiation.
Volume leverage
Larger buyers secure volume discounts and favorable SLAs—enterprise deals often include tiered discounts (up to 25%) and multi-year SLAs, while smaller and mid-market customers have less negotiating power but remain highly cost-sensitive. SGH’s configurable solutions allow segmented pricing by capacity and support level; bundling HPC with memory and storage improves deal economics and increases average contract value.
- Larger buyers: tiered discounts, stronger SLAs
- Mid/small customers: price-sensitive, lower leverage
- Configurable pricing: segment by features/support
- Bundling HPC+memory/storage: boosts margins & ACV
Compliance and assurance
Defense and regulated industries demand certifications such as ISO 27001 and CMMC; by 2024 CMMC 2.0 had been integrated into DoD procurement guidance. Meeting these requirements—traceability and secure supply chains—reduces buyer options and softens price pressure, while failure to comply shifts power back to buyers seeking alternatives. SGH’s proven certified contract performance is a clear differentiator.
- Certifications: ISO 27001, CMMC 2.0 (2024)
- Impact: fewer vendor options, lower price pressure
- Risk: noncompliance → buyer migration
- Strength: SGH track record in certified contracts
OEMs up to 25% discounts; distributors ~70%; defense pays premiums
Customers wield mixed power: large OEMs secure discounts up to 25% and strong SLAs, distributors held ~70% market share in 2024, while defense/government accept premiums (global military spend $2.24T in 2023) and require CMMC 2.0/ISO 27001; validation cycles >12 months and 5–7 year redesigns increase stickiness.
| Metric | Value |
|---|---|
| Distributor share (2024) | ~70% |
| Military spend (2023) | $2.24T |
| Tier discounts | Up to 25% |
Preview Before You Purchase
SGH Porter's Five Forces Analysis
This preview shows the exact SGH Porter's Five Forces Analysis you'll receive after purchase—no placeholders or mockups. The file is fully formatted, professionally written, and ready for immediate download and use. What you see here is precisely the deliverable you'll get upon completing payment.
Description
A Must-Have Tool for Decision-Makers
SGH faces moderate supplier power, evolving buyer expectations, and rising competitive intensity driven by digital entrants; regulatory shifts and substitutes create hidden downside risks. This brief snapshot only scratches the surface. Unlock the full Porter's Five Forces Analysis to explore SGH’s competitive dynamics, market pressures, and strategic advantages in detail.
Suppliers Bargaining Power
Concentrated chip sources
In 2024 the top three DRAM suppliers—Samsung ~43%, SK hynix ~27%, Micron ~22%—held roughly 92% combined, while NAND is likewise concentrated with Samsung, Kioxia, Micron and SK hynix controlling about 70–80% of supply, giving upstream leverage to set prices and allocations in tight cycles; SGH must enforce multi-sourcing, higher safety stock and long-term contracts to temper but not eliminate exposure.
GPU/CPU dependency
HPC offerings depend on CPU/GPU vendors (NVIDIA ~80% datacenter GPU share in 2024, AMD and Intel smaller), giving suppliers strong bargaining power. Allocation priority typically favors hyperscalers and tier‑1 OEMs, limiting SGH access and pushing lead times longer. SGH’s differentiated integration and services partially offset supplier power, but supply constraints in 2024 delayed revenue recognition and compressed margins.
Controller and firmware IP
SSD controller and firmware IP from Marvell or Phison — together exceeding 50% of controller shipments in 2024 — materially influence cost and performance, giving suppliers leverage; SGH’s in-house engineering and customization capability mitigates this by enabling alternative qualification, but controller transitions still typically add 6–12 months and $1–5M in validation cost and program risk.
OSAT and substrate bottlenecks
Packaging, testing and substrate availability (ASE, Amkor and others) tighten in upcycles—TrendForce reported OSAT utilization >90% in 2024—elevating supplier power and lengthening lead times; SGH must forecast demand accurately and secure capacity reservations. Dual-sourcing and geographic diversification materially reduce interruption risk and pricing pressure.
- OSAT utilization >90% (TrendForce 2024)
- Reserve capacity agreements
- Dual-source substrates
Specialized components
Specialized components like industrial-grade DRAM, ruggedized parts, and secure elements have few qualified sources, raising supplier pricing power as niche specs increase switching frictions; the DRAM market remained highly concentrated in 2024 with the top three suppliers accounting for roughly 92% of capacity. SGH’s scale in specialty memory provides some negotiation balance, while qualification roadmaps and multi-quarter qualification cycles gradually expand sourcing options.
DRAM/NAND/GPU concentration drives pricing; customers rely on multi-sourcing and stock
In 2024 DRAM top3 ~92% and NAND top4 ~75% concentrate upstream power, enabling price/allocations control; SGH relies on multi-sourcing, safety stock and long-term contracts to manage exposure. GPU vendor NVIDIA held ~80% datacenter GPU share in 2024, tightening HPC supply. OSAT utilization >90% raised lead times and costs.
| Metric | 2024 |
|---|---|
| Top3 DRAM share | ~92% |
| NAND top4 | ~75% |
| NVIDIA datacenter GPU | ~80% |
| OSAT utilization | >90% |
What is included in the product
Detailed Word Document
Comprehensive Porter's Five Forces analysis tailored for SGH that uncovers competitive drivers, buyer/supplier power, entry barriers, substitutes and disruptive threats, with strategic implications for pricing and market positioning.
Customizable Excel Spreadsheet
A concise one-sheet SGH Porter's Five Forces summary that pinpoints competitive pressures and relief strategies—perfect for fast strategic decisions, slide-ready presentations, and easy customization as market conditions evolve.
Customers Bargaining Power
Diverse customer mix
Enterprise, government, defense and embedded clients exert varied bargaining power: large OEMs and integrators press hard on price and contract terms, while niche and regulated defense/government buyers pay premiums for proven reliability and longevity; global military spending was $2.24 trillion in 2023 (SIPRI), and broad customer mix helps SGH balance concentration risk.
Qualification-driven stickiness
Long validation cycles in industrial and defense often exceed 12 months, creating high switching costs and qualification-driven stickiness. Once designed-in, buyers become materially less price-sensitive mid-lifecycle, while platform redesign or reprocurement typically occurs every 5–7 years and triggers competitive rebids. Service quality and lifecycle support remain primary retention levers during multi-year programs.
Price transparency
Memory markets are commodity-like with visible spot trends, giving buyers strong price transparency and leverage against suppliers. Customers benchmark prices and yields versus tier-1 vendors and distributors, who held roughly 70% market share in 2024. SGH must justify premiums through clear performance bins, value-added services and lower TCO. Contract structures (typically 12–24 months) can smooth volatility but remain subject to frequent renegotiation.
Volume leverage
Larger buyers secure volume discounts and favorable SLAs—enterprise deals often include tiered discounts (up to 25%) and multi-year SLAs, while smaller and mid-market customers have less negotiating power but remain highly cost-sensitive. SGH’s configurable solutions allow segmented pricing by capacity and support level; bundling HPC with memory and storage improves deal economics and increases average contract value.
- Larger buyers: tiered discounts, stronger SLAs
- Mid/small customers: price-sensitive, lower leverage
- Configurable pricing: segment by features/support
- Bundling HPC+memory/storage: boosts margins & ACV
Compliance and assurance
Defense and regulated industries demand certifications such as ISO 27001 and CMMC; by 2024 CMMC 2.0 had been integrated into DoD procurement guidance. Meeting these requirements—traceability and secure supply chains—reduces buyer options and softens price pressure, while failure to comply shifts power back to buyers seeking alternatives. SGH’s proven certified contract performance is a clear differentiator.
- Certifications: ISO 27001, CMMC 2.0 (2024)
- Impact: fewer vendor options, lower price pressure
- Risk: noncompliance → buyer migration
- Strength: SGH track record in certified contracts
OEMs up to 25% discounts; distributors ~70%; defense pays premiums
Customers wield mixed power: large OEMs secure discounts up to 25% and strong SLAs, distributors held ~70% market share in 2024, while defense/government accept premiums (global military spend $2.24T in 2023) and require CMMC 2.0/ISO 27001; validation cycles >12 months and 5–7 year redesigns increase stickiness.
| Metric | Value |
|---|---|
| Distributor share (2024) | ~70% |
| Military spend (2023) | $2.24T |
| Tier discounts | Up to 25% |
Preview Before You Purchase
SGH Porter's Five Forces Analysis
This preview shows the exact SGH Porter's Five Forces Analysis you'll receive after purchase—no placeholders or mockups. The file is fully formatted, professionally written, and ready for immediate download and use. What you see here is precisely the deliverable you'll get upon completing payment.











