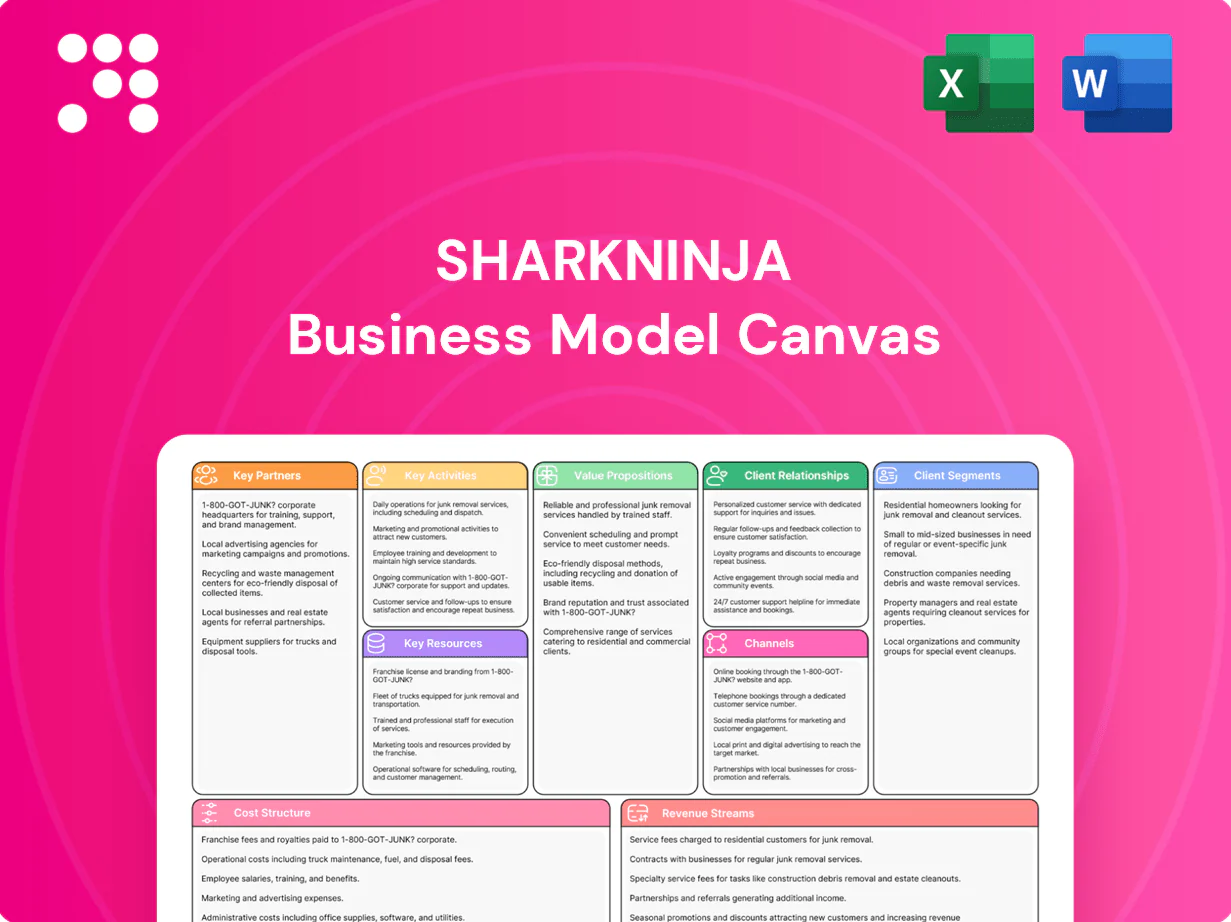
SharkNinja Business Model Canvas

Unlock the strategic blueprint of a top consumer appliance innovator with our Business Model Canvas
Unlock the full strategic blueprint behind SharkNinja with our Business Model Canvas—revealing how product innovation, direct-to-consumer channels, and retail partnerships drive growth. This concise, actionable canvas maps customer segments, key activities, revenue streams, and cost structure to spotlight scalable opportunities and risks. Download the complete Word/Excel files to benchmark strategy, inform pitches, or fast-track competitive analysis.
Partnerships

Global contract manufacturers
Global OEM and ODM partners scale SharkNinja production across Asia and other regions, with over 60% of small-appliance manufacturing concentrated in Asia as of 2024. They enable rapid tooling and flexible volumes, often cutting time-to-market by 30–40% and lowering unit costs. Close collaboration supports multi-SKU launches and synchronized supply chains. Quality and compliance alignment are embedded in supplier scorecards tracking 20+ KPIs.
Tier-1 component suppliers
Tier-1 motor, battery, heater, blade and electronics suppliers provide SharkNinja with core performance parts and account for the majority of technical BOM complexity. Co-development partnerships deliver validated reliability and differentiated specs, with joint design cycles shortened in 2024 through shared validation protocols. Multi-sourcing across regions mitigates supply risk and price volatility, while long-term agreements (commonly 12–36 months) lock in capacity and cost targets.

Retail and marketplace partners
Big-box retailers and e-commerce marketplaces (Amazon ~37% of US e-commerce in 2023) drive SharkNinja’s global reach and velocity by scaling distribution and fulfillment. Joint business planning with top retailers aligns promotions, inventory and new product introductions across channels. Investment in retail media (US retail media ad spend ~61B in 2023) and optimized on-site search boosts conversion. Secure data-sharing improves demand forecasting and assortment precision.

Logistics and 3PL networks
Freight forwarders, 3PLs and last-mile carriers compress lead times and lower costs; the global 3PL market was ~1.2 trillion USD in 2024 and last-mile can represent roughly 50% of delivery spend, driving focus on efficiency and omnichannel SLAs via regional fulfillment centers. Dynamic routing and inventory visibility cut stockouts; reverse logistics partners streamline returns and refurb flows, critical given ~16% e-commerce return rates.
- Freight optimization
- Regional fulfillment
- Dynamic routing
- Inventory visibility
- Reverse logistics
Innovation, testing, and content partners
Design firms, independent labs and certification bodies validate SharkNinja safety and performance claims to meet regulatory and retail standards; influencers and culinary creators drive trial and education—influencer marketing was a $21.1B industry in 2023; app and IoT vendors enable connected features and firmware updates; market research agencies supply ongoing consumer segmentation and usage analytics.
- Design firms & labs
- Certification bodies
- Influencers & culinary creators
- App & IoT vendors
- Market research agencies
OEM/ODM Asia > 60% share cuts time-to-market 30–40%
OEM/ODM partners concentrate >60% of small-appliance manufacturing in Asia (2024), enabling 30–40% faster time-to-market and lower unit costs.
Tier-1 suppliers and multi-sourcing shorten joint design cycles (2024) and lock capacity via 12–36 month contracts to mitigate price/supply risk.
Retail, 3PL and digital partners (Amazon ~37% US e‑com 2023; 3PL market ~$1.2T 2024) scale reach, fulfillment and returns handling (~16% e‑com returns 2024).
| Partner | 2023/24 Metric |
|---|---|
| OEM/ODM Asia share | ~60% (2024) |
| Amazon US e‑com | ~37% (2023) |
| 3PL market | ~$1.2T (2024) |
| E‑com returns | ~16% (2024) |
What is included in the product
 Detailed Word Document
A comprehensive Business Model Canvas for SharkNinja outlining customer segments, value propositions, channels, revenue streams, key activities and partners across the 9 BMC blocks, with competitive analysis, SWOT-linked insights and practical use for presentations, investor discussions, and strategic decision-making.

 Customizable Excel Spreadsheet
High-level one-page snapshot of SharkNinja’s business model with editable cells to quickly identify core components and relieve analysis bottlenecks. Shareable, clean layout saves hours of formatting and enables fast team collaboration, comparison, and executive-ready summaries.
Activities

Consumer insight and R&D
Continuous consumer research uncovers cleaning and cooking pain points to guide feature trade-offs and usability metrics. Rapid prototyping and iterative testing prioritize performance and time-to-market, feeding roadmaps that schedule category expansions and refresh cycles through 2024. Patents and design registrations secured post-IPO (Oct 2023) protect unique mechanisms and form factors.
Product design and engineering
Mechanical, electrical and software teams translate consumer and usage insights into manufacturable designs, iterating CAD, PCB and embedded firmware for production readiness. DFM and DFA practices reduce assembly complexity and cost through part consolidation and standardized modules. Rigorous validation enforces durability and safety per IEC 60335 and UL 60335 test regimes. Localization adapts voltage (110–120V vs 220–240V), plugs and market features.

Supply chain and quality management
Sourcing, planning and vendor management for SharkNinja balance cost, speed and risk across global suppliers to protect margins and lead times. In-line audits and AQL sampling (common AQL bands 1.5–4.0) ensure consistent product quality and defect control. S&OP aligns demand signals with capacity, cutting forecast error up to 30% and inventory 10–20%. Contingency plans mitigate tariffs, port disruptions and seasonality spikes.

Branding, marketing, and launch
Performance storytelling and demos establish clear problem-solution fit, driving conversion in product videos and in-store demos; retail media, social and video omnichannel campaigns—with global retail media spend estimated at $125B in 2024—amplify reach. Pricing and targeted promos accelerate trial while preserving brand equity through limited-time, value-led offers. Purposeful packaging highlights benefits and reduces transit damages, lowering returns and service costs.
- Performance demos → higher conversion
- Omnichannel: retail media/social/video (2024 retail media ~$125B)
- Promo strategies → trial without equity loss
- Packaging → benefit communication + damage reduction
Sales operations and after-sales
Sales operations align key account assortments and promotions to maximize shelf velocity; SharkNinja reported approximately $3.0 billion in net sales in 2024, supporting stronger retailer partnerships. E-commerce optimization raised organic search rank and conversion rates, with digital sales growth driving margin expansion. Robust customer service, warranties and repair networks improved loyalty and repeat purchase rates; feedback loops inform next‑gen product iterations.
- Key accounts: assortment & promotion alignment
- E‑commerce: search rank & conversion uplift
- After‑sales: service, warranties, repairs
- Product R&D: feedback → next‑gen
R&D, DFM/DFA and global sourcing power omnichannel growth to $3.0B
Continuous consumer R&D, rapid prototyping and IP protection drive the product pipeline; engineering with DFM/DFA and IEC/UL validation ensures manufacturability and safety. Global sourcing, S&OP and AQL (1.5–4.0) protect margins and lead times. Omnichannel marketing (retail media ~$125B 2024) and e‑commerce lifted net sales to ~$3.0B in 2024.
| Metric | 2024 |
|---|---|
| Net sales | $3.0B |
| Retail media | $125B |
| AQL | 1.5–4.0 |
What You See Is What You Get
Business Model Canvas
The SharkNinja Business Model Canvas shown here is a live preview of the actual deliverable—not a mockup—and contains the same content and structure you’ll receive after purchase. Upon checkout you’ll get the complete file, formatted and ready for use in Word and Excel. No surprises: what you see is the exact, editable document you’ll download and apply immediately.

Unlock the strategic blueprint of a top consumer appliance innovator with our Business Model Canvas
Unlock the full strategic blueprint behind SharkNinja with our Business Model Canvas—revealing how product innovation, direct-to-consumer channels, and retail partnerships drive growth. This concise, actionable canvas maps customer segments, key activities, revenue streams, and cost structure to spotlight scalable opportunities and risks. Download the complete Word/Excel files to benchmark strategy, inform pitches, or fast-track competitive analysis.
Partnerships
Global contract manufacturers
Global OEM and ODM partners scale SharkNinja production across Asia and other regions, with over 60% of small-appliance manufacturing concentrated in Asia as of 2024. They enable rapid tooling and flexible volumes, often cutting time-to-market by 30–40% and lowering unit costs. Close collaboration supports multi-SKU launches and synchronized supply chains. Quality and compliance alignment are embedded in supplier scorecards tracking 20+ KPIs.
Tier-1 component suppliers
Tier-1 motor, battery, heater, blade and electronics suppliers provide SharkNinja with core performance parts and account for the majority of technical BOM complexity. Co-development partnerships deliver validated reliability and differentiated specs, with joint design cycles shortened in 2024 through shared validation protocols. Multi-sourcing across regions mitigates supply risk and price volatility, while long-term agreements (commonly 12–36 months) lock in capacity and cost targets.
Retail and marketplace partners
Big-box retailers and e-commerce marketplaces (Amazon ~37% of US e-commerce in 2023) drive SharkNinja’s global reach and velocity by scaling distribution and fulfillment. Joint business planning with top retailers aligns promotions, inventory and new product introductions across channels. Investment in retail media (US retail media ad spend ~61B in 2023) and optimized on-site search boosts conversion. Secure data-sharing improves demand forecasting and assortment precision.
Logistics and 3PL networks
Freight forwarders, 3PLs and last-mile carriers compress lead times and lower costs; the global 3PL market was ~1.2 trillion USD in 2024 and last-mile can represent roughly 50% of delivery spend, driving focus on efficiency and omnichannel SLAs via regional fulfillment centers. Dynamic routing and inventory visibility cut stockouts; reverse logistics partners streamline returns and refurb flows, critical given ~16% e-commerce return rates.
- Freight optimization
- Regional fulfillment
- Dynamic routing
- Inventory visibility
- Reverse logistics
Innovation, testing, and content partners
Design firms, independent labs and certification bodies validate SharkNinja safety and performance claims to meet regulatory and retail standards; influencers and culinary creators drive trial and education—influencer marketing was a $21.1B industry in 2023; app and IoT vendors enable connected features and firmware updates; market research agencies supply ongoing consumer segmentation and usage analytics.
- Design firms & labs
- Certification bodies
- Influencers & culinary creators
- App & IoT vendors
- Market research agencies
OEM/ODM Asia > 60% share cuts time-to-market 30–40%
OEM/ODM partners concentrate >60% of small-appliance manufacturing in Asia (2024), enabling 30–40% faster time-to-market and lower unit costs.
Tier-1 suppliers and multi-sourcing shorten joint design cycles (2024) and lock capacity via 12–36 month contracts to mitigate price/supply risk.
Retail, 3PL and digital partners (Amazon ~37% US e‑com 2023; 3PL market ~$1.2T 2024) scale reach, fulfillment and returns handling (~16% e‑com returns 2024).
| Partner | 2023/24 Metric |
|---|---|
| OEM/ODM Asia share | ~60% (2024) |
| Amazon US e‑com | ~37% (2023) |
| 3PL market | ~$1.2T (2024) |
| E‑com returns | ~16% (2024) |
What is included in the product
Detailed Word Document
A comprehensive Business Model Canvas for SharkNinja outlining customer segments, value propositions, channels, revenue streams, key activities and partners across the 9 BMC blocks, with competitive analysis, SWOT-linked insights and practical use for presentations, investor discussions, and strategic decision-making.
Customizable Excel Spreadsheet
High-level one-page snapshot of SharkNinja’s business model with editable cells to quickly identify core components and relieve analysis bottlenecks. Shareable, clean layout saves hours of formatting and enables fast team collaboration, comparison, and executive-ready summaries.
Activities
Consumer insight and R&D
Continuous consumer research uncovers cleaning and cooking pain points to guide feature trade-offs and usability metrics. Rapid prototyping and iterative testing prioritize performance and time-to-market, feeding roadmaps that schedule category expansions and refresh cycles through 2024. Patents and design registrations secured post-IPO (Oct 2023) protect unique mechanisms and form factors.
Product design and engineering
Mechanical, electrical and software teams translate consumer and usage insights into manufacturable designs, iterating CAD, PCB and embedded firmware for production readiness. DFM and DFA practices reduce assembly complexity and cost through part consolidation and standardized modules. Rigorous validation enforces durability and safety per IEC 60335 and UL 60335 test regimes. Localization adapts voltage (110–120V vs 220–240V), plugs and market features.
Supply chain and quality management
Sourcing, planning and vendor management for SharkNinja balance cost, speed and risk across global suppliers to protect margins and lead times. In-line audits and AQL sampling (common AQL bands 1.5–4.0) ensure consistent product quality and defect control. S&OP aligns demand signals with capacity, cutting forecast error up to 30% and inventory 10–20%. Contingency plans mitigate tariffs, port disruptions and seasonality spikes.
Branding, marketing, and launch
Performance storytelling and demos establish clear problem-solution fit, driving conversion in product videos and in-store demos; retail media, social and video omnichannel campaigns—with global retail media spend estimated at $125B in 2024—amplify reach. Pricing and targeted promos accelerate trial while preserving brand equity through limited-time, value-led offers. Purposeful packaging highlights benefits and reduces transit damages, lowering returns and service costs.
- Performance demos → higher conversion
- Omnichannel: retail media/social/video (2024 retail media ~$125B)
- Promo strategies → trial without equity loss
- Packaging → benefit communication + damage reduction
Sales operations and after-sales
Sales operations align key account assortments and promotions to maximize shelf velocity; SharkNinja reported approximately $3.0 billion in net sales in 2024, supporting stronger retailer partnerships. E-commerce optimization raised organic search rank and conversion rates, with digital sales growth driving margin expansion. Robust customer service, warranties and repair networks improved loyalty and repeat purchase rates; feedback loops inform next‑gen product iterations.
- Key accounts: assortment & promotion alignment
- E‑commerce: search rank & conversion uplift
- After‑sales: service, warranties, repairs
- Product R&D: feedback → next‑gen
R&D, DFM/DFA and global sourcing power omnichannel growth to $3.0B
Continuous consumer R&D, rapid prototyping and IP protection drive the product pipeline; engineering with DFM/DFA and IEC/UL validation ensures manufacturability and safety. Global sourcing, S&OP and AQL (1.5–4.0) protect margins and lead times. Omnichannel marketing (retail media ~$125B 2024) and e‑commerce lifted net sales to ~$3.0B in 2024.
| Metric | 2024 |
|---|---|
| Net sales | $3.0B |
| Retail media | $125B |
| AQL | 1.5–4.0 |
What You See Is What You Get
Business Model Canvas
The SharkNinja Business Model Canvas shown here is a live preview of the actual deliverable—not a mockup—and contains the same content and structure you’ll receive after purchase. Upon checkout you’ll get the complete file, formatted and ready for use in Word and Excel. No surprises: what you see is the exact, editable document you’ll download and apply immediately.
Description
Unlock the strategic blueprint of a top consumer appliance innovator with our Business Model Canvas
Unlock the full strategic blueprint behind SharkNinja with our Business Model Canvas—revealing how product innovation, direct-to-consumer channels, and retail partnerships drive growth. This concise, actionable canvas maps customer segments, key activities, revenue streams, and cost structure to spotlight scalable opportunities and risks. Download the complete Word/Excel files to benchmark strategy, inform pitches, or fast-track competitive analysis.
Partnerships
Global contract manufacturers
Global OEM and ODM partners scale SharkNinja production across Asia and other regions, with over 60% of small-appliance manufacturing concentrated in Asia as of 2024. They enable rapid tooling and flexible volumes, often cutting time-to-market by 30–40% and lowering unit costs. Close collaboration supports multi-SKU launches and synchronized supply chains. Quality and compliance alignment are embedded in supplier scorecards tracking 20+ KPIs.
Tier-1 component suppliers
Tier-1 motor, battery, heater, blade and electronics suppliers provide SharkNinja with core performance parts and account for the majority of technical BOM complexity. Co-development partnerships deliver validated reliability and differentiated specs, with joint design cycles shortened in 2024 through shared validation protocols. Multi-sourcing across regions mitigates supply risk and price volatility, while long-term agreements (commonly 12–36 months) lock in capacity and cost targets.
Retail and marketplace partners
Big-box retailers and e-commerce marketplaces (Amazon ~37% of US e-commerce in 2023) drive SharkNinja’s global reach and velocity by scaling distribution and fulfillment. Joint business planning with top retailers aligns promotions, inventory and new product introductions across channels. Investment in retail media (US retail media ad spend ~61B in 2023) and optimized on-site search boosts conversion. Secure data-sharing improves demand forecasting and assortment precision.
Logistics and 3PL networks
Freight forwarders, 3PLs and last-mile carriers compress lead times and lower costs; the global 3PL market was ~1.2 trillion USD in 2024 and last-mile can represent roughly 50% of delivery spend, driving focus on efficiency and omnichannel SLAs via regional fulfillment centers. Dynamic routing and inventory visibility cut stockouts; reverse logistics partners streamline returns and refurb flows, critical given ~16% e-commerce return rates.
- Freight optimization
- Regional fulfillment
- Dynamic routing
- Inventory visibility
- Reverse logistics
Innovation, testing, and content partners
Design firms, independent labs and certification bodies validate SharkNinja safety and performance claims to meet regulatory and retail standards; influencers and culinary creators drive trial and education—influencer marketing was a $21.1B industry in 2023; app and IoT vendors enable connected features and firmware updates; market research agencies supply ongoing consumer segmentation and usage analytics.
- Design firms & labs
- Certification bodies
- Influencers & culinary creators
- App & IoT vendors
- Market research agencies
OEM/ODM Asia > 60% share cuts time-to-market 30–40%
OEM/ODM partners concentrate >60% of small-appliance manufacturing in Asia (2024), enabling 30–40% faster time-to-market and lower unit costs.
Tier-1 suppliers and multi-sourcing shorten joint design cycles (2024) and lock capacity via 12–36 month contracts to mitigate price/supply risk.
Retail, 3PL and digital partners (Amazon ~37% US e‑com 2023; 3PL market ~$1.2T 2024) scale reach, fulfillment and returns handling (~16% e‑com returns 2024).
| Partner | 2023/24 Metric |
|---|---|
| OEM/ODM Asia share | ~60% (2024) |
| Amazon US e‑com | ~37% (2023) |
| 3PL market | ~$1.2T (2024) |
| E‑com returns | ~16% (2024) |
What is included in the product
Detailed Word Document
A comprehensive Business Model Canvas for SharkNinja outlining customer segments, value propositions, channels, revenue streams, key activities and partners across the 9 BMC blocks, with competitive analysis, SWOT-linked insights and practical use for presentations, investor discussions, and strategic decision-making.
Customizable Excel Spreadsheet
High-level one-page snapshot of SharkNinja’s business model with editable cells to quickly identify core components and relieve analysis bottlenecks. Shareable, clean layout saves hours of formatting and enables fast team collaboration, comparison, and executive-ready summaries.
Activities
Consumer insight and R&D
Continuous consumer research uncovers cleaning and cooking pain points to guide feature trade-offs and usability metrics. Rapid prototyping and iterative testing prioritize performance and time-to-market, feeding roadmaps that schedule category expansions and refresh cycles through 2024. Patents and design registrations secured post-IPO (Oct 2023) protect unique mechanisms and form factors.
Product design and engineering
Mechanical, electrical and software teams translate consumer and usage insights into manufacturable designs, iterating CAD, PCB and embedded firmware for production readiness. DFM and DFA practices reduce assembly complexity and cost through part consolidation and standardized modules. Rigorous validation enforces durability and safety per IEC 60335 and UL 60335 test regimes. Localization adapts voltage (110–120V vs 220–240V), plugs and market features.
Supply chain and quality management
Sourcing, planning and vendor management for SharkNinja balance cost, speed and risk across global suppliers to protect margins and lead times. In-line audits and AQL sampling (common AQL bands 1.5–4.0) ensure consistent product quality and defect control. S&OP aligns demand signals with capacity, cutting forecast error up to 30% and inventory 10–20%. Contingency plans mitigate tariffs, port disruptions and seasonality spikes.
Branding, marketing, and launch
Performance storytelling and demos establish clear problem-solution fit, driving conversion in product videos and in-store demos; retail media, social and video omnichannel campaigns—with global retail media spend estimated at $125B in 2024—amplify reach. Pricing and targeted promos accelerate trial while preserving brand equity through limited-time, value-led offers. Purposeful packaging highlights benefits and reduces transit damages, lowering returns and service costs.
- Performance demos → higher conversion
- Omnichannel: retail media/social/video (2024 retail media ~$125B)
- Promo strategies → trial without equity loss
- Packaging → benefit communication + damage reduction
Sales operations and after-sales
Sales operations align key account assortments and promotions to maximize shelf velocity; SharkNinja reported approximately $3.0 billion in net sales in 2024, supporting stronger retailer partnerships. E-commerce optimization raised organic search rank and conversion rates, with digital sales growth driving margin expansion. Robust customer service, warranties and repair networks improved loyalty and repeat purchase rates; feedback loops inform next‑gen product iterations.
- Key accounts: assortment & promotion alignment
- E‑commerce: search rank & conversion uplift
- After‑sales: service, warranties, repairs
- Product R&D: feedback → next‑gen
R&D, DFM/DFA and global sourcing power omnichannel growth to $3.0B
Continuous consumer R&D, rapid prototyping and IP protection drive the product pipeline; engineering with DFM/DFA and IEC/UL validation ensures manufacturability and safety. Global sourcing, S&OP and AQL (1.5–4.0) protect margins and lead times. Omnichannel marketing (retail media ~$125B 2024) and e‑commerce lifted net sales to ~$3.0B in 2024.
| Metric | 2024 |
|---|---|
| Net sales | $3.0B |
| Retail media | $125B |
| AQL | 1.5–4.0 |
What You See Is What You Get
Business Model Canvas
The SharkNinja Business Model Canvas shown here is a live preview of the actual deliverable—not a mockup—and contains the same content and structure you’ll receive after purchase. Upon checkout you’ll get the complete file, formatted and ready for use in Word and Excel. No surprises: what you see is the exact, editable document you’ll download and apply immediately.











