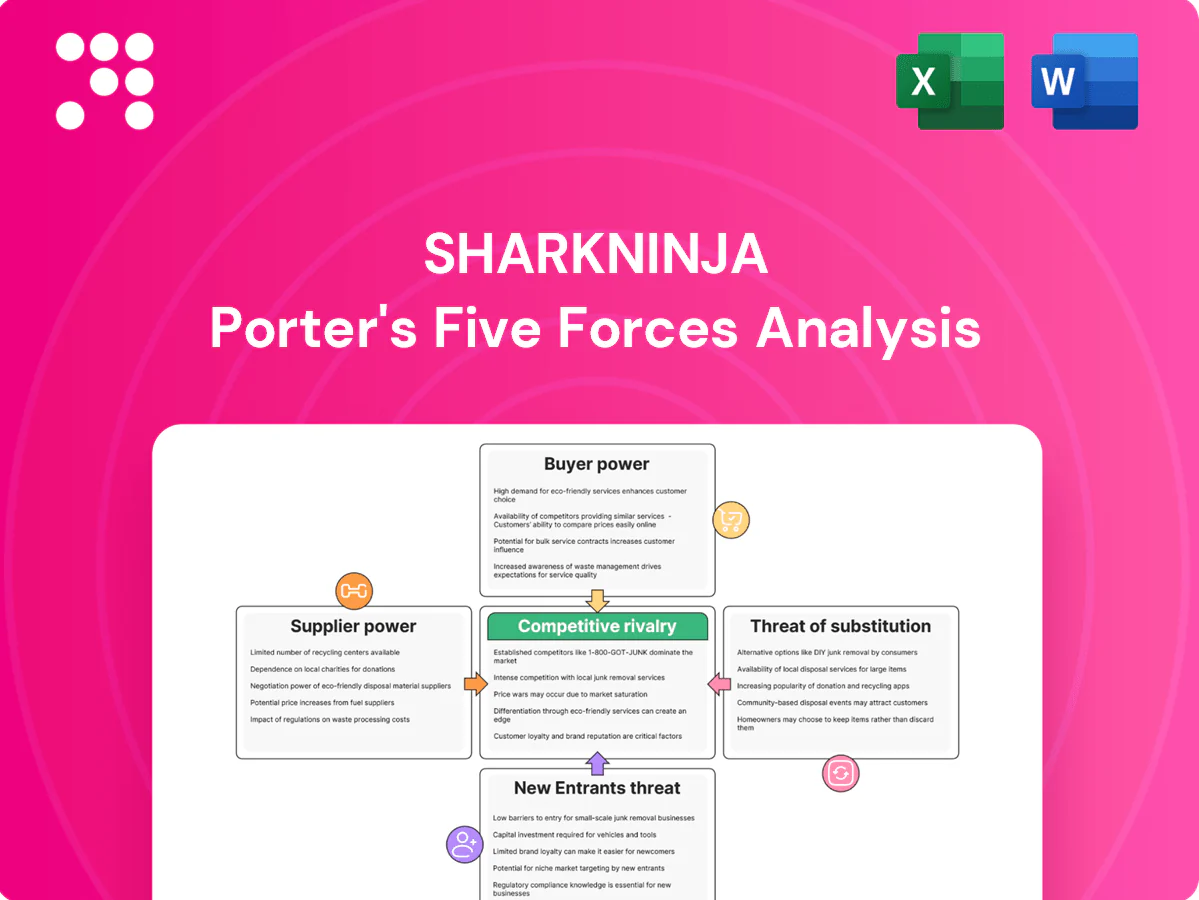
SharkNinja Porter's Five Forces Analysis

A Must-Have Tool for Decision-Makers
SharkNinja faces intense competitive rivalry and moderate supplier leverage, while buyer power and threat of substitutes hinge on innovation and distribution scale; new entrants are tempered by brand and retail relationships. Our snapshot highlights key pressure points and strategic levers for margin and growth. This preview is just the beginning; the full analysis provides a complete strategic snapshot with force-by-force ratings, visuals, and business implications tailored to SharkNinja.
Suppliers Bargaining Power

Diversified component sourcing
SharkNinja sources motors, plastics, heaters and control electronics from numerous global vendors, reducing single-supplier dependence and limiting supplier leverage. Multi-sourcing and standardized parts lower switching costs and ease procurement. Specialized items like high-speed motors or bespoke blades can still concentrate supply and raise negotiation pressure. Rigorous supplier vetting and volume commitments balance cost with reliability.
Exposure to electronics and chip cycles
Microcontrollers, sensors and displays bind SharkNinja to semiconductor cycles; global chip market (~US$600B in 2024) and foundry utilization above 85–90% can push lead times beyond 20–30 weeks and raise component costs 10–25%, boosting supplier leverage. Design-for-substitution, firmware portability, strategic inventory buffers and long-term agreements smooth volatility.

Contract manufacturing concentration
SharkNinja relies heavily on Asian EMS/ODM partners, aligning with Asia's roughly 80% share of global EMS revenue in 2024, which concentrates production power. Scale and multi-year volume commitments give SharkNinja leverage on pricing and lead times, yet peak-season factory line-time remains scarce, increasing fill-rate risk. Dual-plant qualifications mitigate disruption, while strict quality and IP safeguards in vendor agreements are essential.

Logistics and commodities volatility
- Resin/metal input volatility
- Ocean freight concentration
- Hedging/forward contracts
- Nearshoring & packaging cube reduction
Private-label and retailer-driven specs
Large retailers push vendor selection and private-label specs upstream, concentrating orders and raising supplier leverage; Amazon and Walmart accounted for roughly 45% of US e-commerce GMV in 2023, amplifying buyer-supplier bargaining shifts. Co‑development must preserve SharkNinja design control and tooling ownership, while balanced SKU allocation avoids overreliance on single suppliers.
- Retailer concentration: ~45% e-commerce GMV (2023)
- Retain design control & tooling ownership
- Allocate SKUs to preserve supplier flexibility
Appliance risk: semis bottlenecks, Asian EMS concentration, retailer bargaining power
SharkNinja faces moderate supplier power: diversified sourcing and standardized parts reduce leverage, but specialty motors, chips (global semis ~US$600B in 2024; foundry util 85–90%) and Asian EMS concentration (~80% EMS revenue share) raise risk; major retailers (Amazon+Walmart ~45% US e‑commerce GMV 2023) amplify bargaining. Hedging, long‑term contracts, dual plants and nearshoring mitigate pressure.
| Metric | Value |
|---|---|
| Global semis (2024) | ~US$600B |
| Foundry util (2024) | 85–90% |
| Asia EMS share (2024) | ~80% |
| Amazon+Walmart (US e‑comm 2023) | ~45% |
What is included in the product
 Detailed Word Document
Uncovers competitive drivers, supplier and buyer power, threat of substitutes and new entrants specific to SharkNinja, identifying disruptive forces and strategic levers that shape pricing, profitability and defensive barriers with data-backed commentary.

 Customizable Excel Spreadsheet
A one-sheet, customizable Porter's Five Forces for SharkNinja—instantly visualize competitive pressure with a radar chart, swap in your own data, duplicate scenarios (new entrant/regulation), and drop straight into decks or reports without macros.
Customers Bargaining Power

Consolidated retail channels
Consolidated retail channels—led by Amazon (≈40% of US e‑commerce in 2024), Walmart (FY2024 net sales $611B) and Target (FY2024 net sales ≈$110B)—command disproportionate shelf and search visibility, enabling pricing pressure, MDF demands and strict SLAs. Losing a top account materially shifts SharkNinja’s volume mix and margins. Joint business planning and exclusive SKUs help protect margin and placement.
High price transparency
E-commerce comparison and review platforms amplify price sensitivity, with Prime Day sales topping $12 billion in 2023 and conditioning shoppers to wait for promotions. Frequent deal events and holiday sales reinforce discount expectations and shorter purchase windows. SharkNinja’s differentiated features and consistently strong retailer ratings (typically above 4 stars) help resist commoditization and limit the need for deep price cuts.

Switching ease across brands
Vacuums, air fryers, and blenders across brands offer comparable specs and overlapping price points, making switching easy and keeping buyer power high; SharkNinja reported fiscal 2023 net sales of about $3.1 billion, reflecting intense category competition. Low switching costs let customers trial rivals, while extended warranties, improved customer service, and accessories programs increase stickiness. Bundles and loyalty programs have been shown to lift repeat purchase rates, strengthening retention.

DTC channel offsets leverage
DTC channel offsets retailer leverage by capturing first-party data, enabling direct pricing control and higher gross margins while demanding marketing spend and logistics scale; it reduces dependence on retailer algorithms and end-cap placement and increases customer LTV via subscriptions for filters and accessories.
- DTC = first-party data
- Controls pricing; boosts margins
- Requires marketing + logistics
- Subscriptions raise LTV
International market diversity
International market diversity reduces customer bargaining power for SharkNinja by diluting dependence on any single buyer cohort and enabling region-specific pricing where local retail structures and elasticities differ. Localization of assortments and compliance efforts support channel health, while currency volatility and regulatory divergence force tailored commercial terms and payment terms across markets.
- Global presence: over 60 markets
- Localized assortments reduce churn
- Currency/regulatory tailoring increases contract complexity
Retail concentration and deal-driven e-commerce squeeze margins; DTC and subscriptions push back
Concentrated retail power (Amazon ≈40% of US e‑commerce in 2024; Walmart FY2024 net sales $611B; Target FY2024 ≈$110B) forces placement and margin pressure. E‑commerce deal cadence (Prime Day ~$12B sales 2023) and review platforms raise price sensitivity despite SharkNinja’s product ratings. Product parity across vacuums, air fryers, blenders keeps switching easy; SharkNinja FY2023 net sales ~$3.1B. DTC (first‑party data, subscriptions) reduces retailer dependence across >60 markets.
| Metric | Value |
|---|---|
| Amazon US e‑com share (2024) | ≈40% |
| Walmart FY2024 sales | $611B |
| Prime Day 2023 sales | ~$12B |
| SharkNinja FY2023 sales | ~$3.1B |
| Markets | >60 |
Preview the Actual Deliverable
SharkNinja Porter's Five Forces Analysis
This preview shows the exact SharkNinja Porter's Five Forces Analysis you'll receive immediately after purchase—no placeholders or samples. The document displayed is the final, professionally formatted analysis, ready for download and use the moment you buy. You're seeing the actual deliverable; once payment is complete you'll have instant access to this same file.

A Must-Have Tool for Decision-Makers
SharkNinja faces intense competitive rivalry and moderate supplier leverage, while buyer power and threat of substitutes hinge on innovation and distribution scale; new entrants are tempered by brand and retail relationships. Our snapshot highlights key pressure points and strategic levers for margin and growth. This preview is just the beginning; the full analysis provides a complete strategic snapshot with force-by-force ratings, visuals, and business implications tailored to SharkNinja.
Suppliers Bargaining Power
Diversified component sourcing
SharkNinja sources motors, plastics, heaters and control electronics from numerous global vendors, reducing single-supplier dependence and limiting supplier leverage. Multi-sourcing and standardized parts lower switching costs and ease procurement. Specialized items like high-speed motors or bespoke blades can still concentrate supply and raise negotiation pressure. Rigorous supplier vetting and volume commitments balance cost with reliability.
Exposure to electronics and chip cycles
Microcontrollers, sensors and displays bind SharkNinja to semiconductor cycles; global chip market (~US$600B in 2024) and foundry utilization above 85–90% can push lead times beyond 20–30 weeks and raise component costs 10–25%, boosting supplier leverage. Design-for-substitution, firmware portability, strategic inventory buffers and long-term agreements smooth volatility.
Contract manufacturing concentration
SharkNinja relies heavily on Asian EMS/ODM partners, aligning with Asia's roughly 80% share of global EMS revenue in 2024, which concentrates production power. Scale and multi-year volume commitments give SharkNinja leverage on pricing and lead times, yet peak-season factory line-time remains scarce, increasing fill-rate risk. Dual-plant qualifications mitigate disruption, while strict quality and IP safeguards in vendor agreements are essential.
Logistics and commodities volatility
- Resin/metal input volatility
- Ocean freight concentration
- Hedging/forward contracts
- Nearshoring & packaging cube reduction
Private-label and retailer-driven specs
Large retailers push vendor selection and private-label specs upstream, concentrating orders and raising supplier leverage; Amazon and Walmart accounted for roughly 45% of US e-commerce GMV in 2023, amplifying buyer-supplier bargaining shifts. Co‑development must preserve SharkNinja design control and tooling ownership, while balanced SKU allocation avoids overreliance on single suppliers.
- Retailer concentration: ~45% e-commerce GMV (2023)
- Retain design control & tooling ownership
- Allocate SKUs to preserve supplier flexibility
Appliance risk: semis bottlenecks, Asian EMS concentration, retailer bargaining power
SharkNinja faces moderate supplier power: diversified sourcing and standardized parts reduce leverage, but specialty motors, chips (global semis ~US$600B in 2024; foundry util 85–90%) and Asian EMS concentration (~80% EMS revenue share) raise risk; major retailers (Amazon+Walmart ~45% US e‑commerce GMV 2023) amplify bargaining. Hedging, long‑term contracts, dual plants and nearshoring mitigate pressure.
| Metric | Value |
|---|---|
| Global semis (2024) | ~US$600B |
| Foundry util (2024) | 85–90% |
| Asia EMS share (2024) | ~80% |
| Amazon+Walmart (US e‑comm 2023) | ~45% |
What is included in the product
Detailed Word Document
Uncovers competitive drivers, supplier and buyer power, threat of substitutes and new entrants specific to SharkNinja, identifying disruptive forces and strategic levers that shape pricing, profitability and defensive barriers with data-backed commentary.
Customizable Excel Spreadsheet
A one-sheet, customizable Porter's Five Forces for SharkNinja—instantly visualize competitive pressure with a radar chart, swap in your own data, duplicate scenarios (new entrant/regulation), and drop straight into decks or reports without macros.
Customers Bargaining Power
Consolidated retail channels
Consolidated retail channels—led by Amazon (≈40% of US e‑commerce in 2024), Walmart (FY2024 net sales $611B) and Target (FY2024 net sales ≈$110B)—command disproportionate shelf and search visibility, enabling pricing pressure, MDF demands and strict SLAs. Losing a top account materially shifts SharkNinja’s volume mix and margins. Joint business planning and exclusive SKUs help protect margin and placement.
High price transparency
E-commerce comparison and review platforms amplify price sensitivity, with Prime Day sales topping $12 billion in 2023 and conditioning shoppers to wait for promotions. Frequent deal events and holiday sales reinforce discount expectations and shorter purchase windows. SharkNinja’s differentiated features and consistently strong retailer ratings (typically above 4 stars) help resist commoditization and limit the need for deep price cuts.
Switching ease across brands
Vacuums, air fryers, and blenders across brands offer comparable specs and overlapping price points, making switching easy and keeping buyer power high; SharkNinja reported fiscal 2023 net sales of about $3.1 billion, reflecting intense category competition. Low switching costs let customers trial rivals, while extended warranties, improved customer service, and accessories programs increase stickiness. Bundles and loyalty programs have been shown to lift repeat purchase rates, strengthening retention.
DTC channel offsets leverage
DTC channel offsets retailer leverage by capturing first-party data, enabling direct pricing control and higher gross margins while demanding marketing spend and logistics scale; it reduces dependence on retailer algorithms and end-cap placement and increases customer LTV via subscriptions for filters and accessories.
- DTC = first-party data
- Controls pricing; boosts margins
- Requires marketing + logistics
- Subscriptions raise LTV
International market diversity
International market diversity reduces customer bargaining power for SharkNinja by diluting dependence on any single buyer cohort and enabling region-specific pricing where local retail structures and elasticities differ. Localization of assortments and compliance efforts support channel health, while currency volatility and regulatory divergence force tailored commercial terms and payment terms across markets.
- Global presence: over 60 markets
- Localized assortments reduce churn
- Currency/regulatory tailoring increases contract complexity
Retail concentration and deal-driven e-commerce squeeze margins; DTC and subscriptions push back
Concentrated retail power (Amazon ≈40% of US e‑commerce in 2024; Walmart FY2024 net sales $611B; Target FY2024 ≈$110B) forces placement and margin pressure. E‑commerce deal cadence (Prime Day ~$12B sales 2023) and review platforms raise price sensitivity despite SharkNinja’s product ratings. Product parity across vacuums, air fryers, blenders keeps switching easy; SharkNinja FY2023 net sales ~$3.1B. DTC (first‑party data, subscriptions) reduces retailer dependence across >60 markets.
| Metric | Value |
|---|---|
| Amazon US e‑com share (2024) | ≈40% |
| Walmart FY2024 sales | $611B |
| Prime Day 2023 sales | ~$12B |
| SharkNinja FY2023 sales | ~$3.1B |
| Markets | >60 |
Preview the Actual Deliverable
SharkNinja Porter's Five Forces Analysis
This preview shows the exact SharkNinja Porter's Five Forces Analysis you'll receive immediately after purchase—no placeholders or samples. The document displayed is the final, professionally formatted analysis, ready for download and use the moment you buy. You're seeing the actual deliverable; once payment is complete you'll have instant access to this same file.
Description
A Must-Have Tool for Decision-Makers
SharkNinja faces intense competitive rivalry and moderate supplier leverage, while buyer power and threat of substitutes hinge on innovation and distribution scale; new entrants are tempered by brand and retail relationships. Our snapshot highlights key pressure points and strategic levers for margin and growth. This preview is just the beginning; the full analysis provides a complete strategic snapshot with force-by-force ratings, visuals, and business implications tailored to SharkNinja.
Suppliers Bargaining Power
Diversified component sourcing
SharkNinja sources motors, plastics, heaters and control electronics from numerous global vendors, reducing single-supplier dependence and limiting supplier leverage. Multi-sourcing and standardized parts lower switching costs and ease procurement. Specialized items like high-speed motors or bespoke blades can still concentrate supply and raise negotiation pressure. Rigorous supplier vetting and volume commitments balance cost with reliability.
Exposure to electronics and chip cycles
Microcontrollers, sensors and displays bind SharkNinja to semiconductor cycles; global chip market (~US$600B in 2024) and foundry utilization above 85–90% can push lead times beyond 20–30 weeks and raise component costs 10–25%, boosting supplier leverage. Design-for-substitution, firmware portability, strategic inventory buffers and long-term agreements smooth volatility.
Contract manufacturing concentration
SharkNinja relies heavily on Asian EMS/ODM partners, aligning with Asia's roughly 80% share of global EMS revenue in 2024, which concentrates production power. Scale and multi-year volume commitments give SharkNinja leverage on pricing and lead times, yet peak-season factory line-time remains scarce, increasing fill-rate risk. Dual-plant qualifications mitigate disruption, while strict quality and IP safeguards in vendor agreements are essential.
Logistics and commodities volatility
- Resin/metal input volatility
- Ocean freight concentration
- Hedging/forward contracts
- Nearshoring & packaging cube reduction
Private-label and retailer-driven specs
Large retailers push vendor selection and private-label specs upstream, concentrating orders and raising supplier leverage; Amazon and Walmart accounted for roughly 45% of US e-commerce GMV in 2023, amplifying buyer-supplier bargaining shifts. Co‑development must preserve SharkNinja design control and tooling ownership, while balanced SKU allocation avoids overreliance on single suppliers.
- Retailer concentration: ~45% e-commerce GMV (2023)
- Retain design control & tooling ownership
- Allocate SKUs to preserve supplier flexibility
Appliance risk: semis bottlenecks, Asian EMS concentration, retailer bargaining power
SharkNinja faces moderate supplier power: diversified sourcing and standardized parts reduce leverage, but specialty motors, chips (global semis ~US$600B in 2024; foundry util 85–90%) and Asian EMS concentration (~80% EMS revenue share) raise risk; major retailers (Amazon+Walmart ~45% US e‑commerce GMV 2023) amplify bargaining. Hedging, long‑term contracts, dual plants and nearshoring mitigate pressure.
| Metric | Value |
|---|---|
| Global semis (2024) | ~US$600B |
| Foundry util (2024) | 85–90% |
| Asia EMS share (2024) | ~80% |
| Amazon+Walmart (US e‑comm 2023) | ~45% |
What is included in the product
Detailed Word Document
Uncovers competitive drivers, supplier and buyer power, threat of substitutes and new entrants specific to SharkNinja, identifying disruptive forces and strategic levers that shape pricing, profitability and defensive barriers with data-backed commentary.
Customizable Excel Spreadsheet
A one-sheet, customizable Porter's Five Forces for SharkNinja—instantly visualize competitive pressure with a radar chart, swap in your own data, duplicate scenarios (new entrant/regulation), and drop straight into decks or reports without macros.
Customers Bargaining Power
Consolidated retail channels
Consolidated retail channels—led by Amazon (≈40% of US e‑commerce in 2024), Walmart (FY2024 net sales $611B) and Target (FY2024 net sales ≈$110B)—command disproportionate shelf and search visibility, enabling pricing pressure, MDF demands and strict SLAs. Losing a top account materially shifts SharkNinja’s volume mix and margins. Joint business planning and exclusive SKUs help protect margin and placement.
High price transparency
E-commerce comparison and review platforms amplify price sensitivity, with Prime Day sales topping $12 billion in 2023 and conditioning shoppers to wait for promotions. Frequent deal events and holiday sales reinforce discount expectations and shorter purchase windows. SharkNinja’s differentiated features and consistently strong retailer ratings (typically above 4 stars) help resist commoditization and limit the need for deep price cuts.
Switching ease across brands
Vacuums, air fryers, and blenders across brands offer comparable specs and overlapping price points, making switching easy and keeping buyer power high; SharkNinja reported fiscal 2023 net sales of about $3.1 billion, reflecting intense category competition. Low switching costs let customers trial rivals, while extended warranties, improved customer service, and accessories programs increase stickiness. Bundles and loyalty programs have been shown to lift repeat purchase rates, strengthening retention.
DTC channel offsets leverage
DTC channel offsets retailer leverage by capturing first-party data, enabling direct pricing control and higher gross margins while demanding marketing spend and logistics scale; it reduces dependence on retailer algorithms and end-cap placement and increases customer LTV via subscriptions for filters and accessories.
- DTC = first-party data
- Controls pricing; boosts margins
- Requires marketing + logistics
- Subscriptions raise LTV
International market diversity
International market diversity reduces customer bargaining power for SharkNinja by diluting dependence on any single buyer cohort and enabling region-specific pricing where local retail structures and elasticities differ. Localization of assortments and compliance efforts support channel health, while currency volatility and regulatory divergence force tailored commercial terms and payment terms across markets.
- Global presence: over 60 markets
- Localized assortments reduce churn
- Currency/regulatory tailoring increases contract complexity
Retail concentration and deal-driven e-commerce squeeze margins; DTC and subscriptions push back
Concentrated retail power (Amazon ≈40% of US e‑commerce in 2024; Walmart FY2024 net sales $611B; Target FY2024 ≈$110B) forces placement and margin pressure. E‑commerce deal cadence (Prime Day ~$12B sales 2023) and review platforms raise price sensitivity despite SharkNinja’s product ratings. Product parity across vacuums, air fryers, blenders keeps switching easy; SharkNinja FY2023 net sales ~$3.1B. DTC (first‑party data, subscriptions) reduces retailer dependence across >60 markets.
| Metric | Value |
|---|---|
| Amazon US e‑com share (2024) | ≈40% |
| Walmart FY2024 sales | $611B |
| Prime Day 2023 sales | ~$12B |
| SharkNinja FY2023 sales | ~$3.1B |
| Markets | >60 |
Preview the Actual Deliverable
SharkNinja Porter's Five Forces Analysis
This preview shows the exact SharkNinja Porter's Five Forces Analysis you'll receive immediately after purchase—no placeholders or samples. The document displayed is the final, professionally formatted analysis, ready for download and use the moment you buy. You're seeing the actual deliverable; once payment is complete you'll have instant access to this same file.











