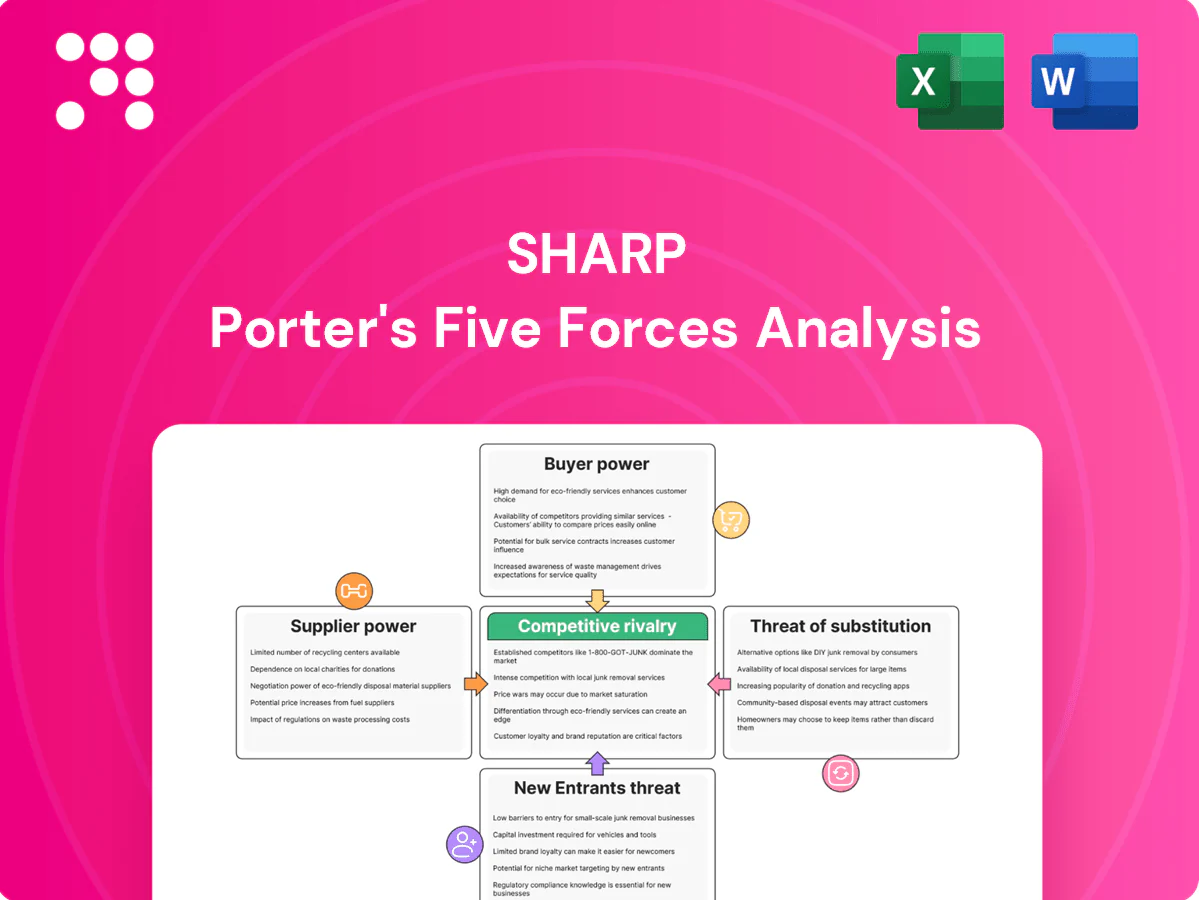
Sharp Porter's Five Forces Analysis

A Must-Have Tool for Decision-Makers
Sharp’s Porter's Five Forces snapshot highlights competitive rivalry, supplier and buyer power, threats from substitutes and new entrants, and their impact on margins and strategy. This concise view surfaces key pressures shaping Sharp’s market position. Unlock the full Porter's Five Forces Analysis to explore detailed force ratings, visuals, and actionable strategy recommendations.
Suppliers Bargaining Power

Concentrated critical components
Sharp depends on a few suppliers for semiconductors, advanced display glass, optics and rare earths; TSMC held ~56% global foundry share in 2024 and China accounted for ~60% of rare earth output, concentrating leverage. Concentration in foundry capacity and high-spec glass suppliers raises bargaining power, and allocation shifts have compressed consumer-electronics peers margins by 100–300 bps in recent supply squeezes. Sharp uses dual-sourcing where feasible, but proprietary specs typically leave only 1–2 viable alternatives.
Vertical integration via Foxconn
Ownership by Hon Hai (Foxconn) — roughly 66.8% of Sharp — gives Sharp access to Foxconn's scale in procurement and in‑house manufacturing (Hon Hai 2023 revenue ~NT$5.7 trillion), reducing external supplier dependence and improving bargaining terms. Reliance on parent capacity can introduce transfer‑pricing and prioritization trade‑offs, so supplier power is moderated but not eliminated.

Switching costs from design lock-ins
Component changes often trigger redesigns, requalification and compliance testing, commonly adding 6–18 months to timelines and testing costs that can reach millions of dollars per program; these technical switching costs strengthen incumbent suppliers’ negotiating leverage. Long development cycles in displays and appliances—frequently 18–36 months—make rapid supplier swaps prohibitively costly. Framework agreements can reduce but not eliminate this stickiness, preserving supplier power.

Commodity price volatility
Glass, metals and logistics costs swing with global cycles; Sharp faced supplier-driven cost pass-throughs that compressed gross margins — metals and glass input swings of roughly ±10% in 2023–24 and freight rate normalization in 2024 reduced but did not eliminate pressure.
Hedging and multi-year supply contracts provided partial relief, yet persistent episodic volatility keeps supplier bargaining power elevated during raw-material or shipping disruptions.
- Metals: LME aluminum average ~2,300 USD/ton in 2024
- Glass: input price volatility ~±10% 2023–24
- Logistics: container rates down ~35–40% from 2022 peaks to 2024 levels
Geopolitical and trade exposure
Supply of displays, components and modules is concentrated in East Asia (China, Taiwan, South Korea), accounting for over 80% of global panel and component capacity in 2024, exposing Sharp to tariffs and long-run export controls; 2022–24 U.S. controls and tariff measures have already redirected orders and empowered compliant suppliers. Regulatory shocks that create compliant capacity quickly raise supplier leverage, and re-shoring or friend-shoring—estimated to add 10–30% to unit costs—increases complexity and sourcing lead times, further strengthening supplier bargaining power when compliant capacity is scarce.
- Geographic concentration: >80% East Asia capacity
- Export controls: 2022–24 U.S./EU measures shifted sourcing
- Re/friend-shoring cost premium: ~10–30%
- Supplier leverage spikes when compliant capacity is limited
Sharp supplier leverage: dominant foundry ~56% share, China ~60% rare-earth, East Asia >80% capacity
Sharp faces elevated supplier power: TSMC ~56% foundry share (2024) and China ~60% rare‑earth output concentrate leverage; East Asia supplies >80% panel/component capacity (2024). Hon Hai ownership (~66.8%) and NT$5.7tn revenue (2023) moderates but does not remove supplier stickiness. Input swings (aluminum ~US$2,300/t 2024; glass ±10% 2023–24) and long requalification (6–36 months) sustain supplier pricing power.
| Metric | Value |
|---|---|
| TSMC foundry share (2024) | ~56% |
| China rare‑earth output (2024) | ~60% |
| Hon Hai ownership | ~66.8% |
| Aluminum LME (2024) | ~US$2,300/t |
What is included in the product
 Detailed Word Document
Tailored Porter's Five Forces analysis for Sharp that uncovers competitive drivers, supplier and buyer power, entry barriers, substitutes and disruptive threats shaping profitability. Ready for Word, investor decks, and strategic planning.

 Customizable Excel Spreadsheet
Sharp Porter's Five Forces delivers a one-sheet, customizable summary with pressure sliders and an instant spider chart to reveal strategic threats—ready to drop into decks, adapt to new data, and use without macros.
Customers Bargaining Power

Price-sensitive consumer markets
Consumer electronics are highly comparable across brands and channels, and with global e-commerce accounting for roughly 23% of retail sales in 2024, online price transparency significantly raises buyer bargaining power. Shoppers now expect promotions—average promotional discounts in major electronics events often exceed 15–20%—eroding margins. Sharp must therefore defend price through clear differentiation in quality, features, and design.
Powerful retail and e-commerce channels
Big-box retailers and platforms can extract favorable terms and marketing support, with Amazon capturing roughly 38% of US e-commerce sales in 2023 and Walmart driving $611 billion global revenue in FY2023, reinforcing their leverage. Shelf placement and algorithmic ranking—top three listings capture an estimated 60–70% of clicks—directly affect sell-through. Chargebacks and MDF often total 5–15% of vendor revenue, shifting value to channels. Diversifying D2C (often 10–25% of brand sales) reduces but does not remove this leverage.

Enterprise procurement discipline
RFP-driven enterprise procurement for displays, MFPs and solutions routinely mandates strict SLAs; by 2024 multi-year service contracts commonly span 3–5 years, concentrating volume and bargaining power. Total cost of ownership and service uptime — with SLA penalties embedded — are primary negotiation levers. Bundled managed services and analytics increasingly temper price pressure by delivering measurable value-add.

Component customers’ leverage
For B2B components like displays, OEM customers are few and large, giving them strong leverage to switch panel suppliers or renegotiate volumes and pricing; qualification cycles help Sharp retain placements but often at tighter margins.
- Few large OEMs = high switching/leverage
- Qualification cycles = placement retention, margin pressure
- Co-development = demand lock-in via shared roadmaps
Low switching costs for end-users
Consumers can switch appliance brands with minimal friction, driving moderate-to-high buyer power; smart-device features raise stickiness, with global smart-home device shipments exceeding 1 billion units by 2024, increasing ecosystem relevance. Warranty, service networks and brand trust still add retention, but price sensitivity remains strong.
- Low switching costs
- Smart ecosystems growing (1B+ devices 2024)
- Warranty/service adds some stickiness
- Net: moderate-to-high buyer power
23% global e-commerce lifts buyer power; discounts and platform fees compress margins
High product comparability and 23% global e-commerce penetration in 2024 amplify buyer power; promotional discounts often 15–20% and D2C share 10–25% pressure margins. Large platforms (Amazon ~38% US e-commerce 2023) and retailers (Walmart $611B FY2023) extract 5–15% in chargebacks/MDF. B2B OEMs and multi-year SLAs (3–5 yrs) concentrate leverage; smart-home shipments >1B in 2024 raise ecosystem stickiness.
| Metric | Value |
|---|---|
| Global e‑commerce (2024) | 23% |
| Amazon US share (2023) | ~38% |
| Walmart revenue (FY2023) | $611B |
| Promotional discounts | 15–20% |
| Chargebacks/MDF | 5–15% |
| Smart‑home shipments (2024) | >1B |
Same Document Delivered
Sharp Porter's Five Forces Analysis
This preview shows the exact, professionally formatted Sharp Porter's Five Forces analysis you'll receive immediately after purchase, with no placeholders or samples. It is the complete, ready-to-use document—fully detailed, tailored to Sharp, and available for instant download upon payment.

A Must-Have Tool for Decision-Makers
Sharp’s Porter's Five Forces snapshot highlights competitive rivalry, supplier and buyer power, threats from substitutes and new entrants, and their impact on margins and strategy. This concise view surfaces key pressures shaping Sharp’s market position. Unlock the full Porter's Five Forces Analysis to explore detailed force ratings, visuals, and actionable strategy recommendations.
Suppliers Bargaining Power
Concentrated critical components
Sharp depends on a few suppliers for semiconductors, advanced display glass, optics and rare earths; TSMC held ~56% global foundry share in 2024 and China accounted for ~60% of rare earth output, concentrating leverage. Concentration in foundry capacity and high-spec glass suppliers raises bargaining power, and allocation shifts have compressed consumer-electronics peers margins by 100–300 bps in recent supply squeezes. Sharp uses dual-sourcing where feasible, but proprietary specs typically leave only 1–2 viable alternatives.
Vertical integration via Foxconn
Ownership by Hon Hai (Foxconn) — roughly 66.8% of Sharp — gives Sharp access to Foxconn's scale in procurement and in‑house manufacturing (Hon Hai 2023 revenue ~NT$5.7 trillion), reducing external supplier dependence and improving bargaining terms. Reliance on parent capacity can introduce transfer‑pricing and prioritization trade‑offs, so supplier power is moderated but not eliminated.
Switching costs from design lock-ins
Component changes often trigger redesigns, requalification and compliance testing, commonly adding 6–18 months to timelines and testing costs that can reach millions of dollars per program; these technical switching costs strengthen incumbent suppliers’ negotiating leverage. Long development cycles in displays and appliances—frequently 18–36 months—make rapid supplier swaps prohibitively costly. Framework agreements can reduce but not eliminate this stickiness, preserving supplier power.
Commodity price volatility
Glass, metals and logistics costs swing with global cycles; Sharp faced supplier-driven cost pass-throughs that compressed gross margins — metals and glass input swings of roughly ±10% in 2023–24 and freight rate normalization in 2024 reduced but did not eliminate pressure.
Hedging and multi-year supply contracts provided partial relief, yet persistent episodic volatility keeps supplier bargaining power elevated during raw-material or shipping disruptions.
- Metals: LME aluminum average ~2,300 USD/ton in 2024
- Glass: input price volatility ~±10% 2023–24
- Logistics: container rates down ~35–40% from 2022 peaks to 2024 levels
Geopolitical and trade exposure
Supply of displays, components and modules is concentrated in East Asia (China, Taiwan, South Korea), accounting for over 80% of global panel and component capacity in 2024, exposing Sharp to tariffs and long-run export controls; 2022–24 U.S. controls and tariff measures have already redirected orders and empowered compliant suppliers. Regulatory shocks that create compliant capacity quickly raise supplier leverage, and re-shoring or friend-shoring—estimated to add 10–30% to unit costs—increases complexity and sourcing lead times, further strengthening supplier bargaining power when compliant capacity is scarce.
- Geographic concentration: >80% East Asia capacity
- Export controls: 2022–24 U.S./EU measures shifted sourcing
- Re/friend-shoring cost premium: ~10–30%
- Supplier leverage spikes when compliant capacity is limited
Sharp supplier leverage: dominant foundry ~56% share, China ~60% rare-earth, East Asia >80% capacity
Sharp faces elevated supplier power: TSMC ~56% foundry share (2024) and China ~60% rare‑earth output concentrate leverage; East Asia supplies >80% panel/component capacity (2024). Hon Hai ownership (~66.8%) and NT$5.7tn revenue (2023) moderates but does not remove supplier stickiness. Input swings (aluminum ~US$2,300/t 2024; glass ±10% 2023–24) and long requalification (6–36 months) sustain supplier pricing power.
| Metric | Value |
|---|---|
| TSMC foundry share (2024) | ~56% |
| China rare‑earth output (2024) | ~60% |
| Hon Hai ownership | ~66.8% |
| Aluminum LME (2024) | ~US$2,300/t |
What is included in the product
Detailed Word Document
Tailored Porter's Five Forces analysis for Sharp that uncovers competitive drivers, supplier and buyer power, entry barriers, substitutes and disruptive threats shaping profitability. Ready for Word, investor decks, and strategic planning.
Customizable Excel Spreadsheet
Sharp Porter's Five Forces delivers a one-sheet, customizable summary with pressure sliders and an instant spider chart to reveal strategic threats—ready to drop into decks, adapt to new data, and use without macros.
Customers Bargaining Power
Price-sensitive consumer markets
Consumer electronics are highly comparable across brands and channels, and with global e-commerce accounting for roughly 23% of retail sales in 2024, online price transparency significantly raises buyer bargaining power. Shoppers now expect promotions—average promotional discounts in major electronics events often exceed 15–20%—eroding margins. Sharp must therefore defend price through clear differentiation in quality, features, and design.
Powerful retail and e-commerce channels
Big-box retailers and platforms can extract favorable terms and marketing support, with Amazon capturing roughly 38% of US e-commerce sales in 2023 and Walmart driving $611 billion global revenue in FY2023, reinforcing their leverage. Shelf placement and algorithmic ranking—top three listings capture an estimated 60–70% of clicks—directly affect sell-through. Chargebacks and MDF often total 5–15% of vendor revenue, shifting value to channels. Diversifying D2C (often 10–25% of brand sales) reduces but does not remove this leverage.
Enterprise procurement discipline
RFP-driven enterprise procurement for displays, MFPs and solutions routinely mandates strict SLAs; by 2024 multi-year service contracts commonly span 3–5 years, concentrating volume and bargaining power. Total cost of ownership and service uptime — with SLA penalties embedded — are primary negotiation levers. Bundled managed services and analytics increasingly temper price pressure by delivering measurable value-add.
Component customers’ leverage
For B2B components like displays, OEM customers are few and large, giving them strong leverage to switch panel suppliers or renegotiate volumes and pricing; qualification cycles help Sharp retain placements but often at tighter margins.
- Few large OEMs = high switching/leverage
- Qualification cycles = placement retention, margin pressure
- Co-development = demand lock-in via shared roadmaps
Low switching costs for end-users
Consumers can switch appliance brands with minimal friction, driving moderate-to-high buyer power; smart-device features raise stickiness, with global smart-home device shipments exceeding 1 billion units by 2024, increasing ecosystem relevance. Warranty, service networks and brand trust still add retention, but price sensitivity remains strong.
- Low switching costs
- Smart ecosystems growing (1B+ devices 2024)
- Warranty/service adds some stickiness
- Net: moderate-to-high buyer power
23% global e-commerce lifts buyer power; discounts and platform fees compress margins
High product comparability and 23% global e-commerce penetration in 2024 amplify buyer power; promotional discounts often 15–20% and D2C share 10–25% pressure margins. Large platforms (Amazon ~38% US e-commerce 2023) and retailers (Walmart $611B FY2023) extract 5–15% in chargebacks/MDF. B2B OEMs and multi-year SLAs (3–5 yrs) concentrate leverage; smart-home shipments >1B in 2024 raise ecosystem stickiness.
| Metric | Value |
|---|---|
| Global e‑commerce (2024) | 23% |
| Amazon US share (2023) | ~38% |
| Walmart revenue (FY2023) | $611B |
| Promotional discounts | 15–20% |
| Chargebacks/MDF | 5–15% |
| Smart‑home shipments (2024) | >1B |
Same Document Delivered
Sharp Porter's Five Forces Analysis
This preview shows the exact, professionally formatted Sharp Porter's Five Forces analysis you'll receive immediately after purchase, with no placeholders or samples. It is the complete, ready-to-use document—fully detailed, tailored to Sharp, and available for instant download upon payment.
Original: $10.00
-65%$10.00
$3.50Description
A Must-Have Tool for Decision-Makers
Sharp’s Porter's Five Forces snapshot highlights competitive rivalry, supplier and buyer power, threats from substitutes and new entrants, and their impact on margins and strategy. This concise view surfaces key pressures shaping Sharp’s market position. Unlock the full Porter's Five Forces Analysis to explore detailed force ratings, visuals, and actionable strategy recommendations.
Suppliers Bargaining Power
Concentrated critical components
Sharp depends on a few suppliers for semiconductors, advanced display glass, optics and rare earths; TSMC held ~56% global foundry share in 2024 and China accounted for ~60% of rare earth output, concentrating leverage. Concentration in foundry capacity and high-spec glass suppliers raises bargaining power, and allocation shifts have compressed consumer-electronics peers margins by 100–300 bps in recent supply squeezes. Sharp uses dual-sourcing where feasible, but proprietary specs typically leave only 1–2 viable alternatives.
Vertical integration via Foxconn
Ownership by Hon Hai (Foxconn) — roughly 66.8% of Sharp — gives Sharp access to Foxconn's scale in procurement and in‑house manufacturing (Hon Hai 2023 revenue ~NT$5.7 trillion), reducing external supplier dependence and improving bargaining terms. Reliance on parent capacity can introduce transfer‑pricing and prioritization trade‑offs, so supplier power is moderated but not eliminated.
Switching costs from design lock-ins
Component changes often trigger redesigns, requalification and compliance testing, commonly adding 6–18 months to timelines and testing costs that can reach millions of dollars per program; these technical switching costs strengthen incumbent suppliers’ negotiating leverage. Long development cycles in displays and appliances—frequently 18–36 months—make rapid supplier swaps prohibitively costly. Framework agreements can reduce but not eliminate this stickiness, preserving supplier power.
Commodity price volatility
Glass, metals and logistics costs swing with global cycles; Sharp faced supplier-driven cost pass-throughs that compressed gross margins — metals and glass input swings of roughly ±10% in 2023–24 and freight rate normalization in 2024 reduced but did not eliminate pressure.
Hedging and multi-year supply contracts provided partial relief, yet persistent episodic volatility keeps supplier bargaining power elevated during raw-material or shipping disruptions.
- Metals: LME aluminum average ~2,300 USD/ton in 2024
- Glass: input price volatility ~±10% 2023–24
- Logistics: container rates down ~35–40% from 2022 peaks to 2024 levels
Geopolitical and trade exposure
Supply of displays, components and modules is concentrated in East Asia (China, Taiwan, South Korea), accounting for over 80% of global panel and component capacity in 2024, exposing Sharp to tariffs and long-run export controls; 2022–24 U.S. controls and tariff measures have already redirected orders and empowered compliant suppliers. Regulatory shocks that create compliant capacity quickly raise supplier leverage, and re-shoring or friend-shoring—estimated to add 10–30% to unit costs—increases complexity and sourcing lead times, further strengthening supplier bargaining power when compliant capacity is scarce.
- Geographic concentration: >80% East Asia capacity
- Export controls: 2022–24 U.S./EU measures shifted sourcing
- Re/friend-shoring cost premium: ~10–30%
- Supplier leverage spikes when compliant capacity is limited
Sharp supplier leverage: dominant foundry ~56% share, China ~60% rare-earth, East Asia >80% capacity
Sharp faces elevated supplier power: TSMC ~56% foundry share (2024) and China ~60% rare‑earth output concentrate leverage; East Asia supplies >80% panel/component capacity (2024). Hon Hai ownership (~66.8%) and NT$5.7tn revenue (2023) moderates but does not remove supplier stickiness. Input swings (aluminum ~US$2,300/t 2024; glass ±10% 2023–24) and long requalification (6–36 months) sustain supplier pricing power.
| Metric | Value |
|---|---|
| TSMC foundry share (2024) | ~56% |
| China rare‑earth output (2024) | ~60% |
| Hon Hai ownership | ~66.8% |
| Aluminum LME (2024) | ~US$2,300/t |
What is included in the product
Detailed Word Document
Tailored Porter's Five Forces analysis for Sharp that uncovers competitive drivers, supplier and buyer power, entry barriers, substitutes and disruptive threats shaping profitability. Ready for Word, investor decks, and strategic planning.
Customizable Excel Spreadsheet
Sharp Porter's Five Forces delivers a one-sheet, customizable summary with pressure sliders and an instant spider chart to reveal strategic threats—ready to drop into decks, adapt to new data, and use without macros.
Customers Bargaining Power
Price-sensitive consumer markets
Consumer electronics are highly comparable across brands and channels, and with global e-commerce accounting for roughly 23% of retail sales in 2024, online price transparency significantly raises buyer bargaining power. Shoppers now expect promotions—average promotional discounts in major electronics events often exceed 15–20%—eroding margins. Sharp must therefore defend price through clear differentiation in quality, features, and design.
Powerful retail and e-commerce channels
Big-box retailers and platforms can extract favorable terms and marketing support, with Amazon capturing roughly 38% of US e-commerce sales in 2023 and Walmart driving $611 billion global revenue in FY2023, reinforcing their leverage. Shelf placement and algorithmic ranking—top three listings capture an estimated 60–70% of clicks—directly affect sell-through. Chargebacks and MDF often total 5–15% of vendor revenue, shifting value to channels. Diversifying D2C (often 10–25% of brand sales) reduces but does not remove this leverage.
Enterprise procurement discipline
RFP-driven enterprise procurement for displays, MFPs and solutions routinely mandates strict SLAs; by 2024 multi-year service contracts commonly span 3–5 years, concentrating volume and bargaining power. Total cost of ownership and service uptime — with SLA penalties embedded — are primary negotiation levers. Bundled managed services and analytics increasingly temper price pressure by delivering measurable value-add.
Component customers’ leverage
For B2B components like displays, OEM customers are few and large, giving them strong leverage to switch panel suppliers or renegotiate volumes and pricing; qualification cycles help Sharp retain placements but often at tighter margins.
- Few large OEMs = high switching/leverage
- Qualification cycles = placement retention, margin pressure
- Co-development = demand lock-in via shared roadmaps
Low switching costs for end-users
Consumers can switch appliance brands with minimal friction, driving moderate-to-high buyer power; smart-device features raise stickiness, with global smart-home device shipments exceeding 1 billion units by 2024, increasing ecosystem relevance. Warranty, service networks and brand trust still add retention, but price sensitivity remains strong.
- Low switching costs
- Smart ecosystems growing (1B+ devices 2024)
- Warranty/service adds some stickiness
- Net: moderate-to-high buyer power
23% global e-commerce lifts buyer power; discounts and platform fees compress margins
High product comparability and 23% global e-commerce penetration in 2024 amplify buyer power; promotional discounts often 15–20% and D2C share 10–25% pressure margins. Large platforms (Amazon ~38% US e-commerce 2023) and retailers (Walmart $611B FY2023) extract 5–15% in chargebacks/MDF. B2B OEMs and multi-year SLAs (3–5 yrs) concentrate leverage; smart-home shipments >1B in 2024 raise ecosystem stickiness.
| Metric | Value |
|---|---|
| Global e‑commerce (2024) | 23% |
| Amazon US share (2023) | ~38% |
| Walmart revenue (FY2023) | $611B |
| Promotional discounts | 15–20% |
| Chargebacks/MDF | 5–15% |
| Smart‑home shipments (2024) | >1B |
Same Document Delivered
Sharp Porter's Five Forces Analysis
This preview shows the exact, professionally formatted Sharp Porter's Five Forces analysis you'll receive immediately after purchase, with no placeholders or samples. It is the complete, ready-to-use document—fully detailed, tailored to Sharp, and available for instant download upon payment.











