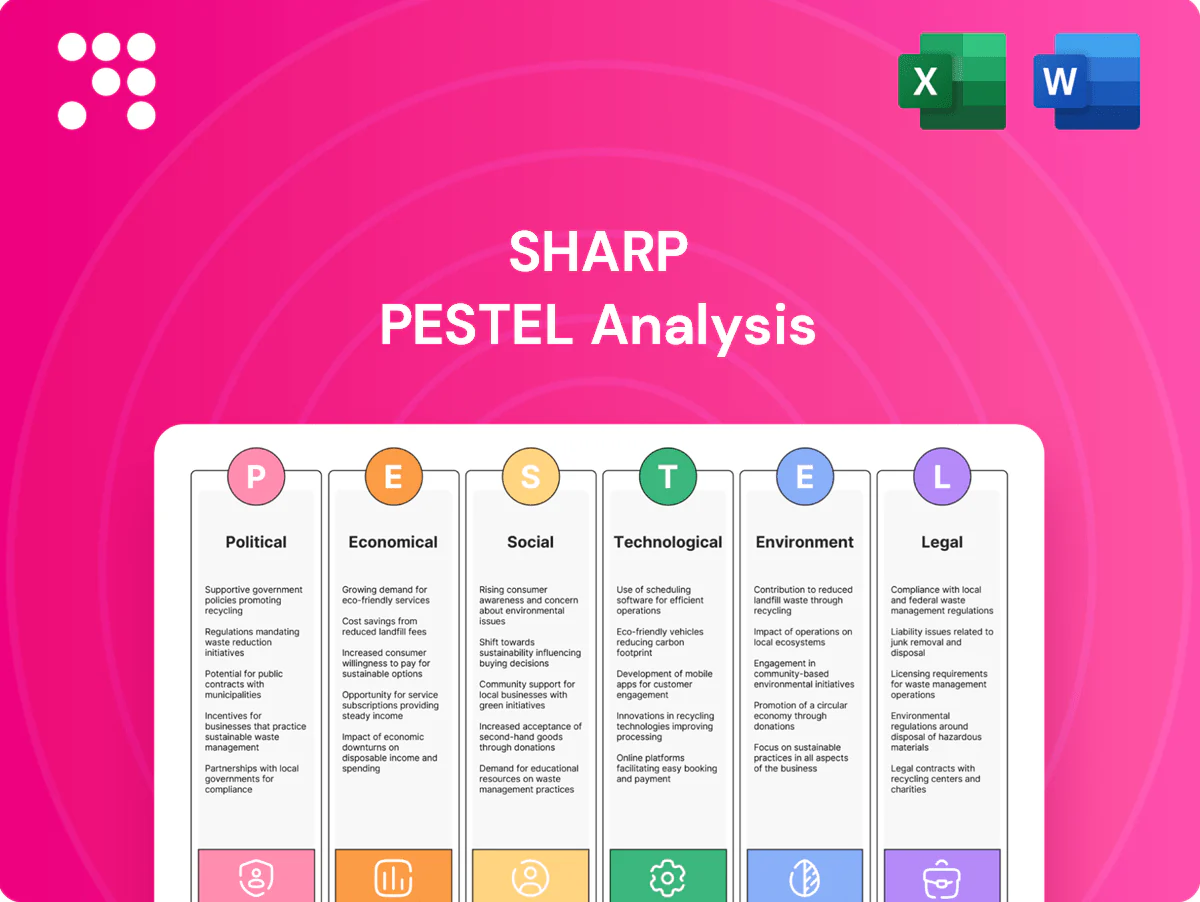
Sharp PESTLE Analysis

Your Shortcut to Market Insight Starts Here
Unlock decisive insights with our focused PESTLE Analysis of Sharp—revealing how political shifts, economic pressures, social trends, technological advances, legal changes, and environmental forces will shape its trajectory. Ideal for investors, strategists, and consultants, this concise briefing highlights risks and opportunities you can act on immediately. Purchase the full report to access the complete, downloadable analysis and ready-to-use recommendations.
Political factors

Trade policy exposure
Sharp’s global supply chain and sales hinge on stable Japan–US–China trade ties; US-China tariffs introduced in 2018 still expose electronics firms to duties up to 25%, which can compress margins quickly. Recent US export controls since 2022 on advanced semiconductors and lithography restrict sourcing and certain B2B sales of high-end components. Proactive supplier diversification reduces this political risk.
Industrial subsidies
Government incentives for semiconductors, displays and renewables shape plant location and capex timing: US CHIPS Act provides about $52B for chips and the IRA commits roughly $369B to clean energy, the EU targets around €43B for its chips ecosystem and Japan has offered ~¥2.2T for semiconductors, so grant alignment is crucial to secure cost cuts; losing subsidy races erodes total cost of ownership and competitiveness.

Energy security policy
National pushes for energy independence—e.g., Japan targets 36–38% renewables by 2030 and the US Inflation Reduction Act offers up to a 30% investment tax credit—boost demand for solar and energy management. Procurement rules and feed-in tariffs (historically decisive, as Spain's 2013 retroactive tariff cuts showed) shape project economics. Policy reversals can stall installations and inventories. Sharp must track local frameworks to prioritize markets.

Public procurement
Public procurement is a major channel for displays and office equipment sales, with the global public procurement market estimated at about 11 trillion USD (World Bank 2020); education tenders often represent a sizable share of national IT procurement. Local content rules and security criteria increasingly determine bidder eligibility, while political cycles reallocate procurement priorities and budgets; partnering with local integrators raises win rates.
- Market size: 11 trillion USD (global public procurement, World Bank 2020)
- Eligibility: local content and security criteria matter
- Risk: political cycles shift budgets
- Mitigation: partner with local integrators to improve wins
Geopolitical disruptions
Geopolitical disruptions — conflicts, sanctions or chokepoint events like the Ever Given Suez blockage (estimated by Lloyd's at about 9.6bn USD/day of trade affected) — can delay components and send spot freight rates sharply higher; container rates spiked over 200% at 2020–22 peaks, while commodity and currency volatility (Brent rose >50% in 2022) often follows.
- Scenario planning + buffer stocks lower outage risk
- Insurance and multi-sourcing improve supply resilience
- Monitor freight indices and FX; reprice contracts
Tariffs, export controls and subsidy races squeeze margins — diversify suppliers, localize
Sharp faces tariff and export-control exposure (US-China duties up to 25%; US semiconductor export curbs since 2022) that can squeeze margins and limit component sourcing. Subsidy races shape capex: US CHIPS ~$52B, IRA ~$369B, EU chips ~€43B, Japan ~¥2.2T; losing access raises TCO. Public procurement (~$11T global) and local-content rules dictate market access; diversify suppliers and partner locally.
| Risk | Impact | Mitigation | Key figures |
|---|---|---|---|
| Tariffs/controls | Margin squeeze | Dual‑sourcing | 25% duties |
| Subsidy access | Capex shifts | Grant alignment | US $52B/ $369B; EU €43B; JP ¥2.2T |
What is included in the product
 Detailed Word Document
Explores how macro-environmental factors uniquely affect Sharp across Political, Economic, Social, Technological, Environmental and Legal dimensions, with data-backed trends and region-specific regulatory context; designed for executives and advisors, it offers forward-looking insights, detailed sub-points and ready-to-insert formatting to identify threats, opportunities and inform strategic planning.

 Customizable Excel Spreadsheet
Sharp PESTLE Analysis delivers a concise, visually segmented summary of external factors for quick interpretation, easy sharing, and insertion into presentations; editable notes let teams adapt insights to region or business line, streamlining risk discussions and planning sessions.
Economic factors

Consumer demand cycles
Electronics are highly discretionary and track employment and real incomes; US unemployment averaged 3.7% in 2024 and real disposable personal income eased in parts of 2024, delaying TV and appliance upgrades and compressing ASPs. During recovery, premium mix and replacement cycles lift ASPs as seen in H2 2024 demand uptick. Pricing agility and targeted promotions were used in 2024 to manage volume swings.
FX volatility
Yen volatility—trading near 155–160 per USD in H1 2025 after a roughly 15% slide vs USD since 2021—directly shifts export pricing and imported component costs. Currency mismatches have compressed exporter margins by about 200–400 basis points in 2022–24 when unhedged. Local production and onshore sales have reduced FX exposure by ~30–50% for many firms as a natural hedge. Use of forwards/options (typical tenors 6–12 months) stabilizes near‑term cash flows.

Input cost inflation
Panels, chips and logistics together often account for the majority of device COGS — panels alone can represent roughly 40% of TV BOM — so input cost inflation materially lifts gross margins pressure. Tight capacity or supply shocks push BOM costs and lead times higher, while container spot rates fell from pandemic peaks to around USD 1,500–2,000 per FEU Shanghai–LA in 2024 but remain volatile. Pass-through pricing is limited in competitive CE categories, so Sharp relies on design-to-cost and deeper supplier partnerships to protect margins.

Corporate capex trends
Corporate capex trends closely track demand for B2B displays, MFPs and energy solutions; global corporate capex grew ~1.8% in 2024 and is forecast near 2.5% in 2025, so office digitization and retail signage spur orders when budgets expand. Slowdowns defer fleet refreshes and installations, squeezing near-term sales, while service contracts smooth revenue volatility—service revenues often represent ~20–30% of segment income.
- B2B displays: cyclical with office/retail capex
- MFPs: fleet refresh timing drives demand
- Energy solutions: tied to infrastructure spending
- Service contracts: recurring 20–30% revenue
Interest rates & credit
- Higher rates: US prime 8.50% (2024)
- Solar IRR sensitivity: ~1 ppt per 100bp
- Dealer finance: tighter lending, wider spreads
- Relief: rate cuts rapidly boost demand
- Mitigation: flexible financing bundles
Tariffs, export controls and subsidy races squeeze margins — diversify suppliers, localize
Demand tied to employment and real incomes (US unemployment 3.7% in 2024) compressed TV/appliance ASPs in 2024 but H2 2024 recovery lifted premium mix. Yen ~155–160 per USD in H1 2025 has cut unhedged exporter margins ~200–400bps; onshore sales/hedges reduced FX exposure ~30–50%. Panels ~40% of TV BOM; service revenues ~20–30%; US prime 8.50% (2024) tightens financing for big-ticket items.
| Metric | Value |
|---|---|
| US unemployment (2024) | 3.7% |
| Yen (H1 2025) | 155–160/USD |
| Panel share of TV BOM | ~40% |
| Service revenue | 20–30% |
| US prime (2024) | 8.50% |
Full Version Awaits
Sharp PESTLE Analysis
The preview shown here is the exact Sharp PESTLE Analysis you’ll receive after purchase—fully formatted, professionally structured and ready to use. This screenshot reflects the real file delivered upon checkout with no placeholders or surprises. The content, layout and analysis visible here are exactly what you’ll download immediately after payment.

Your Shortcut to Market Insight Starts Here
Unlock decisive insights with our focused PESTLE Analysis of Sharp—revealing how political shifts, economic pressures, social trends, technological advances, legal changes, and environmental forces will shape its trajectory. Ideal for investors, strategists, and consultants, this concise briefing highlights risks and opportunities you can act on immediately. Purchase the full report to access the complete, downloadable analysis and ready-to-use recommendations.
Political factors
Trade policy exposure
Sharp’s global supply chain and sales hinge on stable Japan–US–China trade ties; US-China tariffs introduced in 2018 still expose electronics firms to duties up to 25%, which can compress margins quickly. Recent US export controls since 2022 on advanced semiconductors and lithography restrict sourcing and certain B2B sales of high-end components. Proactive supplier diversification reduces this political risk.
Industrial subsidies
Government incentives for semiconductors, displays and renewables shape plant location and capex timing: US CHIPS Act provides about $52B for chips and the IRA commits roughly $369B to clean energy, the EU targets around €43B for its chips ecosystem and Japan has offered ~¥2.2T for semiconductors, so grant alignment is crucial to secure cost cuts; losing subsidy races erodes total cost of ownership and competitiveness.
Energy security policy
National pushes for energy independence—e.g., Japan targets 36–38% renewables by 2030 and the US Inflation Reduction Act offers up to a 30% investment tax credit—boost demand for solar and energy management. Procurement rules and feed-in tariffs (historically decisive, as Spain's 2013 retroactive tariff cuts showed) shape project economics. Policy reversals can stall installations and inventories. Sharp must track local frameworks to prioritize markets.
Public procurement
Public procurement is a major channel for displays and office equipment sales, with the global public procurement market estimated at about 11 trillion USD (World Bank 2020); education tenders often represent a sizable share of national IT procurement. Local content rules and security criteria increasingly determine bidder eligibility, while political cycles reallocate procurement priorities and budgets; partnering with local integrators raises win rates.
- Market size: 11 trillion USD (global public procurement, World Bank 2020)
- Eligibility: local content and security criteria matter
- Risk: political cycles shift budgets
- Mitigation: partner with local integrators to improve wins
Geopolitical disruptions
Geopolitical disruptions — conflicts, sanctions or chokepoint events like the Ever Given Suez blockage (estimated by Lloyd's at about 9.6bn USD/day of trade affected) — can delay components and send spot freight rates sharply higher; container rates spiked over 200% at 2020–22 peaks, while commodity and currency volatility (Brent rose >50% in 2022) often follows.
- Scenario planning + buffer stocks lower outage risk
- Insurance and multi-sourcing improve supply resilience
- Monitor freight indices and FX; reprice contracts
Tariffs, export controls and subsidy races squeeze margins — diversify suppliers, localize
Sharp faces tariff and export-control exposure (US-China duties up to 25%; US semiconductor export curbs since 2022) that can squeeze margins and limit component sourcing. Subsidy races shape capex: US CHIPS ~$52B, IRA ~$369B, EU chips ~€43B, Japan ~¥2.2T; losing access raises TCO. Public procurement (~$11T global) and local-content rules dictate market access; diversify suppliers and partner locally.
| Risk | Impact | Mitigation | Key figures |
|---|---|---|---|
| Tariffs/controls | Margin squeeze | Dual‑sourcing | 25% duties |
| Subsidy access | Capex shifts | Grant alignment | US $52B/ $369B; EU €43B; JP ¥2.2T |
What is included in the product
Detailed Word Document
Explores how macro-environmental factors uniquely affect Sharp across Political, Economic, Social, Technological, Environmental and Legal dimensions, with data-backed trends and region-specific regulatory context; designed for executives and advisors, it offers forward-looking insights, detailed sub-points and ready-to-insert formatting to identify threats, opportunities and inform strategic planning.
Customizable Excel Spreadsheet
Sharp PESTLE Analysis delivers a concise, visually segmented summary of external factors for quick interpretation, easy sharing, and insertion into presentations; editable notes let teams adapt insights to region or business line, streamlining risk discussions and planning sessions.
Economic factors
Consumer demand cycles
Electronics are highly discretionary and track employment and real incomes; US unemployment averaged 3.7% in 2024 and real disposable personal income eased in parts of 2024, delaying TV and appliance upgrades and compressing ASPs. During recovery, premium mix and replacement cycles lift ASPs as seen in H2 2024 demand uptick. Pricing agility and targeted promotions were used in 2024 to manage volume swings.
FX volatility
Yen volatility—trading near 155–160 per USD in H1 2025 after a roughly 15% slide vs USD since 2021—directly shifts export pricing and imported component costs. Currency mismatches have compressed exporter margins by about 200–400 basis points in 2022–24 when unhedged. Local production and onshore sales have reduced FX exposure by ~30–50% for many firms as a natural hedge. Use of forwards/options (typical tenors 6–12 months) stabilizes near‑term cash flows.
Input cost inflation
Panels, chips and logistics together often account for the majority of device COGS — panels alone can represent roughly 40% of TV BOM — so input cost inflation materially lifts gross margins pressure. Tight capacity or supply shocks push BOM costs and lead times higher, while container spot rates fell from pandemic peaks to around USD 1,500–2,000 per FEU Shanghai–LA in 2024 but remain volatile. Pass-through pricing is limited in competitive CE categories, so Sharp relies on design-to-cost and deeper supplier partnerships to protect margins.
Corporate capex trends
Corporate capex trends closely track demand for B2B displays, MFPs and energy solutions; global corporate capex grew ~1.8% in 2024 and is forecast near 2.5% in 2025, so office digitization and retail signage spur orders when budgets expand. Slowdowns defer fleet refreshes and installations, squeezing near-term sales, while service contracts smooth revenue volatility—service revenues often represent ~20–30% of segment income.
- B2B displays: cyclical with office/retail capex
- MFPs: fleet refresh timing drives demand
- Energy solutions: tied to infrastructure spending
- Service contracts: recurring 20–30% revenue
Interest rates & credit
- Higher rates: US prime 8.50% (2024)
- Solar IRR sensitivity: ~1 ppt per 100bp
- Dealer finance: tighter lending, wider spreads
- Relief: rate cuts rapidly boost demand
- Mitigation: flexible financing bundles
Tariffs, export controls and subsidy races squeeze margins — diversify suppliers, localize
Demand tied to employment and real incomes (US unemployment 3.7% in 2024) compressed TV/appliance ASPs in 2024 but H2 2024 recovery lifted premium mix. Yen ~155–160 per USD in H1 2025 has cut unhedged exporter margins ~200–400bps; onshore sales/hedges reduced FX exposure ~30–50%. Panels ~40% of TV BOM; service revenues ~20–30%; US prime 8.50% (2024) tightens financing for big-ticket items.
| Metric | Value |
|---|---|
| US unemployment (2024) | 3.7% |
| Yen (H1 2025) | 155–160/USD |
| Panel share of TV BOM | ~40% |
| Service revenue | 20–30% |
| US prime (2024) | 8.50% |
Full Version Awaits
Sharp PESTLE Analysis
The preview shown here is the exact Sharp PESTLE Analysis you’ll receive after purchase—fully formatted, professionally structured and ready to use. This screenshot reflects the real file delivered upon checkout with no placeholders or surprises. The content, layout and analysis visible here are exactly what you’ll download immediately after payment.
Original: $10.00
-65%$10.00
$3.50Description
Your Shortcut to Market Insight Starts Here
Unlock decisive insights with our focused PESTLE Analysis of Sharp—revealing how political shifts, economic pressures, social trends, technological advances, legal changes, and environmental forces will shape its trajectory. Ideal for investors, strategists, and consultants, this concise briefing highlights risks and opportunities you can act on immediately. Purchase the full report to access the complete, downloadable analysis and ready-to-use recommendations.
Political factors
Trade policy exposure
Sharp’s global supply chain and sales hinge on stable Japan–US–China trade ties; US-China tariffs introduced in 2018 still expose electronics firms to duties up to 25%, which can compress margins quickly. Recent US export controls since 2022 on advanced semiconductors and lithography restrict sourcing and certain B2B sales of high-end components. Proactive supplier diversification reduces this political risk.
Industrial subsidies
Government incentives for semiconductors, displays and renewables shape plant location and capex timing: US CHIPS Act provides about $52B for chips and the IRA commits roughly $369B to clean energy, the EU targets around €43B for its chips ecosystem and Japan has offered ~¥2.2T for semiconductors, so grant alignment is crucial to secure cost cuts; losing subsidy races erodes total cost of ownership and competitiveness.
Energy security policy
National pushes for energy independence—e.g., Japan targets 36–38% renewables by 2030 and the US Inflation Reduction Act offers up to a 30% investment tax credit—boost demand for solar and energy management. Procurement rules and feed-in tariffs (historically decisive, as Spain's 2013 retroactive tariff cuts showed) shape project economics. Policy reversals can stall installations and inventories. Sharp must track local frameworks to prioritize markets.
Public procurement
Public procurement is a major channel for displays and office equipment sales, with the global public procurement market estimated at about 11 trillion USD (World Bank 2020); education tenders often represent a sizable share of national IT procurement. Local content rules and security criteria increasingly determine bidder eligibility, while political cycles reallocate procurement priorities and budgets; partnering with local integrators raises win rates.
- Market size: 11 trillion USD (global public procurement, World Bank 2020)
- Eligibility: local content and security criteria matter
- Risk: political cycles shift budgets
- Mitigation: partner with local integrators to improve wins
Geopolitical disruptions
Geopolitical disruptions — conflicts, sanctions or chokepoint events like the Ever Given Suez blockage (estimated by Lloyd's at about 9.6bn USD/day of trade affected) — can delay components and send spot freight rates sharply higher; container rates spiked over 200% at 2020–22 peaks, while commodity and currency volatility (Brent rose >50% in 2022) often follows.
- Scenario planning + buffer stocks lower outage risk
- Insurance and multi-sourcing improve supply resilience
- Monitor freight indices and FX; reprice contracts
Tariffs, export controls and subsidy races squeeze margins — diversify suppliers, localize
Sharp faces tariff and export-control exposure (US-China duties up to 25%; US semiconductor export curbs since 2022) that can squeeze margins and limit component sourcing. Subsidy races shape capex: US CHIPS ~$52B, IRA ~$369B, EU chips ~€43B, Japan ~¥2.2T; losing access raises TCO. Public procurement (~$11T global) and local-content rules dictate market access; diversify suppliers and partner locally.
| Risk | Impact | Mitigation | Key figures |
|---|---|---|---|
| Tariffs/controls | Margin squeeze | Dual‑sourcing | 25% duties |
| Subsidy access | Capex shifts | Grant alignment | US $52B/ $369B; EU €43B; JP ¥2.2T |
What is included in the product
Detailed Word Document
Explores how macro-environmental factors uniquely affect Sharp across Political, Economic, Social, Technological, Environmental and Legal dimensions, with data-backed trends and region-specific regulatory context; designed for executives and advisors, it offers forward-looking insights, detailed sub-points and ready-to-insert formatting to identify threats, opportunities and inform strategic planning.
Customizable Excel Spreadsheet
Sharp PESTLE Analysis delivers a concise, visually segmented summary of external factors for quick interpretation, easy sharing, and insertion into presentations; editable notes let teams adapt insights to region or business line, streamlining risk discussions and planning sessions.
Economic factors
Consumer demand cycles
Electronics are highly discretionary and track employment and real incomes; US unemployment averaged 3.7% in 2024 and real disposable personal income eased in parts of 2024, delaying TV and appliance upgrades and compressing ASPs. During recovery, premium mix and replacement cycles lift ASPs as seen in H2 2024 demand uptick. Pricing agility and targeted promotions were used in 2024 to manage volume swings.
FX volatility
Yen volatility—trading near 155–160 per USD in H1 2025 after a roughly 15% slide vs USD since 2021—directly shifts export pricing and imported component costs. Currency mismatches have compressed exporter margins by about 200–400 basis points in 2022–24 when unhedged. Local production and onshore sales have reduced FX exposure by ~30–50% for many firms as a natural hedge. Use of forwards/options (typical tenors 6–12 months) stabilizes near‑term cash flows.
Input cost inflation
Panels, chips and logistics together often account for the majority of device COGS — panels alone can represent roughly 40% of TV BOM — so input cost inflation materially lifts gross margins pressure. Tight capacity or supply shocks push BOM costs and lead times higher, while container spot rates fell from pandemic peaks to around USD 1,500–2,000 per FEU Shanghai–LA in 2024 but remain volatile. Pass-through pricing is limited in competitive CE categories, so Sharp relies on design-to-cost and deeper supplier partnerships to protect margins.
Corporate capex trends
Corporate capex trends closely track demand for B2B displays, MFPs and energy solutions; global corporate capex grew ~1.8% in 2024 and is forecast near 2.5% in 2025, so office digitization and retail signage spur orders when budgets expand. Slowdowns defer fleet refreshes and installations, squeezing near-term sales, while service contracts smooth revenue volatility—service revenues often represent ~20–30% of segment income.
- B2B displays: cyclical with office/retail capex
- MFPs: fleet refresh timing drives demand
- Energy solutions: tied to infrastructure spending
- Service contracts: recurring 20–30% revenue
Interest rates & credit
- Higher rates: US prime 8.50% (2024)
- Solar IRR sensitivity: ~1 ppt per 100bp
- Dealer finance: tighter lending, wider spreads
- Relief: rate cuts rapidly boost demand
- Mitigation: flexible financing bundles
Tariffs, export controls and subsidy races squeeze margins — diversify suppliers, localize
Demand tied to employment and real incomes (US unemployment 3.7% in 2024) compressed TV/appliance ASPs in 2024 but H2 2024 recovery lifted premium mix. Yen ~155–160 per USD in H1 2025 has cut unhedged exporter margins ~200–400bps; onshore sales/hedges reduced FX exposure ~30–50%. Panels ~40% of TV BOM; service revenues ~20–30%; US prime 8.50% (2024) tightens financing for big-ticket items.
| Metric | Value |
|---|---|
| US unemployment (2024) | 3.7% |
| Yen (H1 2025) | 155–160/USD |
| Panel share of TV BOM | ~40% |
| Service revenue | 20–30% |
| US prime (2024) | 8.50% |
Full Version Awaits
Sharp PESTLE Analysis
The preview shown here is the exact Sharp PESTLE Analysis you’ll receive after purchase—fully formatted, professionally structured and ready to use. This screenshot reflects the real file delivered upon checkout with no placeholders or surprises. The content, layout and analysis visible here are exactly what you’ll download immediately after payment.











