Shell Plc Porter's Five Forces Analysis

Go Beyond the Preview—Access the Full Strategic Report
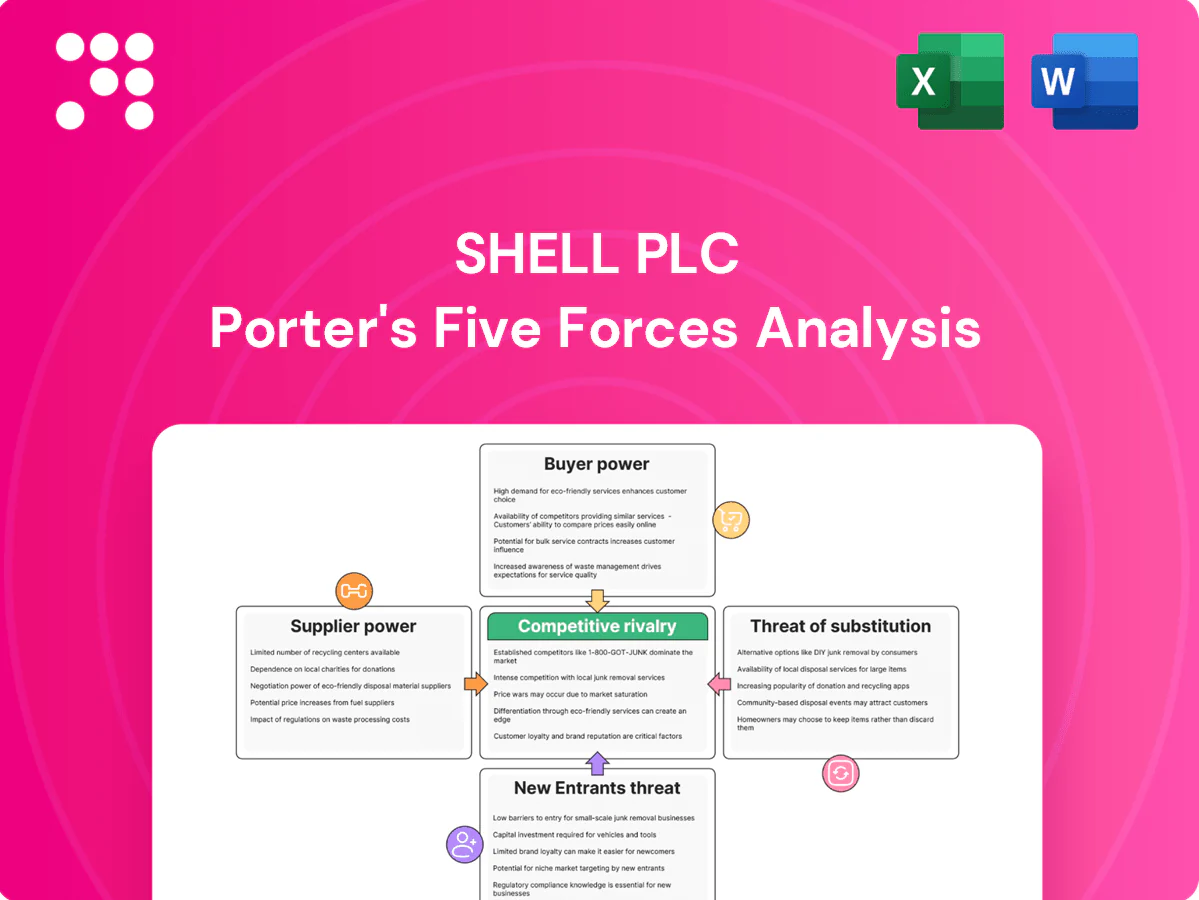
Shell Plc faces moderate supplier power, high buyer scrutiny, growing substitute threats from renewables, steep entry barriers due to capital intensity, and fierce rivalry among integrated majors. This Porter's Five Forces snapshot underscores pressures on margins, investment choices, and transition risk. Unlock the full Porter's Five Forces Analysis to explore Shell Plc’s competitive dynamics, market pressures, and strategic advantages in detail.
Suppliers Bargaining Power

OPEC/NOC control of upstream barrels
Core crude supply is concentrated in OPEC and state-owned producers, with OPEC+ supplying about 45% of global oil production in 2024, giving them coordination power over volumes and price. Shell mitigates this via geographic diversification and integrated LNG plus long-term offtake contracts and equity stakes, but remains exposed to quota shifts and geopolitical decisions. Unexpected curtailments can tighten feedstock and raise input costs.
Concentrated oilfield services and EPC
Specialized drilling, subsea and EPC contractors remain concentrated — Schlumberger, Halliburton and Baker Hughes accounted for roughly 40% of global oilfield services revenue in 2024 — giving suppliers leverage in tight cycles.
Industry EPC and equipment cost inflation ran near 8–10% in 2024 and subsea lead times stretched to about 12–18 months, raising Shell’s project capex and timelines.
Shell offsets pressure with framework agreements and digital procurement platforms; counter‑cyclic contracting can lock favorable rates but increases committed capex and timing risk.

Technologies and critical equipment dependence
Fewer than 10 global suppliers dominate liquefaction trains, catalysts and advanced control systems, concentrating supplier power; equipment qualification often exceeds 12 months and switching costs are high. Shell uses standardization and in-house R&D to compress uniqueness premiums and shorten commissioning. Co-development contracts and multi-year warranties (commonly 5–10 years) transfer significant performance and lifecycle risk back to suppliers.

Energy transition minerals and components
Regulatory and geopolitical constraints on supply
Regulatory and geopolitical constraints—sanctions, local content rules and permitting—raise supplier leverage by narrowing Shell’s alternative sources; local content mandates commonly require 20–60% domestic procurement, while sanctions since 2022 forced major re‑routing of supplies and asset exits. Compliance and requalification add an estimated 5–15% to project procurement costs, increasing complexity across the chain. Rapid political shifts can reprioritize suppliers overnight, amplifying supply risk and bargaining power.
- sanctions: forced supply reroutes, asset exits since 2022
- local content: 20–60% domestic sourcing mandates
- cost impact: +5–15% procurement/compliance
- risk: sudden political shifts reprioritize suppliers
Supplier concentration and 12–18 month lead times squeeze energy project costs
Suppliers hold significant leverage: OPEC+ supplied ~45% of oil in 2024 and top oilfield service firms (Schlumberger, Halliburton, Baker Hughes) captured ~40% of global OFS revenue, concentrating pricing power. EPC/equipment inflation ran ~8–10% in 2024 and subsea lead times stretched 12–18 months, raising Shell’s capex and timelines. Key equipment suppliers number <10 for liquefaction/catalysts, while local content rules (20–60%) and sanctions add 5–15% procurement cost.
| Metric | 2024 value |
|---|---|
| OPEC+ share | ~45% |
| Top OFS share | ~40% |
| EPC/equipment inflation | 8–10% |
| Subsea lead times | 12–18 months |
| Key liquefaction suppliers | <10 |
| Local content mandates | 20–60% |
| Procurement/compliance cost | +5–15% |
What is included in the product
 Detailed Word Document
Comprehensive Porter's Five Forces assessment tailored to Shell Plc, uncovering competitive rivalry, supplier and buyer power, threat of substitutes and new entrants, plus disruptive forces and strategic implications for pricing and profitability.

 Customizable Excel Spreadsheet
A concise Porter's Five Forces snapshot for Shell Plc—distills supplier/customer power, competitive rivalry, threat of substitutes and new entrants into an actionable one-sheet for rapid strategic decisions and boardroom-ready presentations.
Customers Bargaining Power

Large industrial and utility buyers
Large industrial and utility buyers—refined product wholesalers, airlines, petrochemical firms and utilities—use scale to secure volume discounts and tighter service SLAs. Their size increases price sensitivity and expectations for integrated offerings. Shell counters with bundled solutions across fuel, LNG, power and certificates and by offering multi-year contracts that trade price concessions for reliability. Utilities accounted for about 40% of global gas demand in 2024.
Commodity price transparency
Global benchmarks such as Brent, WTI and JKM make crude, LNG and refined products highly price-visible—Brent averaged about $86/bbl in 2024—enabling buyers to arbitrate across suppliers and hubs and increasing customer bargaining power. Buyers exploit hub spreads and spot liquidity to switch sources, pressuring margins. Shell’s trading scale and portfolio optionality enhance offer competitiveness, while structured hedges let buyers tailor risk without forcing deep upfront discounts.

Low switching costs in fuels retail
Drivers and commercial fleets can and do switch retailers based on price and convenience, pressuring margins across Shell’s network of around 44,000 retail sites globally. Loyalty programs and broad network coverage increase retention but are largely replicable by competitors and aggregators. Expansion of non-fuel retail and rollout of Shell Recharge EV points deepen customer ties and raise lifetime value. In tight markets, brand trust in fuel quality and availability still drives choice.

ESG and decarbonization demands
Buyers increasingly demand lower-carbon fuels, guarantees of origin and Scope 3 support, raising specification power and data-reporting burdens; Shell’s biofuels, SAF, LNG and renewable power lines target these needs, while EU carbon prices near €100/t in 2024 heighten purchaser leverage.
- Buyers: stronger spec and data demands
- Shell offerings: biofuels, SAF, LNG, renewables
- Market: premiums exist but narrowing as standards scale
Contracting structures shift power
Contracting structures—LNG SPAs, tolling agreements and indexation choices—redistribute price and volume risk between Shell and buyers, with destination flexibility and S-curve pricing giving buyers leverage in oversupplied markets. Shell’s portfolio flexibility lets it optimize cargos and manage take-or-pay exposure while buyer credit quality dictates stricter terms and collateral.
- LNG SPAs/tolling: risk split
- Indexation: oil vs gas basis shifts margin
- Destination flex/S-curve favors buyers in gluts
- Portfolio + cargo management mitigates take-or-pay
- Buyer credit drives collateral/terms
Scale buyers and utilities press margins as carbon costs and retail switching reshape fuel markets
Large industrial buyers and utilities (≈40% of global gas demand in 2024) use scale to secure discounts and service SLAs, increasing price sensitivity. Market price visibility (Brent ≈ $86/bbl in 2024) and hub arbitrage raise buyer leverage, offset by Shell trading/portfolio scale. Retail switching pressures margins across ≈44,000 Shell sites, while demand for low‑carbon fuels and EU carbon near €100/t in 2024 boosts specification power.
| Metric | 2024 Value |
|---|---|
| Brent average | $86/bbl |
| Shell retail sites | ≈44,000 |
| Utilities share of gas demand | ≈40% |
| EU carbon price | ≈€100/t |
Same Document Delivered
Shell Plc Porter's Five Forces Analysis
This preview shows the complete Shell Plc Porter's Five Forces analysis and is the exact document you'll receive after purchase—fully formatted and ready to use. It contains the same in-depth competitive assessment, sourcing, and strategic implications shown here, with instant access upon payment. No placeholders or samples.

Go Beyond the Preview—Access the Full Strategic Report
Shell Plc faces moderate supplier power, high buyer scrutiny, growing substitute threats from renewables, steep entry barriers due to capital intensity, and fierce rivalry among integrated majors. This Porter's Five Forces snapshot underscores pressures on margins, investment choices, and transition risk. Unlock the full Porter's Five Forces Analysis to explore Shell Plc’s competitive dynamics, market pressures, and strategic advantages in detail.
Suppliers Bargaining Power
OPEC/NOC control of upstream barrels
Core crude supply is concentrated in OPEC and state-owned producers, with OPEC+ supplying about 45% of global oil production in 2024, giving them coordination power over volumes and price. Shell mitigates this via geographic diversification and integrated LNG plus long-term offtake contracts and equity stakes, but remains exposed to quota shifts and geopolitical decisions. Unexpected curtailments can tighten feedstock and raise input costs.
Concentrated oilfield services and EPC
Specialized drilling, subsea and EPC contractors remain concentrated — Schlumberger, Halliburton and Baker Hughes accounted for roughly 40% of global oilfield services revenue in 2024 — giving suppliers leverage in tight cycles.
Industry EPC and equipment cost inflation ran near 8–10% in 2024 and subsea lead times stretched to about 12–18 months, raising Shell’s project capex and timelines.
Shell offsets pressure with framework agreements and digital procurement platforms; counter‑cyclic contracting can lock favorable rates but increases committed capex and timing risk.
Technologies and critical equipment dependence
Fewer than 10 global suppliers dominate liquefaction trains, catalysts and advanced control systems, concentrating supplier power; equipment qualification often exceeds 12 months and switching costs are high. Shell uses standardization and in-house R&D to compress uniqueness premiums and shorten commissioning. Co-development contracts and multi-year warranties (commonly 5–10 years) transfer significant performance and lifecycle risk back to suppliers.
Energy transition minerals and components
Regulatory and geopolitical constraints on supply
Regulatory and geopolitical constraints—sanctions, local content rules and permitting—raise supplier leverage by narrowing Shell’s alternative sources; local content mandates commonly require 20–60% domestic procurement, while sanctions since 2022 forced major re‑routing of supplies and asset exits. Compliance and requalification add an estimated 5–15% to project procurement costs, increasing complexity across the chain. Rapid political shifts can reprioritize suppliers overnight, amplifying supply risk and bargaining power.
- sanctions: forced supply reroutes, asset exits since 2022
- local content: 20–60% domestic sourcing mandates
- cost impact: +5–15% procurement/compliance
- risk: sudden political shifts reprioritize suppliers
Supplier concentration and 12–18 month lead times squeeze energy project costs
Suppliers hold significant leverage: OPEC+ supplied ~45% of oil in 2024 and top oilfield service firms (Schlumberger, Halliburton, Baker Hughes) captured ~40% of global OFS revenue, concentrating pricing power. EPC/equipment inflation ran ~8–10% in 2024 and subsea lead times stretched 12–18 months, raising Shell’s capex and timelines. Key equipment suppliers number <10 for liquefaction/catalysts, while local content rules (20–60%) and sanctions add 5–15% procurement cost.
| Metric | 2024 value |
|---|---|
| OPEC+ share | ~45% |
| Top OFS share | ~40% |
| EPC/equipment inflation | 8–10% |
| Subsea lead times | 12–18 months |
| Key liquefaction suppliers | <10 |
| Local content mandates | 20–60% |
| Procurement/compliance cost | +5–15% |
What is included in the product
Detailed Word Document
Comprehensive Porter's Five Forces assessment tailored to Shell Plc, uncovering competitive rivalry, supplier and buyer power, threat of substitutes and new entrants, plus disruptive forces and strategic implications for pricing and profitability.
Customizable Excel Spreadsheet
A concise Porter's Five Forces snapshot for Shell Plc—distills supplier/customer power, competitive rivalry, threat of substitutes and new entrants into an actionable one-sheet for rapid strategic decisions and boardroom-ready presentations.
Customers Bargaining Power
Large industrial and utility buyers
Large industrial and utility buyers—refined product wholesalers, airlines, petrochemical firms and utilities—use scale to secure volume discounts and tighter service SLAs. Their size increases price sensitivity and expectations for integrated offerings. Shell counters with bundled solutions across fuel, LNG, power and certificates and by offering multi-year contracts that trade price concessions for reliability. Utilities accounted for about 40% of global gas demand in 2024.
Commodity price transparency
Global benchmarks such as Brent, WTI and JKM make crude, LNG and refined products highly price-visible—Brent averaged about $86/bbl in 2024—enabling buyers to arbitrate across suppliers and hubs and increasing customer bargaining power. Buyers exploit hub spreads and spot liquidity to switch sources, pressuring margins. Shell’s trading scale and portfolio optionality enhance offer competitiveness, while structured hedges let buyers tailor risk without forcing deep upfront discounts.
Low switching costs in fuels retail
Drivers and commercial fleets can and do switch retailers based on price and convenience, pressuring margins across Shell’s network of around 44,000 retail sites globally. Loyalty programs and broad network coverage increase retention but are largely replicable by competitors and aggregators. Expansion of non-fuel retail and rollout of Shell Recharge EV points deepen customer ties and raise lifetime value. In tight markets, brand trust in fuel quality and availability still drives choice.
ESG and decarbonization demands
Buyers increasingly demand lower-carbon fuels, guarantees of origin and Scope 3 support, raising specification power and data-reporting burdens; Shell’s biofuels, SAF, LNG and renewable power lines target these needs, while EU carbon prices near €100/t in 2024 heighten purchaser leverage.
- Buyers: stronger spec and data demands
- Shell offerings: biofuels, SAF, LNG, renewables
- Market: premiums exist but narrowing as standards scale
Contracting structures shift power
Contracting structures—LNG SPAs, tolling agreements and indexation choices—redistribute price and volume risk between Shell and buyers, with destination flexibility and S-curve pricing giving buyers leverage in oversupplied markets. Shell’s portfolio flexibility lets it optimize cargos and manage take-or-pay exposure while buyer credit quality dictates stricter terms and collateral.
- LNG SPAs/tolling: risk split
- Indexation: oil vs gas basis shifts margin
- Destination flex/S-curve favors buyers in gluts
- Portfolio + cargo management mitigates take-or-pay
- Buyer credit drives collateral/terms
Scale buyers and utilities press margins as carbon costs and retail switching reshape fuel markets
Large industrial buyers and utilities (≈40% of global gas demand in 2024) use scale to secure discounts and service SLAs, increasing price sensitivity. Market price visibility (Brent ≈ $86/bbl in 2024) and hub arbitrage raise buyer leverage, offset by Shell trading/portfolio scale. Retail switching pressures margins across ≈44,000 Shell sites, while demand for low‑carbon fuels and EU carbon near €100/t in 2024 boosts specification power.
| Metric | 2024 Value |
|---|---|
| Brent average | $86/bbl |
| Shell retail sites | ≈44,000 |
| Utilities share of gas demand | ≈40% |
| EU carbon price | ≈€100/t |
Same Document Delivered
Shell Plc Porter's Five Forces Analysis
This preview shows the complete Shell Plc Porter's Five Forces analysis and is the exact document you'll receive after purchase—fully formatted and ready to use. It contains the same in-depth competitive assessment, sourcing, and strategic implications shown here, with instant access upon payment. No placeholders or samples.
Description
Go Beyond the Preview—Access the Full Strategic Report
Shell Plc faces moderate supplier power, high buyer scrutiny, growing substitute threats from renewables, steep entry barriers due to capital intensity, and fierce rivalry among integrated majors. This Porter's Five Forces snapshot underscores pressures on margins, investment choices, and transition risk. Unlock the full Porter's Five Forces Analysis to explore Shell Plc’s competitive dynamics, market pressures, and strategic advantages in detail.
Suppliers Bargaining Power
OPEC/NOC control of upstream barrels
Core crude supply is concentrated in OPEC and state-owned producers, with OPEC+ supplying about 45% of global oil production in 2024, giving them coordination power over volumes and price. Shell mitigates this via geographic diversification and integrated LNG plus long-term offtake contracts and equity stakes, but remains exposed to quota shifts and geopolitical decisions. Unexpected curtailments can tighten feedstock and raise input costs.
Concentrated oilfield services and EPC
Specialized drilling, subsea and EPC contractors remain concentrated — Schlumberger, Halliburton and Baker Hughes accounted for roughly 40% of global oilfield services revenue in 2024 — giving suppliers leverage in tight cycles.
Industry EPC and equipment cost inflation ran near 8–10% in 2024 and subsea lead times stretched to about 12–18 months, raising Shell’s project capex and timelines.
Shell offsets pressure with framework agreements and digital procurement platforms; counter‑cyclic contracting can lock favorable rates but increases committed capex and timing risk.
Technologies and critical equipment dependence
Fewer than 10 global suppliers dominate liquefaction trains, catalysts and advanced control systems, concentrating supplier power; equipment qualification often exceeds 12 months and switching costs are high. Shell uses standardization and in-house R&D to compress uniqueness premiums and shorten commissioning. Co-development contracts and multi-year warranties (commonly 5–10 years) transfer significant performance and lifecycle risk back to suppliers.
Energy transition minerals and components
Regulatory and geopolitical constraints on supply
Regulatory and geopolitical constraints—sanctions, local content rules and permitting—raise supplier leverage by narrowing Shell’s alternative sources; local content mandates commonly require 20–60% domestic procurement, while sanctions since 2022 forced major re‑routing of supplies and asset exits. Compliance and requalification add an estimated 5–15% to project procurement costs, increasing complexity across the chain. Rapid political shifts can reprioritize suppliers overnight, amplifying supply risk and bargaining power.
- sanctions: forced supply reroutes, asset exits since 2022
- local content: 20–60% domestic sourcing mandates
- cost impact: +5–15% procurement/compliance
- risk: sudden political shifts reprioritize suppliers
Supplier concentration and 12–18 month lead times squeeze energy project costs
Suppliers hold significant leverage: OPEC+ supplied ~45% of oil in 2024 and top oilfield service firms (Schlumberger, Halliburton, Baker Hughes) captured ~40% of global OFS revenue, concentrating pricing power. EPC/equipment inflation ran ~8–10% in 2024 and subsea lead times stretched 12–18 months, raising Shell’s capex and timelines. Key equipment suppliers number <10 for liquefaction/catalysts, while local content rules (20–60%) and sanctions add 5–15% procurement cost.
| Metric | 2024 value |
|---|---|
| OPEC+ share | ~45% |
| Top OFS share | ~40% |
| EPC/equipment inflation | 8–10% |
| Subsea lead times | 12–18 months |
| Key liquefaction suppliers | <10 |
| Local content mandates | 20–60% |
| Procurement/compliance cost | +5–15% |
What is included in the product
Detailed Word Document
Comprehensive Porter's Five Forces assessment tailored to Shell Plc, uncovering competitive rivalry, supplier and buyer power, threat of substitutes and new entrants, plus disruptive forces and strategic implications for pricing and profitability.
Customizable Excel Spreadsheet
A concise Porter's Five Forces snapshot for Shell Plc—distills supplier/customer power, competitive rivalry, threat of substitutes and new entrants into an actionable one-sheet for rapid strategic decisions and boardroom-ready presentations.
Customers Bargaining Power
Large industrial and utility buyers
Large industrial and utility buyers—refined product wholesalers, airlines, petrochemical firms and utilities—use scale to secure volume discounts and tighter service SLAs. Their size increases price sensitivity and expectations for integrated offerings. Shell counters with bundled solutions across fuel, LNG, power and certificates and by offering multi-year contracts that trade price concessions for reliability. Utilities accounted for about 40% of global gas demand in 2024.
Commodity price transparency
Global benchmarks such as Brent, WTI and JKM make crude, LNG and refined products highly price-visible—Brent averaged about $86/bbl in 2024—enabling buyers to arbitrate across suppliers and hubs and increasing customer bargaining power. Buyers exploit hub spreads and spot liquidity to switch sources, pressuring margins. Shell’s trading scale and portfolio optionality enhance offer competitiveness, while structured hedges let buyers tailor risk without forcing deep upfront discounts.
Low switching costs in fuels retail
Drivers and commercial fleets can and do switch retailers based on price and convenience, pressuring margins across Shell’s network of around 44,000 retail sites globally. Loyalty programs and broad network coverage increase retention but are largely replicable by competitors and aggregators. Expansion of non-fuel retail and rollout of Shell Recharge EV points deepen customer ties and raise lifetime value. In tight markets, brand trust in fuel quality and availability still drives choice.
ESG and decarbonization demands
Buyers increasingly demand lower-carbon fuels, guarantees of origin and Scope 3 support, raising specification power and data-reporting burdens; Shell’s biofuels, SAF, LNG and renewable power lines target these needs, while EU carbon prices near €100/t in 2024 heighten purchaser leverage.
- Buyers: stronger spec and data demands
- Shell offerings: biofuels, SAF, LNG, renewables
- Market: premiums exist but narrowing as standards scale
Contracting structures shift power
Contracting structures—LNG SPAs, tolling agreements and indexation choices—redistribute price and volume risk between Shell and buyers, with destination flexibility and S-curve pricing giving buyers leverage in oversupplied markets. Shell’s portfolio flexibility lets it optimize cargos and manage take-or-pay exposure while buyer credit quality dictates stricter terms and collateral.
- LNG SPAs/tolling: risk split
- Indexation: oil vs gas basis shifts margin
- Destination flex/S-curve favors buyers in gluts
- Portfolio + cargo management mitigates take-or-pay
- Buyer credit drives collateral/terms
Scale buyers and utilities press margins as carbon costs and retail switching reshape fuel markets
Large industrial buyers and utilities (≈40% of global gas demand in 2024) use scale to secure discounts and service SLAs, increasing price sensitivity. Market price visibility (Brent ≈ $86/bbl in 2024) and hub arbitrage raise buyer leverage, offset by Shell trading/portfolio scale. Retail switching pressures margins across ≈44,000 Shell sites, while demand for low‑carbon fuels and EU carbon near €100/t in 2024 boosts specification power.
| Metric | 2024 Value |
|---|---|
| Brent average | $86/bbl |
| Shell retail sites | ≈44,000 |
| Utilities share of gas demand | ≈40% |
| EU carbon price | ≈€100/t |
Same Document Delivered
Shell Plc Porter's Five Forces Analysis
This preview shows the complete Shell Plc Porter's Five Forces analysis and is the exact document you'll receive after purchase—fully formatted and ready to use. It contains the same in-depth competitive assessment, sourcing, and strategic implications shown here, with instant access upon payment. No placeholders or samples.











