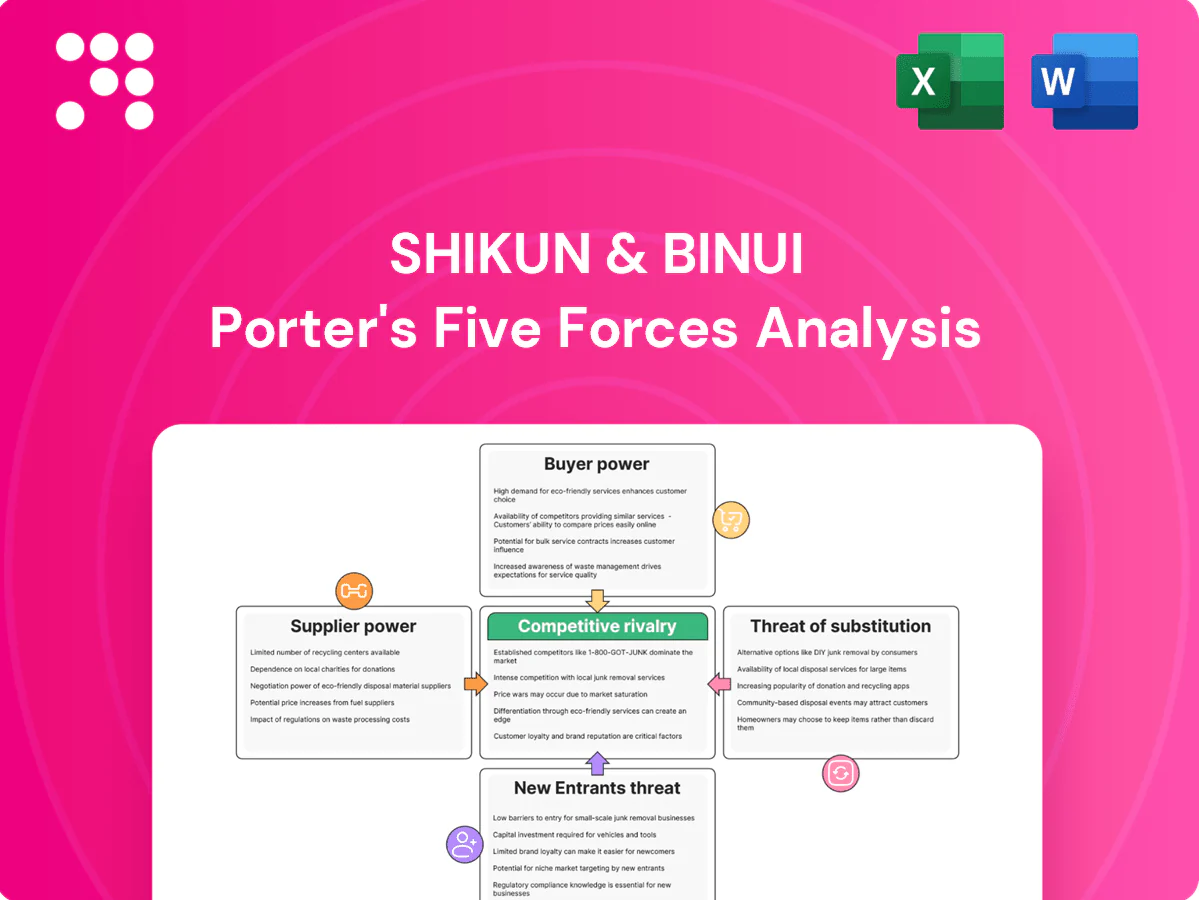
Shikun & Binui Porter's Five Forces Analysis

From Overview to Strategy Blueprint
Shikun & Binui faces moderate buyer power, concentrated suppliers for key construction inputs, regulatory barriers that limit new entrants, and limited substitute threats due to project specificity. This snapshot highlights core competitive pressures and strategic levers. Unlock the full Porter's Five Forces Analysis to access force-by-force ratings, visuals, and actionable recommendations tailored to Shikun & Binui.
Suppliers Bargaining Power

Concentrated raw materials
Steel, cement, asphalt and aggregates in Shikun & Binui projects are sourced from a concentrated set of regional suppliers, with top-three suppliers often controlling over 60% of local supply, raising switching costs and price exposure. Commodity cycles and energy inputs — which can represent roughly one-third of cement production cost — amplify supplier leverage during upswings. Long-term framework agreements reduce volatility but demand scale and strong balance sheets. Project-specific specifications further limit substitution options.
Specialized equipment
Heavy machinery, tunneling gear and grid components for Shikun & Binui frequently come from a few OEMs, with TBM leaders like Herrenknecht and The Robbins Company dominating supply and lead times often 12–24 months. Availability constraints can delay schedules and raise rental or purchase costs. Long-term service contracts and spare-parts lock-in increase supplier dependency. Global supply-chain shocks in 2022–2023 further tightened supply.

Skilled labor/subcontractors
Complex EPC and PPP projects rely on scarce certified trades and niche subcontractors, giving suppliers elevated leverage over Shikun & Binui. Tight labor markets pushed construction wages up an estimated 6–8% in peak 2024 cycles, increasing subcontractor bargaining power and margins. Union agreements and local content rules further constrain flexibility, though workforce planning and training partnerships—including apprenticeship programs covering roughly 40% of new hires in recent cohorts—partially mitigate the risk.

Renewables technology vendors
Renewables technology vendors exert strong supplier power for Shikun & Binui: PV module prices averaged about 0.22 USD/W in 2024, inverters are concentrated (top 3 ~60% global share) and battery cells (top 5 ~80% share in 2024), while 25-year performance warranties and bankability criteria limit acceptable suppliers; FX swings and import constraints rapidly shift pricing, and volume commitments improve terms but raise concentration risk.
- PV modules: 0.22 USD/W (2024)
- Inverters: top 3 ~60% share (2024)
- Battery cells: top 5 ~80% share (2024)
- Warranties: 25-year standard
Logistics and compliance
Customs, shipping, and regulatory approvals can bottleneck inputs for Shikun & Binui, with 2024 port congestion remaining elevated versus pre‑pandemic levels and liquidated damages clauses commonly set at 0.05–0.5% of contract value per day, increasing leverage for timely suppliers. Environmental and safety standards add supplier qualification hurdles; delays cascade into penalties, while multi‑sourcing and nearshoring lower but do not eliminate exposure.
- Customs bottlenecks: higher delay risk
- LDs: 0.05–0.5%/day
- Environmental standards: stricter supplier vetting
- Multi‑sourcing/nearshoring: risk reduction, not elimination
Supply squeeze: top-3 >60% share, OEM lead times 12–24 months, margins +6–8% in 2024
Supplier power is high: top-three raw-material suppliers often >60% local share, driving price and switching costs. OEMs for TBMs and renewables show long lead times (12–24 months) and concentration (battery cells top‑5 ~80%, inverters top‑3 ~60%). Labor/subcontractor scarcity lifted margins ~6–8% in 2024.
| Category | Metric | 2024 |
|---|---|---|
| Raw materials | Top‑3 share | >60% |
| PV modules | Price | 0.22 USD/W |
| TBM/OEM | Lead time | 12–24 months |
| Battery cells | Top‑5 share | ~80% |
What is included in the product
 Detailed Word Document
Uncovers key drivers of competition, customer influence, and market entry risks tailored to Shikun & Binui, analyzing supplier and buyer power, substitutes, new entrants, and competitive rivalry to highlight strategic threats, growth barriers, and opportunities for profitability and resilience.

 Customizable Excel Spreadsheet
One-sheet Porter's Five Forces for Shikun & Binui—clarifies competitive pressures, customizable inputs for market/regulatory shifts, and a spider chart-ready layout to drop straight into pitch decks or Excel dashboards.
Customers Bargaining Power

Government/PPP dominance
Public authorities and state agencies are the dominant clients for Shikun & Binui; public procurement accounts for about 12% of GDP in OECD countries (OECD, 2024), giving buyers institutional scale and expertise. Competitive tenders with strict KPIs and penalty regimes sharpen buyer leverage, while budget cycles and political oversight create episodic pricing pressure. Reputation and delivery record become critical to retaining bargaining position.
Competitive bidding
Open tenders attract numerous qualified bidders, compressing margins and driving competitive premiums down; in many markets bid bonds are 1–5% while performance guarantees range 5–10% of contract value. Buyers increasingly insist on turnkey, fixed-price or availability-based contracts that transfer risk to contractors. Transparent scoring frameworks improve comparability and heighten price sensitivity. These procurement terms force contractors to price tightly and preserve liquidity.

Large contract size
High-value, multi-year projects give buyers strong leverage to negotiate volume discounts and tougher payment terms; in 2024 construction practice retention withholdings commonly range 5–10% which squeezes contractor liquidity. Milestone payments and staged billing dictate cash flow timing, while strict change-order governance often constrains recovery of cost overruns. Preferred bidder status secures pipeline access but usually offers limited pricing latitude.

Private developers and utilities
Private developers and utilities in 2024 aggressively benchmark regional EPCs against global best pricing, contributing to record-low bids (utility-scale solar PPAs fell to roughly 20–30 USD/MWh in some markets). Frameworks and master service agreements tighten terms and SLAs, shifting commercial levers into contractual penalties. Bankability demands push risk to contractors via performance security and lender-driven clauses. Long-standing client relationships moderate price aggression but remain strictly performance-driven.
- Benchmarking: global vs regional pricing
- Contracts: tighter MSAs and SLAs
- Bankability: contractor risk allocation
- Relationships: reduce but not remove performance focus
Sustainability and localization
Sustainability and localization increasingly form binding contract terms for Shikun & Binui as the EU CSRD took effect for large firms in 2024, elevating ESG, local content and community commitments into auditable obligations; buyers leverage these criteria to extract value-add without proportional price uplifts. Reporting and third-party audit rights expand oversight, and compliance failures can trigger payment holdbacks and reputational loss.
- ESG: CSRD effective 2024 — mandatory reporting and assurance
- Local content: contractual KPI links to community commitments
- Oversight: expanded audit/reporting rights
- Risk: payment holdbacks, reputational damage
Public procurement scale, tight margins and CSRD drive liquidity pressure in 2024 contracts
Public procurement (≈12% of OECD GDP in 2024) gives buyers institutional scale and strong leverage, with competitive tenders compressing margins and forcing tight pricing. Common 2024 contract terms—bid bonds 1–5%, retention 5–10%—squeeze contractor liquidity and cash flow. CSRD effective 2024 raises ESG/local-content clauses, increasing compliance costs and buyer negotiating power.
| Metric | 2024 Data | Impact |
|---|---|---|
| Public procurement | ~12% GDP (OECD) | Buyer scale, expertise |
| Bid bonds | 1–5% | Prequalification pressure |
| Retention | 5–10% | Liquidity squeeze |
| Solar PPA | 20–30 USD/MWh | Price benchmarking |
What You See Is What You Get
Shikun & Binui Porter's Five Forces Analysis
This preview shows the exact Shikun & Binui Porter's Five Forces Analysis you'll receive after purchase—no placeholders or mockups. The full document is professionally formatted and ready for download the moment you buy. What you see here is precisely the file you'll get, immediately usable for analysis or presentation.

From Overview to Strategy Blueprint
Shikun & Binui faces moderate buyer power, concentrated suppliers for key construction inputs, regulatory barriers that limit new entrants, and limited substitute threats due to project specificity. This snapshot highlights core competitive pressures and strategic levers. Unlock the full Porter's Five Forces Analysis to access force-by-force ratings, visuals, and actionable recommendations tailored to Shikun & Binui.
Suppliers Bargaining Power
Concentrated raw materials
Steel, cement, asphalt and aggregates in Shikun & Binui projects are sourced from a concentrated set of regional suppliers, with top-three suppliers often controlling over 60% of local supply, raising switching costs and price exposure. Commodity cycles and energy inputs — which can represent roughly one-third of cement production cost — amplify supplier leverage during upswings. Long-term framework agreements reduce volatility but demand scale and strong balance sheets. Project-specific specifications further limit substitution options.
Specialized equipment
Heavy machinery, tunneling gear and grid components for Shikun & Binui frequently come from a few OEMs, with TBM leaders like Herrenknecht and The Robbins Company dominating supply and lead times often 12–24 months. Availability constraints can delay schedules and raise rental or purchase costs. Long-term service contracts and spare-parts lock-in increase supplier dependency. Global supply-chain shocks in 2022–2023 further tightened supply.
Skilled labor/subcontractors
Complex EPC and PPP projects rely on scarce certified trades and niche subcontractors, giving suppliers elevated leverage over Shikun & Binui. Tight labor markets pushed construction wages up an estimated 6–8% in peak 2024 cycles, increasing subcontractor bargaining power and margins. Union agreements and local content rules further constrain flexibility, though workforce planning and training partnerships—including apprenticeship programs covering roughly 40% of new hires in recent cohorts—partially mitigate the risk.
Renewables technology vendors
Renewables technology vendors exert strong supplier power for Shikun & Binui: PV module prices averaged about 0.22 USD/W in 2024, inverters are concentrated (top 3 ~60% global share) and battery cells (top 5 ~80% share in 2024), while 25-year performance warranties and bankability criteria limit acceptable suppliers; FX swings and import constraints rapidly shift pricing, and volume commitments improve terms but raise concentration risk.
- PV modules: 0.22 USD/W (2024)
- Inverters: top 3 ~60% share (2024)
- Battery cells: top 5 ~80% share (2024)
- Warranties: 25-year standard
Logistics and compliance
Customs, shipping, and regulatory approvals can bottleneck inputs for Shikun & Binui, with 2024 port congestion remaining elevated versus pre‑pandemic levels and liquidated damages clauses commonly set at 0.05–0.5% of contract value per day, increasing leverage for timely suppliers. Environmental and safety standards add supplier qualification hurdles; delays cascade into penalties, while multi‑sourcing and nearshoring lower but do not eliminate exposure.
- Customs bottlenecks: higher delay risk
- LDs: 0.05–0.5%/day
- Environmental standards: stricter supplier vetting
- Multi‑sourcing/nearshoring: risk reduction, not elimination
Supply squeeze: top-3 >60% share, OEM lead times 12–24 months, margins +6–8% in 2024
Supplier power is high: top-three raw-material suppliers often >60% local share, driving price and switching costs. OEMs for TBMs and renewables show long lead times (12–24 months) and concentration (battery cells top‑5 ~80%, inverters top‑3 ~60%). Labor/subcontractor scarcity lifted margins ~6–8% in 2024.
| Category | Metric | 2024 |
|---|---|---|
| Raw materials | Top‑3 share | >60% |
| PV modules | Price | 0.22 USD/W |
| TBM/OEM | Lead time | 12–24 months |
| Battery cells | Top‑5 share | ~80% |
What is included in the product
Detailed Word Document
Uncovers key drivers of competition, customer influence, and market entry risks tailored to Shikun & Binui, analyzing supplier and buyer power, substitutes, new entrants, and competitive rivalry to highlight strategic threats, growth barriers, and opportunities for profitability and resilience.
Customizable Excel Spreadsheet
One-sheet Porter's Five Forces for Shikun & Binui—clarifies competitive pressures, customizable inputs for market/regulatory shifts, and a spider chart-ready layout to drop straight into pitch decks or Excel dashboards.
Customers Bargaining Power
Government/PPP dominance
Public authorities and state agencies are the dominant clients for Shikun & Binui; public procurement accounts for about 12% of GDP in OECD countries (OECD, 2024), giving buyers institutional scale and expertise. Competitive tenders with strict KPIs and penalty regimes sharpen buyer leverage, while budget cycles and political oversight create episodic pricing pressure. Reputation and delivery record become critical to retaining bargaining position.
Competitive bidding
Open tenders attract numerous qualified bidders, compressing margins and driving competitive premiums down; in many markets bid bonds are 1–5% while performance guarantees range 5–10% of contract value. Buyers increasingly insist on turnkey, fixed-price or availability-based contracts that transfer risk to contractors. Transparent scoring frameworks improve comparability and heighten price sensitivity. These procurement terms force contractors to price tightly and preserve liquidity.
Large contract size
High-value, multi-year projects give buyers strong leverage to negotiate volume discounts and tougher payment terms; in 2024 construction practice retention withholdings commonly range 5–10% which squeezes contractor liquidity. Milestone payments and staged billing dictate cash flow timing, while strict change-order governance often constrains recovery of cost overruns. Preferred bidder status secures pipeline access but usually offers limited pricing latitude.
Private developers and utilities
Private developers and utilities in 2024 aggressively benchmark regional EPCs against global best pricing, contributing to record-low bids (utility-scale solar PPAs fell to roughly 20–30 USD/MWh in some markets). Frameworks and master service agreements tighten terms and SLAs, shifting commercial levers into contractual penalties. Bankability demands push risk to contractors via performance security and lender-driven clauses. Long-standing client relationships moderate price aggression but remain strictly performance-driven.
- Benchmarking: global vs regional pricing
- Contracts: tighter MSAs and SLAs
- Bankability: contractor risk allocation
- Relationships: reduce but not remove performance focus
Sustainability and localization
Sustainability and localization increasingly form binding contract terms for Shikun & Binui as the EU CSRD took effect for large firms in 2024, elevating ESG, local content and community commitments into auditable obligations; buyers leverage these criteria to extract value-add without proportional price uplifts. Reporting and third-party audit rights expand oversight, and compliance failures can trigger payment holdbacks and reputational loss.
- ESG: CSRD effective 2024 — mandatory reporting and assurance
- Local content: contractual KPI links to community commitments
- Oversight: expanded audit/reporting rights
- Risk: payment holdbacks, reputational damage
Public procurement scale, tight margins and CSRD drive liquidity pressure in 2024 contracts
Public procurement (≈12% of OECD GDP in 2024) gives buyers institutional scale and strong leverage, with competitive tenders compressing margins and forcing tight pricing. Common 2024 contract terms—bid bonds 1–5%, retention 5–10%—squeeze contractor liquidity and cash flow. CSRD effective 2024 raises ESG/local-content clauses, increasing compliance costs and buyer negotiating power.
| Metric | 2024 Data | Impact |
|---|---|---|
| Public procurement | ~12% GDP (OECD) | Buyer scale, expertise |
| Bid bonds | 1–5% | Prequalification pressure |
| Retention | 5–10% | Liquidity squeeze |
| Solar PPA | 20–30 USD/MWh | Price benchmarking |
What You See Is What You Get
Shikun & Binui Porter's Five Forces Analysis
This preview shows the exact Shikun & Binui Porter's Five Forces Analysis you'll receive after purchase—no placeholders or mockups. The full document is professionally formatted and ready for download the moment you buy. What you see here is precisely the file you'll get, immediately usable for analysis or presentation.
Description
From Overview to Strategy Blueprint
Shikun & Binui faces moderate buyer power, concentrated suppliers for key construction inputs, regulatory barriers that limit new entrants, and limited substitute threats due to project specificity. This snapshot highlights core competitive pressures and strategic levers. Unlock the full Porter's Five Forces Analysis to access force-by-force ratings, visuals, and actionable recommendations tailored to Shikun & Binui.
Suppliers Bargaining Power
Concentrated raw materials
Steel, cement, asphalt and aggregates in Shikun & Binui projects are sourced from a concentrated set of regional suppliers, with top-three suppliers often controlling over 60% of local supply, raising switching costs and price exposure. Commodity cycles and energy inputs — which can represent roughly one-third of cement production cost — amplify supplier leverage during upswings. Long-term framework agreements reduce volatility but demand scale and strong balance sheets. Project-specific specifications further limit substitution options.
Specialized equipment
Heavy machinery, tunneling gear and grid components for Shikun & Binui frequently come from a few OEMs, with TBM leaders like Herrenknecht and The Robbins Company dominating supply and lead times often 12–24 months. Availability constraints can delay schedules and raise rental or purchase costs. Long-term service contracts and spare-parts lock-in increase supplier dependency. Global supply-chain shocks in 2022–2023 further tightened supply.
Skilled labor/subcontractors
Complex EPC and PPP projects rely on scarce certified trades and niche subcontractors, giving suppliers elevated leverage over Shikun & Binui. Tight labor markets pushed construction wages up an estimated 6–8% in peak 2024 cycles, increasing subcontractor bargaining power and margins. Union agreements and local content rules further constrain flexibility, though workforce planning and training partnerships—including apprenticeship programs covering roughly 40% of new hires in recent cohorts—partially mitigate the risk.
Renewables technology vendors
Renewables technology vendors exert strong supplier power for Shikun & Binui: PV module prices averaged about 0.22 USD/W in 2024, inverters are concentrated (top 3 ~60% global share) and battery cells (top 5 ~80% share in 2024), while 25-year performance warranties and bankability criteria limit acceptable suppliers; FX swings and import constraints rapidly shift pricing, and volume commitments improve terms but raise concentration risk.
- PV modules: 0.22 USD/W (2024)
- Inverters: top 3 ~60% share (2024)
- Battery cells: top 5 ~80% share (2024)
- Warranties: 25-year standard
Logistics and compliance
Customs, shipping, and regulatory approvals can bottleneck inputs for Shikun & Binui, with 2024 port congestion remaining elevated versus pre‑pandemic levels and liquidated damages clauses commonly set at 0.05–0.5% of contract value per day, increasing leverage for timely suppliers. Environmental and safety standards add supplier qualification hurdles; delays cascade into penalties, while multi‑sourcing and nearshoring lower but do not eliminate exposure.
- Customs bottlenecks: higher delay risk
- LDs: 0.05–0.5%/day
- Environmental standards: stricter supplier vetting
- Multi‑sourcing/nearshoring: risk reduction, not elimination
Supply squeeze: top-3 >60% share, OEM lead times 12–24 months, margins +6–8% in 2024
Supplier power is high: top-three raw-material suppliers often >60% local share, driving price and switching costs. OEMs for TBMs and renewables show long lead times (12–24 months) and concentration (battery cells top‑5 ~80%, inverters top‑3 ~60%). Labor/subcontractor scarcity lifted margins ~6–8% in 2024.
| Category | Metric | 2024 |
|---|---|---|
| Raw materials | Top‑3 share | >60% |
| PV modules | Price | 0.22 USD/W |
| TBM/OEM | Lead time | 12–24 months |
| Battery cells | Top‑5 share | ~80% |
What is included in the product
Detailed Word Document
Uncovers key drivers of competition, customer influence, and market entry risks tailored to Shikun & Binui, analyzing supplier and buyer power, substitutes, new entrants, and competitive rivalry to highlight strategic threats, growth barriers, and opportunities for profitability and resilience.
Customizable Excel Spreadsheet
One-sheet Porter's Five Forces for Shikun & Binui—clarifies competitive pressures, customizable inputs for market/regulatory shifts, and a spider chart-ready layout to drop straight into pitch decks or Excel dashboards.
Customers Bargaining Power
Government/PPP dominance
Public authorities and state agencies are the dominant clients for Shikun & Binui; public procurement accounts for about 12% of GDP in OECD countries (OECD, 2024), giving buyers institutional scale and expertise. Competitive tenders with strict KPIs and penalty regimes sharpen buyer leverage, while budget cycles and political oversight create episodic pricing pressure. Reputation and delivery record become critical to retaining bargaining position.
Competitive bidding
Open tenders attract numerous qualified bidders, compressing margins and driving competitive premiums down; in many markets bid bonds are 1–5% while performance guarantees range 5–10% of contract value. Buyers increasingly insist on turnkey, fixed-price or availability-based contracts that transfer risk to contractors. Transparent scoring frameworks improve comparability and heighten price sensitivity. These procurement terms force contractors to price tightly and preserve liquidity.
Large contract size
High-value, multi-year projects give buyers strong leverage to negotiate volume discounts and tougher payment terms; in 2024 construction practice retention withholdings commonly range 5–10% which squeezes contractor liquidity. Milestone payments and staged billing dictate cash flow timing, while strict change-order governance often constrains recovery of cost overruns. Preferred bidder status secures pipeline access but usually offers limited pricing latitude.
Private developers and utilities
Private developers and utilities in 2024 aggressively benchmark regional EPCs against global best pricing, contributing to record-low bids (utility-scale solar PPAs fell to roughly 20–30 USD/MWh in some markets). Frameworks and master service agreements tighten terms and SLAs, shifting commercial levers into contractual penalties. Bankability demands push risk to contractors via performance security and lender-driven clauses. Long-standing client relationships moderate price aggression but remain strictly performance-driven.
- Benchmarking: global vs regional pricing
- Contracts: tighter MSAs and SLAs
- Bankability: contractor risk allocation
- Relationships: reduce but not remove performance focus
Sustainability and localization
Sustainability and localization increasingly form binding contract terms for Shikun & Binui as the EU CSRD took effect for large firms in 2024, elevating ESG, local content and community commitments into auditable obligations; buyers leverage these criteria to extract value-add without proportional price uplifts. Reporting and third-party audit rights expand oversight, and compliance failures can trigger payment holdbacks and reputational loss.
- ESG: CSRD effective 2024 — mandatory reporting and assurance
- Local content: contractual KPI links to community commitments
- Oversight: expanded audit/reporting rights
- Risk: payment holdbacks, reputational damage
Public procurement scale, tight margins and CSRD drive liquidity pressure in 2024 contracts
Public procurement (≈12% of OECD GDP in 2024) gives buyers institutional scale and strong leverage, with competitive tenders compressing margins and forcing tight pricing. Common 2024 contract terms—bid bonds 1–5%, retention 5–10%—squeeze contractor liquidity and cash flow. CSRD effective 2024 raises ESG/local-content clauses, increasing compliance costs and buyer negotiating power.
| Metric | 2024 Data | Impact |
|---|---|---|
| Public procurement | ~12% GDP (OECD) | Buyer scale, expertise |
| Bid bonds | 1–5% | Prequalification pressure |
| Retention | 5–10% | Liquidity squeeze |
| Solar PPA | 20–30 USD/MWh | Price benchmarking |
What You See Is What You Get
Shikun & Binui Porter's Five Forces Analysis
This preview shows the exact Shikun & Binui Porter's Five Forces Analysis you'll receive after purchase—no placeholders or mockups. The full document is professionally formatted and ready for download the moment you buy. What you see here is precisely the file you'll get, immediately usable for analysis or presentation.











