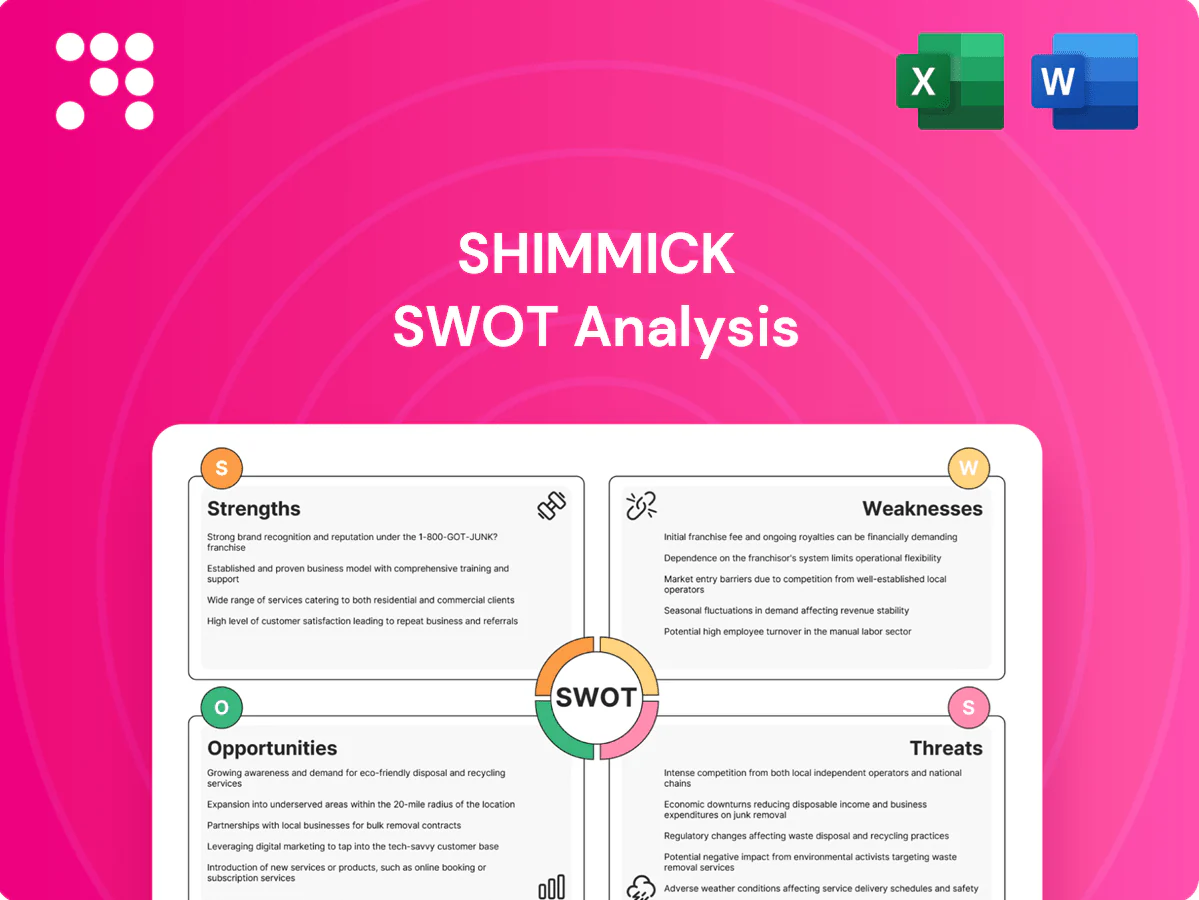
Shimmick SWOT Analysis

Your Strategic Toolkit Starts Here
Explore Shimmick’s competitive edge and hidden risks with this concise SWOT snapshot—covering project backlog, regional exposure, and operational strengths. Want the full picture? Purchase the complete SWOT analysis for a research-backed, editable Word report and Excel matrix to inform strategy, pitches, and investment decisions.
Strengths

Complex infrastructure expertise
Proven capability in bridges, water, and transportation raises Shimmick’s win probability on technical bids, leveraging demand from the Bipartisan Infrastructure Law which allocates about $110 billion for roads and bridges. Depth in complex means and risk management improves execution certainty and cuts schedule overruns. This reputation supports premium prequalification and reduces learning curves on similar future projects.
Design-build delivery proficiency
Shimmick leverages design-build delivery to compress schedules and reduce interface risks, aligning design and construction under one contract and improving on-time performance. Single-point accountability appeals to public owners seeking schedule and cost certainty, contributing to higher win rates in negotiated procurements. Early contractor involvement enables cost optimization and constructability trade-offs; design-build accounted for about 42% of U.S. public infrastructure project value per DBIA-era data.

Diverse public and private client base
Working across municipalities, state agencies and private owners smooths revenue cycles and reduces dependence on any single funding stream, improving resilience during budget swings. A broad portfolio enables cross-selling of project management and design-build capabilities, increasing share of wallet per client. It also widens the pipeline for large pursuits by tapping multiple procurement channels and funding sources.

Large-scale project management
Shimmick’s experience coordinating multi-stakeholder megaprojects materially reduces coordination risk, with disciplined PMO processes driving improved schedule adherence, safety performance, and quality control, supporting stronger on-time, on-budget delivery metrics and higher bonding/surety confidence.
- PMO maturity: higher on-time delivery (PMI 2023)
- Reduced coordination risk: multi-stakeholder expertise
- Improved safety/quality: consistent outcomes
- Enhanced surety: stronger bonding confidence
Water and wastewater specialization
Technical strength in water and wastewater places Shimmick in durable demand as regulatory-driven upgrades and lead service line replacement needs (EPA estimated ~45 billion USD) create steady backlog; process know-how boosts margins versus generic civil work and aligns the firm with climate resilience and adaptation programs.
- Durable demand: regulatory backlog
- EPA lead pipe cost ~45B USD
- Higher margins via process expertise
- Positioned for climate resilience projects
Design-build edge raises win odds for $110B roads & $45B water work
Proven bridge/water/transport capability raises win probability amid ~$110B roads/bridges funding and ~$45B EPA lead-pipe backlog, boosting margins on regulated work. Design-build expertise (≈42% public infra value) compresses schedules and lowers interface risk. Broad client mix and mature PMO (PMI 2023) improve revenue resilience and bonding confidence.
| Strength | Evidence | Metric | Source |
|---|---|---|---|
| Market demand | Roads/bridges funding | $110B | BIL 2021 |
| Regulated water | Lead service backlog | $45B | EPA est. |
| Delivery model | Design-build share | ≈42% | DBIA data |
What is included in the product
 Detailed Word Document
Provides a concise SWOT analysis of Shimmick, highlighting internal strengths and weaknesses and external opportunities and threats to assess competitive positioning and strategic risks.

 Customizable Excel Spreadsheet
Provides a concise, editable SWOT matrix tailored to Shimmick for fast strategy alignment and quick stakeholder-ready summaries, streamlining communication of strengths, weaknesses, opportunities and threats. Ideal for executives and teams needing a clean, at-a-glance view that’s easy to update and integrate into reports or presentations.
Weaknesses

Exposure to low-margin contracts
Shimmick's exposure to low-margin heavy civil contracts is acute: ENR 2024 reports typical heavy civil net margins of roughly 2–5%, so aggressive bidding quickly compresses profits. Fixed-price terms transfer overrun risk to contractors, where even 1–2% productivity slippage can wipe out margins. Industry data show claims recovery often takes 12–24 months, creating cash-flow and certainty challenges.
High working capital and bonding needs
Large projects force Shimmick to post performance bonds and letters of credit—performance bonds are typically 5–10% of contract value—tying up substantial cash and limiting bid capacity on simultaneous tenders. Tighter credit since 2022 increased surety and financing scrutiny, raising effective funding costs and reducing leverage for growth. This elevates sensitivity to cash‑flow timing, especially on projects with 6–12 month receivable cycles.

Schedule and change-order risk
Permitting, utilities and third-party delays can cascade into liquidated damages and claims; large construction projects typically take about 20% longer than scheduled and can be up to 80% over budget (McKinsey), amplifying penalty exposure.
Complex, multi-disciplinary scopes increase design changes and disputes, driving variation orders and rework.
Protracted negotiations over change orders tie up cash and management bandwidth, while heavy documentation and claims processing strain project teams and reduce effective margin.

Subcontractor and supplier dependence
Subcontractor and supplier dependence constrains Shimmick’s execution when specialty trades or heavy equipment are scarce, increasing schedule risk and unit costs. Global and regional supply shocks have repeatedly pushed lead times and margins upward, while limited local vendor pools create concentration risk. This dependency also complicates ensuring consistent quality across regions.
- Specialty-trade shortages
- Equipment availability bottlenecks
- Concentration risk from small local vendor pools
- Regional quality-control challenges
Geographic concentration exposure
Operating primarily in concentrated regions raises Shimmick's exposure to localized economic shocks; US construction put-in-place was about $1.9 trillion in 2024, so regional slowdowns can materially hit backlog and revenue. A local market slowdown can compress backlog and cash flow quickly, while entering new markets incurs ramp-up and learning costs that can dilute margins during expansion.
- Concentration risk: regional revenue exposure
- Backlog sensitivity: local slowdowns compress projects
- Expansion cost: ramp-up and learning expenses
- Margin pressure: dilution during geographic growth
Margins at 2-5% as bonds and 20% delays squeeze cash
Shimmick faces low heavy‑civil net margins (2–5% ENR 2024), where 1–2% productivity slippage erodes profitability and claims recovery often takes 12–24 months. Performance bonds (5–10% of contract value) and tighter surety since 2022 constrain cash and bid capacity, while projects run ~20% longer than planned (McKinsey), raising liquidated damages risk. Regional concentration vs US $1.9T put‑in‑place (2024) heightens local demand exposure.
| Metric | Value |
|---|---|
| Net margins | 2–5% |
| Productivity sensitivity | 1–2% margin impact |
| Bond requirement | 5–10% contract |
| Claims lag | 12–24 months |
| Project delay | ~20% longer |
| US construction | $1.9T (2024) |
Preview the Actual Deliverable
Shimmick SWOT Analysis
This is the actual Shimmick SWOT analysis document you’ll receive upon purchase—no surprises, just professional quality. The preview below is taken directly from the full report and reflects the same structured, editable content included in your download. Buy now to unlock the complete, detailed version immediately after checkout.

Your Strategic Toolkit Starts Here
Explore Shimmick’s competitive edge and hidden risks with this concise SWOT snapshot—covering project backlog, regional exposure, and operational strengths. Want the full picture? Purchase the complete SWOT analysis for a research-backed, editable Word report and Excel matrix to inform strategy, pitches, and investment decisions.
Strengths
Complex infrastructure expertise
Proven capability in bridges, water, and transportation raises Shimmick’s win probability on technical bids, leveraging demand from the Bipartisan Infrastructure Law which allocates about $110 billion for roads and bridges. Depth in complex means and risk management improves execution certainty and cuts schedule overruns. This reputation supports premium prequalification and reduces learning curves on similar future projects.
Design-build delivery proficiency
Shimmick leverages design-build delivery to compress schedules and reduce interface risks, aligning design and construction under one contract and improving on-time performance. Single-point accountability appeals to public owners seeking schedule and cost certainty, contributing to higher win rates in negotiated procurements. Early contractor involvement enables cost optimization and constructability trade-offs; design-build accounted for about 42% of U.S. public infrastructure project value per DBIA-era data.
Diverse public and private client base
Working across municipalities, state agencies and private owners smooths revenue cycles and reduces dependence on any single funding stream, improving resilience during budget swings. A broad portfolio enables cross-selling of project management and design-build capabilities, increasing share of wallet per client. It also widens the pipeline for large pursuits by tapping multiple procurement channels and funding sources.
Large-scale project management
Shimmick’s experience coordinating multi-stakeholder megaprojects materially reduces coordination risk, with disciplined PMO processes driving improved schedule adherence, safety performance, and quality control, supporting stronger on-time, on-budget delivery metrics and higher bonding/surety confidence.
- PMO maturity: higher on-time delivery (PMI 2023)
- Reduced coordination risk: multi-stakeholder expertise
- Improved safety/quality: consistent outcomes
- Enhanced surety: stronger bonding confidence
Water and wastewater specialization
Technical strength in water and wastewater places Shimmick in durable demand as regulatory-driven upgrades and lead service line replacement needs (EPA estimated ~45 billion USD) create steady backlog; process know-how boosts margins versus generic civil work and aligns the firm with climate resilience and adaptation programs.
- Durable demand: regulatory backlog
- EPA lead pipe cost ~45B USD
- Higher margins via process expertise
- Positioned for climate resilience projects
Design-build edge raises win odds for $110B roads & $45B water work
Proven bridge/water/transport capability raises win probability amid ~$110B roads/bridges funding and ~$45B EPA lead-pipe backlog, boosting margins on regulated work. Design-build expertise (≈42% public infra value) compresses schedules and lowers interface risk. Broad client mix and mature PMO (PMI 2023) improve revenue resilience and bonding confidence.
| Strength | Evidence | Metric | Source |
|---|---|---|---|
| Market demand | Roads/bridges funding | $110B | BIL 2021 |
| Regulated water | Lead service backlog | $45B | EPA est. |
| Delivery model | Design-build share | ≈42% | DBIA data |
What is included in the product
Detailed Word Document
Provides a concise SWOT analysis of Shimmick, highlighting internal strengths and weaknesses and external opportunities and threats to assess competitive positioning and strategic risks.
Customizable Excel Spreadsheet
Provides a concise, editable SWOT matrix tailored to Shimmick for fast strategy alignment and quick stakeholder-ready summaries, streamlining communication of strengths, weaknesses, opportunities and threats. Ideal for executives and teams needing a clean, at-a-glance view that’s easy to update and integrate into reports or presentations.
Weaknesses
Exposure to low-margin contracts
Shimmick's exposure to low-margin heavy civil contracts is acute: ENR 2024 reports typical heavy civil net margins of roughly 2–5%, so aggressive bidding quickly compresses profits. Fixed-price terms transfer overrun risk to contractors, where even 1–2% productivity slippage can wipe out margins. Industry data show claims recovery often takes 12–24 months, creating cash-flow and certainty challenges.
High working capital and bonding needs
Large projects force Shimmick to post performance bonds and letters of credit—performance bonds are typically 5–10% of contract value—tying up substantial cash and limiting bid capacity on simultaneous tenders. Tighter credit since 2022 increased surety and financing scrutiny, raising effective funding costs and reducing leverage for growth. This elevates sensitivity to cash‑flow timing, especially on projects with 6–12 month receivable cycles.
Schedule and change-order risk
Permitting, utilities and third-party delays can cascade into liquidated damages and claims; large construction projects typically take about 20% longer than scheduled and can be up to 80% over budget (McKinsey), amplifying penalty exposure.
Complex, multi-disciplinary scopes increase design changes and disputes, driving variation orders and rework.
Protracted negotiations over change orders tie up cash and management bandwidth, while heavy documentation and claims processing strain project teams and reduce effective margin.
Subcontractor and supplier dependence
Subcontractor and supplier dependence constrains Shimmick’s execution when specialty trades or heavy equipment are scarce, increasing schedule risk and unit costs. Global and regional supply shocks have repeatedly pushed lead times and margins upward, while limited local vendor pools create concentration risk. This dependency also complicates ensuring consistent quality across regions.
- Specialty-trade shortages
- Equipment availability bottlenecks
- Concentration risk from small local vendor pools
- Regional quality-control challenges
Geographic concentration exposure
Operating primarily in concentrated regions raises Shimmick's exposure to localized economic shocks; US construction put-in-place was about $1.9 trillion in 2024, so regional slowdowns can materially hit backlog and revenue. A local market slowdown can compress backlog and cash flow quickly, while entering new markets incurs ramp-up and learning costs that can dilute margins during expansion.
- Concentration risk: regional revenue exposure
- Backlog sensitivity: local slowdowns compress projects
- Expansion cost: ramp-up and learning expenses
- Margin pressure: dilution during geographic growth
Margins at 2-5% as bonds and 20% delays squeeze cash
Shimmick faces low heavy‑civil net margins (2–5% ENR 2024), where 1–2% productivity slippage erodes profitability and claims recovery often takes 12–24 months. Performance bonds (5–10% of contract value) and tighter surety since 2022 constrain cash and bid capacity, while projects run ~20% longer than planned (McKinsey), raising liquidated damages risk. Regional concentration vs US $1.9T put‑in‑place (2024) heightens local demand exposure.
| Metric | Value |
|---|---|
| Net margins | 2–5% |
| Productivity sensitivity | 1–2% margin impact |
| Bond requirement | 5–10% contract |
| Claims lag | 12–24 months |
| Project delay | ~20% longer |
| US construction | $1.9T (2024) |
Preview the Actual Deliverable
Shimmick SWOT Analysis
This is the actual Shimmick SWOT analysis document you’ll receive upon purchase—no surprises, just professional quality. The preview below is taken directly from the full report and reflects the same structured, editable content included in your download. Buy now to unlock the complete, detailed version immediately after checkout.
Original: $10.00
-65%$10.00
$3.50Description
Your Strategic Toolkit Starts Here
Explore Shimmick’s competitive edge and hidden risks with this concise SWOT snapshot—covering project backlog, regional exposure, and operational strengths. Want the full picture? Purchase the complete SWOT analysis for a research-backed, editable Word report and Excel matrix to inform strategy, pitches, and investment decisions.
Strengths
Complex infrastructure expertise
Proven capability in bridges, water, and transportation raises Shimmick’s win probability on technical bids, leveraging demand from the Bipartisan Infrastructure Law which allocates about $110 billion for roads and bridges. Depth in complex means and risk management improves execution certainty and cuts schedule overruns. This reputation supports premium prequalification and reduces learning curves on similar future projects.
Design-build delivery proficiency
Shimmick leverages design-build delivery to compress schedules and reduce interface risks, aligning design and construction under one contract and improving on-time performance. Single-point accountability appeals to public owners seeking schedule and cost certainty, contributing to higher win rates in negotiated procurements. Early contractor involvement enables cost optimization and constructability trade-offs; design-build accounted for about 42% of U.S. public infrastructure project value per DBIA-era data.
Diverse public and private client base
Working across municipalities, state agencies and private owners smooths revenue cycles and reduces dependence on any single funding stream, improving resilience during budget swings. A broad portfolio enables cross-selling of project management and design-build capabilities, increasing share of wallet per client. It also widens the pipeline for large pursuits by tapping multiple procurement channels and funding sources.
Large-scale project management
Shimmick’s experience coordinating multi-stakeholder megaprojects materially reduces coordination risk, with disciplined PMO processes driving improved schedule adherence, safety performance, and quality control, supporting stronger on-time, on-budget delivery metrics and higher bonding/surety confidence.
- PMO maturity: higher on-time delivery (PMI 2023)
- Reduced coordination risk: multi-stakeholder expertise
- Improved safety/quality: consistent outcomes
- Enhanced surety: stronger bonding confidence
Water and wastewater specialization
Technical strength in water and wastewater places Shimmick in durable demand as regulatory-driven upgrades and lead service line replacement needs (EPA estimated ~45 billion USD) create steady backlog; process know-how boosts margins versus generic civil work and aligns the firm with climate resilience and adaptation programs.
- Durable demand: regulatory backlog
- EPA lead pipe cost ~45B USD
- Higher margins via process expertise
- Positioned for climate resilience projects
Design-build edge raises win odds for $110B roads & $45B water work
Proven bridge/water/transport capability raises win probability amid ~$110B roads/bridges funding and ~$45B EPA lead-pipe backlog, boosting margins on regulated work. Design-build expertise (≈42% public infra value) compresses schedules and lowers interface risk. Broad client mix and mature PMO (PMI 2023) improve revenue resilience and bonding confidence.
| Strength | Evidence | Metric | Source |
|---|---|---|---|
| Market demand | Roads/bridges funding | $110B | BIL 2021 |
| Regulated water | Lead service backlog | $45B | EPA est. |
| Delivery model | Design-build share | ≈42% | DBIA data |
What is included in the product
Detailed Word Document
Provides a concise SWOT analysis of Shimmick, highlighting internal strengths and weaknesses and external opportunities and threats to assess competitive positioning and strategic risks.
Customizable Excel Spreadsheet
Provides a concise, editable SWOT matrix tailored to Shimmick for fast strategy alignment and quick stakeholder-ready summaries, streamlining communication of strengths, weaknesses, opportunities and threats. Ideal for executives and teams needing a clean, at-a-glance view that’s easy to update and integrate into reports or presentations.
Weaknesses
Exposure to low-margin contracts
Shimmick's exposure to low-margin heavy civil contracts is acute: ENR 2024 reports typical heavy civil net margins of roughly 2–5%, so aggressive bidding quickly compresses profits. Fixed-price terms transfer overrun risk to contractors, where even 1–2% productivity slippage can wipe out margins. Industry data show claims recovery often takes 12–24 months, creating cash-flow and certainty challenges.
High working capital and bonding needs
Large projects force Shimmick to post performance bonds and letters of credit—performance bonds are typically 5–10% of contract value—tying up substantial cash and limiting bid capacity on simultaneous tenders. Tighter credit since 2022 increased surety and financing scrutiny, raising effective funding costs and reducing leverage for growth. This elevates sensitivity to cash‑flow timing, especially on projects with 6–12 month receivable cycles.
Schedule and change-order risk
Permitting, utilities and third-party delays can cascade into liquidated damages and claims; large construction projects typically take about 20% longer than scheduled and can be up to 80% over budget (McKinsey), amplifying penalty exposure.
Complex, multi-disciplinary scopes increase design changes and disputes, driving variation orders and rework.
Protracted negotiations over change orders tie up cash and management bandwidth, while heavy documentation and claims processing strain project teams and reduce effective margin.
Subcontractor and supplier dependence
Subcontractor and supplier dependence constrains Shimmick’s execution when specialty trades or heavy equipment are scarce, increasing schedule risk and unit costs. Global and regional supply shocks have repeatedly pushed lead times and margins upward, while limited local vendor pools create concentration risk. This dependency also complicates ensuring consistent quality across regions.
- Specialty-trade shortages
- Equipment availability bottlenecks
- Concentration risk from small local vendor pools
- Regional quality-control challenges
Geographic concentration exposure
Operating primarily in concentrated regions raises Shimmick's exposure to localized economic shocks; US construction put-in-place was about $1.9 trillion in 2024, so regional slowdowns can materially hit backlog and revenue. A local market slowdown can compress backlog and cash flow quickly, while entering new markets incurs ramp-up and learning costs that can dilute margins during expansion.
- Concentration risk: regional revenue exposure
- Backlog sensitivity: local slowdowns compress projects
- Expansion cost: ramp-up and learning expenses
- Margin pressure: dilution during geographic growth
Margins at 2-5% as bonds and 20% delays squeeze cash
Shimmick faces low heavy‑civil net margins (2–5% ENR 2024), where 1–2% productivity slippage erodes profitability and claims recovery often takes 12–24 months. Performance bonds (5–10% of contract value) and tighter surety since 2022 constrain cash and bid capacity, while projects run ~20% longer than planned (McKinsey), raising liquidated damages risk. Regional concentration vs US $1.9T put‑in‑place (2024) heightens local demand exposure.
| Metric | Value |
|---|---|
| Net margins | 2–5% |
| Productivity sensitivity | 1–2% margin impact |
| Bond requirement | 5–10% contract |
| Claims lag | 12–24 months |
| Project delay | ~20% longer |
| US construction | $1.9T (2024) |
Preview the Actual Deliverable
Shimmick SWOT Analysis
This is the actual Shimmick SWOT analysis document you’ll receive upon purchase—no surprises, just professional quality. The preview below is taken directly from the full report and reflects the same structured, editable content included in your download. Buy now to unlock the complete, detailed version immediately after checkout.











