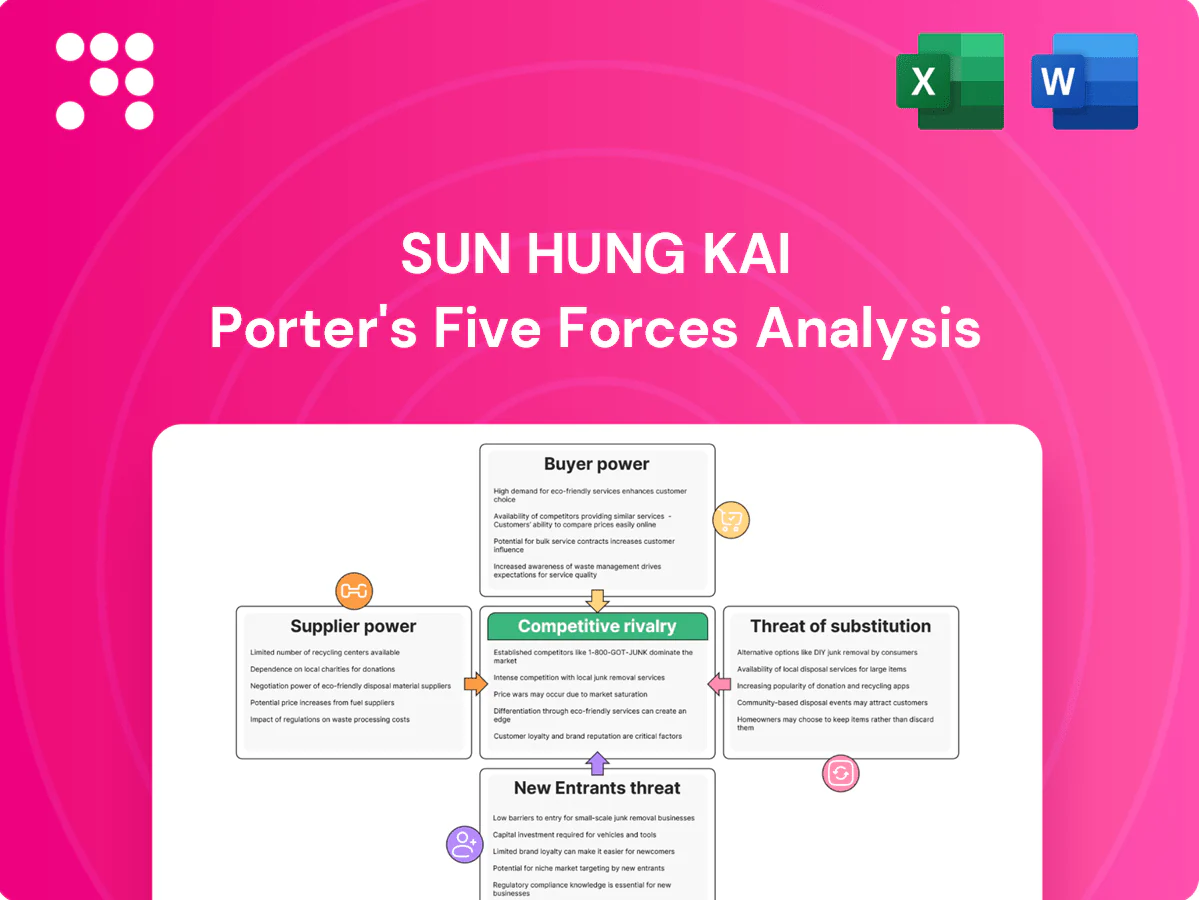
Sun Hung Kai Porter's Five Forces Analysis

From Overview to Strategy Blueprint
Sun Hung Kai’s Porter's Five Forces snapshot highlights key competitive dynamics—buyer and supplier power, threat of entrants and substitutes, and industry rivalry—impacting profitability. Our brief flags strategic strengths and vulnerabilities, but only scratches the surface. Unlock the full Porter's Five Forces Analysis to access force-by-force ratings, data visuals and actionable insights. Purchase the complete report to inform smarter investment and strategy decisions.
Suppliers Bargaining Power

Concentrated capital sources
As an alternative investor, key suppliers are funding counterparties—lenders, co-investors and prime brokers—whose pricing power rises and terms harden when liquidity tightens. That dynamic can compress spreads and reduce deal-structuring flexibility; the US federal funds rate stood at 5.25–5.50% in Dec 2024, reflecting tighter liquidity. Diversified funding lines and long-term counterparty relationships mitigate this risk.
Scarce specialist talent
Experienced dealmakers, sector analysts and risk professionals are scarce and highly mobile in Hong Kong and Greater China, where unemployment hovered around 2.8% in 2024, keeping compensation premiums elevated. Competition for top talent pushes pay and bonuses well above regional averages, and loss of key teams can sharply disrupt deal pipeline and performance. Strengthening employer brand and aligning carry with long-term incentives materially reduces this supplier power.

Proprietary deal flow and advisors
Investment banks, boutiques and introducers control access to premium deal flow, and in 2024 placement and advisory fees of 1–3% were common in hot sectors such as healthcare and tech, with boutique advisors often securing preferential allocations. Overreliance on these intermediaries drives fee leakage and raises adverse selection risk when top deals are rationed. Cultivating proprietary sourcing and strategic partnerships lowers dependence and preserves returns.

Data, tech, and market infrastructure
- Concentration: top vendors dominate market data
- Switching cost: high integration effort and fees
- Operational risk: outages/license limits impair trading
- Defensive moves: multi-vendor + in-house tooling
Regulatory and listing venues
Exchanges, clearing houses and regulators impose non-negotiable supply conditions that define access and cost; in 2024 regulators in Hong Kong and major jurisdictions raised disclosure and licensing scrutiny, tightening entry and ongoing requirements. Sudden changes in margin or reporting rules can shift economics quickly, while cross-border compliance adds measurable cost and settlement friction. Diversifying listing venues and maintaining strong compliance capabilities materially reduces supplier power and operational risk.
- Regulatory rules = non-negotiable supply
- 2024: heightened disclosure/licensing scrutiny
- Margin/disclosure changes abruptly alter economics
- Diversify geographies + robust compliance = lower exposure
Supplier power high; funds cost 5.25–5.50% — diversify funding, build tools
Supplier power is elevated: funding tightened with fed funds 5.25–5.50% (Dec 2024), placement fees 1–3% in hot sectors (2024), and HK unemployment ~2.8% (2024) keeps talent premiums high. Market-data concentration (Bloomberg ~325,000 terminals) and 2024 regulatory tightening raise switching and compliance costs; diversify funding, build proprietary sourcing and in-house tooling to reduce exposure.
| Supplier | 2024 metric | Impact |
|---|---|---|
| Funding | 5.25–5.50% fed funds | Higher pricing |
| Advisors | 1–3% fees | Fee leakage |
| Talent | 2.8% HK unemployment | Comp premium |
| Data vendors | Bloomberg ~325k | Switching cost |
| Regulators | Heightened 2024 scrutiny | Compliance cost |
What is included in the product
 Detailed Word Document
Tailored Five Forces analysis for Sun Hung Kai that uncovers key competitive drivers, buyer and supplier power, threats from substitutes and new entrants, and strategic implications for pricing, profitability, and market positioning.

 Customizable Excel Spreadsheet
A clear, one-sheet Five Forces snapshot for Sun Hung Kai Porter—perfect for quick strategic decisions and investor presentations; swap in your own data and instantly visualize competitive pressure with a clean spider chart for boardroom-ready slides.
Customers Bargaining Power

Institutional allocators negotiate hard
Large institutional allocators and family offices — e.g., BlackRock (~$10T AUM) and Norges (~$1.4T) — extract fee breaks, co‑investment rights and detailed transparency, and their ability to reallocate capital raises switching threat. This dynamic compresses management and performance fees across private markets. Managers with truly differentiated strategy access or long, verifiable track records retain pricing power and reduce allocator leverage.
Wealth clients are price sensitive
Wealth clients are highly price sensitive: retail and HNWI compare platforms on pricing and digital UX, with discount brokers offering sub-0.20% advisory fees and average ETF expense ratios near 0.07% in 2024, anchoring fee expectations. Churn rises in calm markets as returns converge, while bundled advice and exclusive product deals materially improve retention.

Corporate finance clients shop mandates
Corporate finance clients commonly solicit multiple pitches and run fee auctions, driving underwriting fee compression of roughly 20–30% on competitive mandates in 2024; league table pressure forces concessions on pricing and covenants as top banks vie for volume. Strong distribution and cross-sell capabilities allow firms to command 10–20% premium pricing on strategic deals. Sector expertise and execution certainty still win mandates despite elevated buyer power.

Performance transparency elevates expectations
Digital service expectations
Clients Demand Sub-0.20% Fees, Co-Invest Rights and 92% Smartphone Switching
Customers exert high bargaining power: institutional allocators (e.g., BlackRock ~$10T, Norges ~$1.4T) push fee discounts and co-invest rights, wealth clients anchor fees to sub-0.20% advisors and 0.07% ETF ERs (2024), corporates drive underwriting fee compression ~20–30% on competitive mandates; performance transparency and 92% HK smartphone penetration (2024) accelerate switching.
| Metric | 2024 |
|---|---|
| BlackRock AUM | $10T |
| ETF avg ER | 0.07% |
| HK smartphone | 92% |
What You See Is What You Get
Sun Hung Kai Porter's Five Forces Analysis
This preview shows the exact Sun Hung Kai Porter Five Forces Analysis you will receive—no mockups or placeholders. The file is fully formatted, professionally written, and ready for immediate download upon purchase. What you see here is the complete deliverable, usable for analysis, reporting, or presentation with no further setup required.

From Overview to Strategy Blueprint
Sun Hung Kai’s Porter's Five Forces snapshot highlights key competitive dynamics—buyer and supplier power, threat of entrants and substitutes, and industry rivalry—impacting profitability. Our brief flags strategic strengths and vulnerabilities, but only scratches the surface. Unlock the full Porter's Five Forces Analysis to access force-by-force ratings, data visuals and actionable insights. Purchase the complete report to inform smarter investment and strategy decisions.
Suppliers Bargaining Power
Concentrated capital sources
As an alternative investor, key suppliers are funding counterparties—lenders, co-investors and prime brokers—whose pricing power rises and terms harden when liquidity tightens. That dynamic can compress spreads and reduce deal-structuring flexibility; the US federal funds rate stood at 5.25–5.50% in Dec 2024, reflecting tighter liquidity. Diversified funding lines and long-term counterparty relationships mitigate this risk.
Scarce specialist talent
Experienced dealmakers, sector analysts and risk professionals are scarce and highly mobile in Hong Kong and Greater China, where unemployment hovered around 2.8% in 2024, keeping compensation premiums elevated. Competition for top talent pushes pay and bonuses well above regional averages, and loss of key teams can sharply disrupt deal pipeline and performance. Strengthening employer brand and aligning carry with long-term incentives materially reduces this supplier power.
Proprietary deal flow and advisors
Investment banks, boutiques and introducers control access to premium deal flow, and in 2024 placement and advisory fees of 1–3% were common in hot sectors such as healthcare and tech, with boutique advisors often securing preferential allocations. Overreliance on these intermediaries drives fee leakage and raises adverse selection risk when top deals are rationed. Cultivating proprietary sourcing and strategic partnerships lowers dependence and preserves returns.
Data, tech, and market infrastructure
- Concentration: top vendors dominate market data
- Switching cost: high integration effort and fees
- Operational risk: outages/license limits impair trading
- Defensive moves: multi-vendor + in-house tooling
Regulatory and listing venues
Exchanges, clearing houses and regulators impose non-negotiable supply conditions that define access and cost; in 2024 regulators in Hong Kong and major jurisdictions raised disclosure and licensing scrutiny, tightening entry and ongoing requirements. Sudden changes in margin or reporting rules can shift economics quickly, while cross-border compliance adds measurable cost and settlement friction. Diversifying listing venues and maintaining strong compliance capabilities materially reduces supplier power and operational risk.
- Regulatory rules = non-negotiable supply
- 2024: heightened disclosure/licensing scrutiny
- Margin/disclosure changes abruptly alter economics
- Diversify geographies + robust compliance = lower exposure
Supplier power high; funds cost 5.25–5.50% — diversify funding, build tools
Supplier power is elevated: funding tightened with fed funds 5.25–5.50% (Dec 2024), placement fees 1–3% in hot sectors (2024), and HK unemployment ~2.8% (2024) keeps talent premiums high. Market-data concentration (Bloomberg ~325,000 terminals) and 2024 regulatory tightening raise switching and compliance costs; diversify funding, build proprietary sourcing and in-house tooling to reduce exposure.
| Supplier | 2024 metric | Impact |
|---|---|---|
| Funding | 5.25–5.50% fed funds | Higher pricing |
| Advisors | 1–3% fees | Fee leakage |
| Talent | 2.8% HK unemployment | Comp premium |
| Data vendors | Bloomberg ~325k | Switching cost |
| Regulators | Heightened 2024 scrutiny | Compliance cost |
What is included in the product
Detailed Word Document
Tailored Five Forces analysis for Sun Hung Kai that uncovers key competitive drivers, buyer and supplier power, threats from substitutes and new entrants, and strategic implications for pricing, profitability, and market positioning.
Customizable Excel Spreadsheet
A clear, one-sheet Five Forces snapshot for Sun Hung Kai Porter—perfect for quick strategic decisions and investor presentations; swap in your own data and instantly visualize competitive pressure with a clean spider chart for boardroom-ready slides.
Customers Bargaining Power
Institutional allocators negotiate hard
Large institutional allocators and family offices — e.g., BlackRock (~$10T AUM) and Norges (~$1.4T) — extract fee breaks, co‑investment rights and detailed transparency, and their ability to reallocate capital raises switching threat. This dynamic compresses management and performance fees across private markets. Managers with truly differentiated strategy access or long, verifiable track records retain pricing power and reduce allocator leverage.
Wealth clients are price sensitive
Wealth clients are highly price sensitive: retail and HNWI compare platforms on pricing and digital UX, with discount brokers offering sub-0.20% advisory fees and average ETF expense ratios near 0.07% in 2024, anchoring fee expectations. Churn rises in calm markets as returns converge, while bundled advice and exclusive product deals materially improve retention.
Corporate finance clients shop mandates
Corporate finance clients commonly solicit multiple pitches and run fee auctions, driving underwriting fee compression of roughly 20–30% on competitive mandates in 2024; league table pressure forces concessions on pricing and covenants as top banks vie for volume. Strong distribution and cross-sell capabilities allow firms to command 10–20% premium pricing on strategic deals. Sector expertise and execution certainty still win mandates despite elevated buyer power.
Performance transparency elevates expectations
Digital service expectations
Clients Demand Sub-0.20% Fees, Co-Invest Rights and 92% Smartphone Switching
Customers exert high bargaining power: institutional allocators (e.g., BlackRock ~$10T, Norges ~$1.4T) push fee discounts and co-invest rights, wealth clients anchor fees to sub-0.20% advisors and 0.07% ETF ERs (2024), corporates drive underwriting fee compression ~20–30% on competitive mandates; performance transparency and 92% HK smartphone penetration (2024) accelerate switching.
| Metric | 2024 |
|---|---|
| BlackRock AUM | $10T |
| ETF avg ER | 0.07% |
| HK smartphone | 92% |
What You See Is What You Get
Sun Hung Kai Porter's Five Forces Analysis
This preview shows the exact Sun Hung Kai Porter Five Forces Analysis you will receive—no mockups or placeholders. The file is fully formatted, professionally written, and ready for immediate download upon purchase. What you see here is the complete deliverable, usable for analysis, reporting, or presentation with no further setup required.
Original: $10.00
-65%$10.00
$3.50Description
From Overview to Strategy Blueprint
Sun Hung Kai’s Porter's Five Forces snapshot highlights key competitive dynamics—buyer and supplier power, threat of entrants and substitutes, and industry rivalry—impacting profitability. Our brief flags strategic strengths and vulnerabilities, but only scratches the surface. Unlock the full Porter's Five Forces Analysis to access force-by-force ratings, data visuals and actionable insights. Purchase the complete report to inform smarter investment and strategy decisions.
Suppliers Bargaining Power
Concentrated capital sources
As an alternative investor, key suppliers are funding counterparties—lenders, co-investors and prime brokers—whose pricing power rises and terms harden when liquidity tightens. That dynamic can compress spreads and reduce deal-structuring flexibility; the US federal funds rate stood at 5.25–5.50% in Dec 2024, reflecting tighter liquidity. Diversified funding lines and long-term counterparty relationships mitigate this risk.
Scarce specialist talent
Experienced dealmakers, sector analysts and risk professionals are scarce and highly mobile in Hong Kong and Greater China, where unemployment hovered around 2.8% in 2024, keeping compensation premiums elevated. Competition for top talent pushes pay and bonuses well above regional averages, and loss of key teams can sharply disrupt deal pipeline and performance. Strengthening employer brand and aligning carry with long-term incentives materially reduces this supplier power.
Proprietary deal flow and advisors
Investment banks, boutiques and introducers control access to premium deal flow, and in 2024 placement and advisory fees of 1–3% were common in hot sectors such as healthcare and tech, with boutique advisors often securing preferential allocations. Overreliance on these intermediaries drives fee leakage and raises adverse selection risk when top deals are rationed. Cultivating proprietary sourcing and strategic partnerships lowers dependence and preserves returns.
Data, tech, and market infrastructure
- Concentration: top vendors dominate market data
- Switching cost: high integration effort and fees
- Operational risk: outages/license limits impair trading
- Defensive moves: multi-vendor + in-house tooling
Regulatory and listing venues
Exchanges, clearing houses and regulators impose non-negotiable supply conditions that define access and cost; in 2024 regulators in Hong Kong and major jurisdictions raised disclosure and licensing scrutiny, tightening entry and ongoing requirements. Sudden changes in margin or reporting rules can shift economics quickly, while cross-border compliance adds measurable cost and settlement friction. Diversifying listing venues and maintaining strong compliance capabilities materially reduces supplier power and operational risk.
- Regulatory rules = non-negotiable supply
- 2024: heightened disclosure/licensing scrutiny
- Margin/disclosure changes abruptly alter economics
- Diversify geographies + robust compliance = lower exposure
Supplier power high; funds cost 5.25–5.50% — diversify funding, build tools
Supplier power is elevated: funding tightened with fed funds 5.25–5.50% (Dec 2024), placement fees 1–3% in hot sectors (2024), and HK unemployment ~2.8% (2024) keeps talent premiums high. Market-data concentration (Bloomberg ~325,000 terminals) and 2024 regulatory tightening raise switching and compliance costs; diversify funding, build proprietary sourcing and in-house tooling to reduce exposure.
| Supplier | 2024 metric | Impact |
|---|---|---|
| Funding | 5.25–5.50% fed funds | Higher pricing |
| Advisors | 1–3% fees | Fee leakage |
| Talent | 2.8% HK unemployment | Comp premium |
| Data vendors | Bloomberg ~325k | Switching cost |
| Regulators | Heightened 2024 scrutiny | Compliance cost |
What is included in the product
Detailed Word Document
Tailored Five Forces analysis for Sun Hung Kai that uncovers key competitive drivers, buyer and supplier power, threats from substitutes and new entrants, and strategic implications for pricing, profitability, and market positioning.
Customizable Excel Spreadsheet
A clear, one-sheet Five Forces snapshot for Sun Hung Kai Porter—perfect for quick strategic decisions and investor presentations; swap in your own data and instantly visualize competitive pressure with a clean spider chart for boardroom-ready slides.
Customers Bargaining Power
Institutional allocators negotiate hard
Large institutional allocators and family offices — e.g., BlackRock (~$10T AUM) and Norges (~$1.4T) — extract fee breaks, co‑investment rights and detailed transparency, and their ability to reallocate capital raises switching threat. This dynamic compresses management and performance fees across private markets. Managers with truly differentiated strategy access or long, verifiable track records retain pricing power and reduce allocator leverage.
Wealth clients are price sensitive
Wealth clients are highly price sensitive: retail and HNWI compare platforms on pricing and digital UX, with discount brokers offering sub-0.20% advisory fees and average ETF expense ratios near 0.07% in 2024, anchoring fee expectations. Churn rises in calm markets as returns converge, while bundled advice and exclusive product deals materially improve retention.
Corporate finance clients shop mandates
Corporate finance clients commonly solicit multiple pitches and run fee auctions, driving underwriting fee compression of roughly 20–30% on competitive mandates in 2024; league table pressure forces concessions on pricing and covenants as top banks vie for volume. Strong distribution and cross-sell capabilities allow firms to command 10–20% premium pricing on strategic deals. Sector expertise and execution certainty still win mandates despite elevated buyer power.
Performance transparency elevates expectations
Digital service expectations
Clients Demand Sub-0.20% Fees, Co-Invest Rights and 92% Smartphone Switching
Customers exert high bargaining power: institutional allocators (e.g., BlackRock ~$10T, Norges ~$1.4T) push fee discounts and co-invest rights, wealth clients anchor fees to sub-0.20% advisors and 0.07% ETF ERs (2024), corporates drive underwriting fee compression ~20–30% on competitive mandates; performance transparency and 92% HK smartphone penetration (2024) accelerate switching.
| Metric | 2024 |
|---|---|
| BlackRock AUM | $10T |
| ETF avg ER | 0.07% |
| HK smartphone | 92% |
What You See Is What You Get
Sun Hung Kai Porter's Five Forces Analysis
This preview shows the exact Sun Hung Kai Porter Five Forces Analysis you will receive—no mockups or placeholders. The file is fully formatted, professionally written, and ready for immediate download upon purchase. What you see here is the complete deliverable, usable for analysis, reporting, or presentation with no further setup required.











