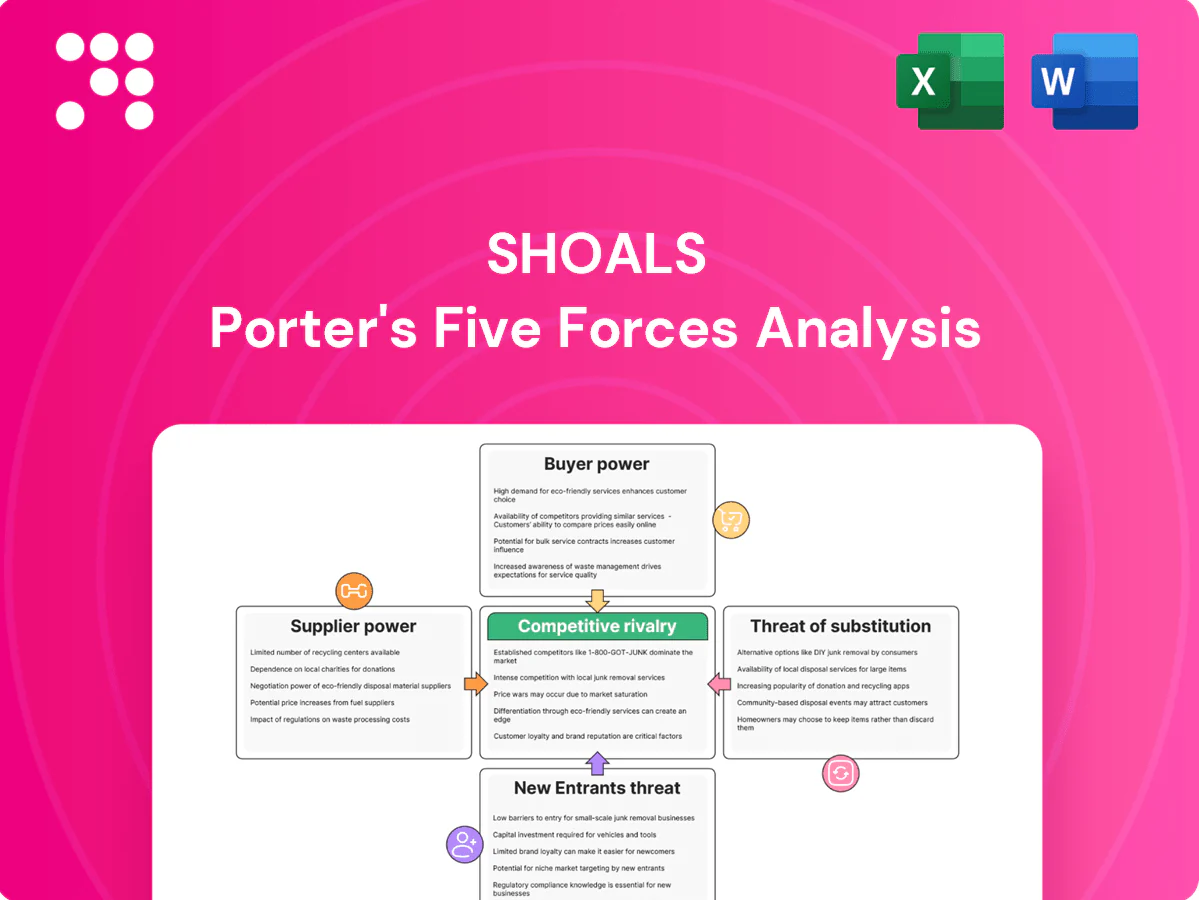
Shoals Porter's Five Forces Analysis

Go Beyond the Preview—Access the Full Strategic Report
Shoals’s Porter's Five Forces snapshot highlights supplier concentration, buyer leverage, and competitive rivalry shaping its margins and growth prospects. It identifies key external threats and strategic levers but only scratches the surface. Unlock the full Porter's Five Forces Analysis to explore force-by-force ratings, visuals, and actionable insights tailored to Shoals.
Suppliers Bargaining Power

Specialized components
Shoals depends on precision connectors, cables, breakers and inverter parts with few qualified sources, so supplier specialization raises switching costs and extended lead times (industry lead times spiked to ~20–25 weeks in 2021–22). During demand spikes suppliers can impose tighter terms and price pressure. Dual-sourcing and design-for-substitution have lowered disruption frequency but do not eliminate dependency.
Raw materials volatility
Copper, aluminum, resins and semiconductors exhibit pronounced price swings and allocation constraints, enabling suppliers to exert pricing pressure in tight markets. Suppliers commonly pass cost increases through quickly; Shoals’ long-term contracts and hedging mitigate but do not fully eliminate exposure. Inventory buffers and VAVE initiatives incrementally lower material intensity and blunt recurring volatility.

Quality and certification
UL, IEC and utility interconnection standards require certified inputs, and as of 2024 certification and requalification processes typically take several months, raising cost and lead time. Fewer suppliers meet utility-scale bankability and reliability thresholds, concentrating leverage among a small, bankable cohort. Requalification is costly and slow, boosting supplier bargaining power. Long-term partnerships trade volume visibility for stable, certified quality.

Logistics and lead times
- Transit risk: long global routes increase supplier leverage
- Lead times: 12–24 weeks for electronics (2024)
- Nearshoring: +10–25% unit cost
- Mitigation: VMI and better forecasts reduce inventory/stockouts
Technology tie-ins
Power electronics and monitoring components evolve rapidly, with upgrade cycles typically under 24 months, so suppliers who offer proprietary firmware or custom specs increase customer lock-in and bargaining power. Open architectures and modular EBOS designs erode that power by enabling easier supplier substitution. Shoals’ standardization strategy limits bespoke dependencies and lowers switching costs.
Elevated supplier power from 12–24 week electronics lead times and certification lock-in
Shoals faces elevated supplier power from few qualified vendors, long electronics lead times (12–24 weeks in 2024) and material price volatility, raising switching costs and short-term price pass-through. Long certification/requalification cycles (several months) and proprietary firmware increase lock-in, while modular designs, dual-sourcing and VMI reduce but do not remove leverage.
| Metric | 2024 | Impact |
|---|---|---|
| Electronics lead time | 12–24 weeks | Higher pricing power |
| Nearshoring cost delta | +10–25% | Lower transit risk, higher unit cost |
| Upgrade cycle | <24 months | Proprietary lock-in risk |
What is included in the product
 Detailed Word Document
Tailored Porter's Five Forces analysis for Shoals that uncovers competitive rivalry, supplier and buyer power, entry barriers, substitutes and disruptive threats, with strategic commentary to inform pricing, positioning and growth decisions.

 Customizable Excel Spreadsheet
Shoals Porter's Five Forces Analysis delivers a one-sheet, customizable radar view to instantly reveal competitive pressures and relieve strategic uncertainty—easy to edit, copy into decks, and integrate with existing reports.
Customers Bargaining Power

Utility-scale concentration
Large EPCs, developers and IPPs dominate utility-scale orders and run competitive tenders, with 2024 tender sizes commonly exceeding 50 MW and framework agreements often above $50m, concentrating buyer power.
High deal sizes and repeat frameworks enhance leverage, while acute price sensitivity from PPA-driven returns pressures margins.
Demonstrated LCOE benefits, however, can justify premium pricing of roughly 5–15% in bids where lifecycle savings are proven.
Performance guarantees
Buyers demand 25-year warranties, strict delivery SLAs (commonly 30–90 days) and bankability evidence, shifting performance and financial risk to suppliers and compressing margins. Proven field reliability lowers claims and bargaining asymmetry; industry data show monitoring-driven issue detection can cut O&M claims ~20–30%. Shoals’ real-time monitoring and field performance logs therefore strengthen its negotiating position with lenders and large EPCs.

Standardization and spec power
Procurement teams favor standardized, interoperable EBOS because generic specs let buyers switch vendors easily; a 2024 industry survey found 68% of EPCs prioritize plug-and-play interoperability. Shoals embeds value with pre-terminated systems and plug-and-play designs that can cut installation labor 30–50%, and these integration savings materially reduce buyer appetite to switch.

Total cost focus
- Installed-cost focus: BOS ~40–60% (NREL 2023–24)
- EBOS install-time cut: industry reports 20–40% (2024)
- Lifecycle TCO savings: 10–25% via calculators
- Documented BOS savings lower price-only buyer power
Multi-year pipelines
Developers with gigawatt-scale pipelines (1+ GW) pressure suppliers for volume discounts; multi-year visibility often trades for lower prices and priority allocation in procurement cycles. Shoals can bundle solar, storage and EV solutions to capture share and shift negotiations from price-per-product to portfolio value, reducing buyer leverage across individual product lines.
- Developers: 1+ GW pipelines
- Leverage: volume discounts, priority allocation
- Shoals strategy: bundling solar+storage+EV
- Effect: lower buyer power per product
EPCs demand interoperable EBOS: cut installs 20-40%, save 10-25% lifecycle
Large EPCs/IPPs run 50+ MW tenders and $50m+ frameworks in 2024, concentrating buyer power. BOS is 40–60% of installed cost (NREL 2023–24) so buyers prioritize TCO; EBOS can cut install time 20–40% and deliver 10–25% lifecycle savings. 68% of EPCs prioritize interoperability (2024 survey); 25-year warranties and strict SLAs shift risk to suppliers.
| Metric | Value |
|---|---|
| Tender size | 50+ MW (2024) |
| Frameworks | $50m+ |
| BOS share | 40–60% (NREL 2023–24) |
| Install time cut | 20–40% (2024) |
| Lifecycle savings | 10–25% |
| Interoperability | 68% (2024) |
Full Version Awaits
Shoals Porter's Five Forces Analysis
This preview shows the exact Shoals Porter’s Five Forces analysis you'll receive immediately after purchase—no placeholders or samples. The document is fully formatted, professionally written, and ready to download. You’ll get instant access to this identical file upon payment.

Go Beyond the Preview—Access the Full Strategic Report
Shoals’s Porter's Five Forces snapshot highlights supplier concentration, buyer leverage, and competitive rivalry shaping its margins and growth prospects. It identifies key external threats and strategic levers but only scratches the surface. Unlock the full Porter's Five Forces Analysis to explore force-by-force ratings, visuals, and actionable insights tailored to Shoals.
Suppliers Bargaining Power
Specialized components
Shoals depends on precision connectors, cables, breakers and inverter parts with few qualified sources, so supplier specialization raises switching costs and extended lead times (industry lead times spiked to ~20–25 weeks in 2021–22). During demand spikes suppliers can impose tighter terms and price pressure. Dual-sourcing and design-for-substitution have lowered disruption frequency but do not eliminate dependency.
Raw materials volatility
Copper, aluminum, resins and semiconductors exhibit pronounced price swings and allocation constraints, enabling suppliers to exert pricing pressure in tight markets. Suppliers commonly pass cost increases through quickly; Shoals’ long-term contracts and hedging mitigate but do not fully eliminate exposure. Inventory buffers and VAVE initiatives incrementally lower material intensity and blunt recurring volatility.
Quality and certification
UL, IEC and utility interconnection standards require certified inputs, and as of 2024 certification and requalification processes typically take several months, raising cost and lead time. Fewer suppliers meet utility-scale bankability and reliability thresholds, concentrating leverage among a small, bankable cohort. Requalification is costly and slow, boosting supplier bargaining power. Long-term partnerships trade volume visibility for stable, certified quality.
Logistics and lead times
- Transit risk: long global routes increase supplier leverage
- Lead times: 12–24 weeks for electronics (2024)
- Nearshoring: +10–25% unit cost
- Mitigation: VMI and better forecasts reduce inventory/stockouts
Technology tie-ins
Power electronics and monitoring components evolve rapidly, with upgrade cycles typically under 24 months, so suppliers who offer proprietary firmware or custom specs increase customer lock-in and bargaining power. Open architectures and modular EBOS designs erode that power by enabling easier supplier substitution. Shoals’ standardization strategy limits bespoke dependencies and lowers switching costs.
Elevated supplier power from 12–24 week electronics lead times and certification lock-in
Shoals faces elevated supplier power from few qualified vendors, long electronics lead times (12–24 weeks in 2024) and material price volatility, raising switching costs and short-term price pass-through. Long certification/requalification cycles (several months) and proprietary firmware increase lock-in, while modular designs, dual-sourcing and VMI reduce but do not remove leverage.
| Metric | 2024 | Impact |
|---|---|---|
| Electronics lead time | 12–24 weeks | Higher pricing power |
| Nearshoring cost delta | +10–25% | Lower transit risk, higher unit cost |
| Upgrade cycle | <24 months | Proprietary lock-in risk |
What is included in the product
Detailed Word Document
Tailored Porter's Five Forces analysis for Shoals that uncovers competitive rivalry, supplier and buyer power, entry barriers, substitutes and disruptive threats, with strategic commentary to inform pricing, positioning and growth decisions.
Customizable Excel Spreadsheet
Shoals Porter's Five Forces Analysis delivers a one-sheet, customizable radar view to instantly reveal competitive pressures and relieve strategic uncertainty—easy to edit, copy into decks, and integrate with existing reports.
Customers Bargaining Power
Utility-scale concentration
Large EPCs, developers and IPPs dominate utility-scale orders and run competitive tenders, with 2024 tender sizes commonly exceeding 50 MW and framework agreements often above $50m, concentrating buyer power.
High deal sizes and repeat frameworks enhance leverage, while acute price sensitivity from PPA-driven returns pressures margins.
Demonstrated LCOE benefits, however, can justify premium pricing of roughly 5–15% in bids where lifecycle savings are proven.
Performance guarantees
Buyers demand 25-year warranties, strict delivery SLAs (commonly 30–90 days) and bankability evidence, shifting performance and financial risk to suppliers and compressing margins. Proven field reliability lowers claims and bargaining asymmetry; industry data show monitoring-driven issue detection can cut O&M claims ~20–30%. Shoals’ real-time monitoring and field performance logs therefore strengthen its negotiating position with lenders and large EPCs.
Standardization and spec power
Procurement teams favor standardized, interoperable EBOS because generic specs let buyers switch vendors easily; a 2024 industry survey found 68% of EPCs prioritize plug-and-play interoperability. Shoals embeds value with pre-terminated systems and plug-and-play designs that can cut installation labor 30–50%, and these integration savings materially reduce buyer appetite to switch.
Total cost focus
- Installed-cost focus: BOS ~40–60% (NREL 2023–24)
- EBOS install-time cut: industry reports 20–40% (2024)
- Lifecycle TCO savings: 10–25% via calculators
- Documented BOS savings lower price-only buyer power
Multi-year pipelines
Developers with gigawatt-scale pipelines (1+ GW) pressure suppliers for volume discounts; multi-year visibility often trades for lower prices and priority allocation in procurement cycles. Shoals can bundle solar, storage and EV solutions to capture share and shift negotiations from price-per-product to portfolio value, reducing buyer leverage across individual product lines.
- Developers: 1+ GW pipelines
- Leverage: volume discounts, priority allocation
- Shoals strategy: bundling solar+storage+EV
- Effect: lower buyer power per product
EPCs demand interoperable EBOS: cut installs 20-40%, save 10-25% lifecycle
Large EPCs/IPPs run 50+ MW tenders and $50m+ frameworks in 2024, concentrating buyer power. BOS is 40–60% of installed cost (NREL 2023–24) so buyers prioritize TCO; EBOS can cut install time 20–40% and deliver 10–25% lifecycle savings. 68% of EPCs prioritize interoperability (2024 survey); 25-year warranties and strict SLAs shift risk to suppliers.
| Metric | Value |
|---|---|
| Tender size | 50+ MW (2024) |
| Frameworks | $50m+ |
| BOS share | 40–60% (NREL 2023–24) |
| Install time cut | 20–40% (2024) |
| Lifecycle savings | 10–25% |
| Interoperability | 68% (2024) |
Full Version Awaits
Shoals Porter's Five Forces Analysis
This preview shows the exact Shoals Porter’s Five Forces analysis you'll receive immediately after purchase—no placeholders or samples. The document is fully formatted, professionally written, and ready to download. You’ll get instant access to this identical file upon payment.
Original: $10.00
-65%$10.00
$3.50Description
Go Beyond the Preview—Access the Full Strategic Report
Shoals’s Porter's Five Forces snapshot highlights supplier concentration, buyer leverage, and competitive rivalry shaping its margins and growth prospects. It identifies key external threats and strategic levers but only scratches the surface. Unlock the full Porter's Five Forces Analysis to explore force-by-force ratings, visuals, and actionable insights tailored to Shoals.
Suppliers Bargaining Power
Specialized components
Shoals depends on precision connectors, cables, breakers and inverter parts with few qualified sources, so supplier specialization raises switching costs and extended lead times (industry lead times spiked to ~20–25 weeks in 2021–22). During demand spikes suppliers can impose tighter terms and price pressure. Dual-sourcing and design-for-substitution have lowered disruption frequency but do not eliminate dependency.
Raw materials volatility
Copper, aluminum, resins and semiconductors exhibit pronounced price swings and allocation constraints, enabling suppliers to exert pricing pressure in tight markets. Suppliers commonly pass cost increases through quickly; Shoals’ long-term contracts and hedging mitigate but do not fully eliminate exposure. Inventory buffers and VAVE initiatives incrementally lower material intensity and blunt recurring volatility.
Quality and certification
UL, IEC and utility interconnection standards require certified inputs, and as of 2024 certification and requalification processes typically take several months, raising cost and lead time. Fewer suppliers meet utility-scale bankability and reliability thresholds, concentrating leverage among a small, bankable cohort. Requalification is costly and slow, boosting supplier bargaining power. Long-term partnerships trade volume visibility for stable, certified quality.
Logistics and lead times
- Transit risk: long global routes increase supplier leverage
- Lead times: 12–24 weeks for electronics (2024)
- Nearshoring: +10–25% unit cost
- Mitigation: VMI and better forecasts reduce inventory/stockouts
Technology tie-ins
Power electronics and monitoring components evolve rapidly, with upgrade cycles typically under 24 months, so suppliers who offer proprietary firmware or custom specs increase customer lock-in and bargaining power. Open architectures and modular EBOS designs erode that power by enabling easier supplier substitution. Shoals’ standardization strategy limits bespoke dependencies and lowers switching costs.
Elevated supplier power from 12–24 week electronics lead times and certification lock-in
Shoals faces elevated supplier power from few qualified vendors, long electronics lead times (12–24 weeks in 2024) and material price volatility, raising switching costs and short-term price pass-through. Long certification/requalification cycles (several months) and proprietary firmware increase lock-in, while modular designs, dual-sourcing and VMI reduce but do not remove leverage.
| Metric | 2024 | Impact |
|---|---|---|
| Electronics lead time | 12–24 weeks | Higher pricing power |
| Nearshoring cost delta | +10–25% | Lower transit risk, higher unit cost |
| Upgrade cycle | <24 months | Proprietary lock-in risk |
What is included in the product
Detailed Word Document
Tailored Porter's Five Forces analysis for Shoals that uncovers competitive rivalry, supplier and buyer power, entry barriers, substitutes and disruptive threats, with strategic commentary to inform pricing, positioning and growth decisions.
Customizable Excel Spreadsheet
Shoals Porter's Five Forces Analysis delivers a one-sheet, customizable radar view to instantly reveal competitive pressures and relieve strategic uncertainty—easy to edit, copy into decks, and integrate with existing reports.
Customers Bargaining Power
Utility-scale concentration
Large EPCs, developers and IPPs dominate utility-scale orders and run competitive tenders, with 2024 tender sizes commonly exceeding 50 MW and framework agreements often above $50m, concentrating buyer power.
High deal sizes and repeat frameworks enhance leverage, while acute price sensitivity from PPA-driven returns pressures margins.
Demonstrated LCOE benefits, however, can justify premium pricing of roughly 5–15% in bids where lifecycle savings are proven.
Performance guarantees
Buyers demand 25-year warranties, strict delivery SLAs (commonly 30–90 days) and bankability evidence, shifting performance and financial risk to suppliers and compressing margins. Proven field reliability lowers claims and bargaining asymmetry; industry data show monitoring-driven issue detection can cut O&M claims ~20–30%. Shoals’ real-time monitoring and field performance logs therefore strengthen its negotiating position with lenders and large EPCs.
Standardization and spec power
Procurement teams favor standardized, interoperable EBOS because generic specs let buyers switch vendors easily; a 2024 industry survey found 68% of EPCs prioritize plug-and-play interoperability. Shoals embeds value with pre-terminated systems and plug-and-play designs that can cut installation labor 30–50%, and these integration savings materially reduce buyer appetite to switch.
Total cost focus
- Installed-cost focus: BOS ~40–60% (NREL 2023–24)
- EBOS install-time cut: industry reports 20–40% (2024)
- Lifecycle TCO savings: 10–25% via calculators
- Documented BOS savings lower price-only buyer power
Multi-year pipelines
Developers with gigawatt-scale pipelines (1+ GW) pressure suppliers for volume discounts; multi-year visibility often trades for lower prices and priority allocation in procurement cycles. Shoals can bundle solar, storage and EV solutions to capture share and shift negotiations from price-per-product to portfolio value, reducing buyer leverage across individual product lines.
- Developers: 1+ GW pipelines
- Leverage: volume discounts, priority allocation
- Shoals strategy: bundling solar+storage+EV
- Effect: lower buyer power per product
EPCs demand interoperable EBOS: cut installs 20-40%, save 10-25% lifecycle
Large EPCs/IPPs run 50+ MW tenders and $50m+ frameworks in 2024, concentrating buyer power. BOS is 40–60% of installed cost (NREL 2023–24) so buyers prioritize TCO; EBOS can cut install time 20–40% and deliver 10–25% lifecycle savings. 68% of EPCs prioritize interoperability (2024 survey); 25-year warranties and strict SLAs shift risk to suppliers.
| Metric | Value |
|---|---|
| Tender size | 50+ MW (2024) |
| Frameworks | $50m+ |
| BOS share | 40–60% (NREL 2023–24) |
| Install time cut | 20–40% (2024) |
| Lifecycle savings | 10–25% |
| Interoperability | 68% (2024) |
Full Version Awaits
Shoals Porter's Five Forces Analysis
This preview shows the exact Shoals Porter’s Five Forces analysis you'll receive immediately after purchase—no placeholders or samples. The document is fully formatted, professionally written, and ready to download. You’ll get instant access to this identical file upon payment.











