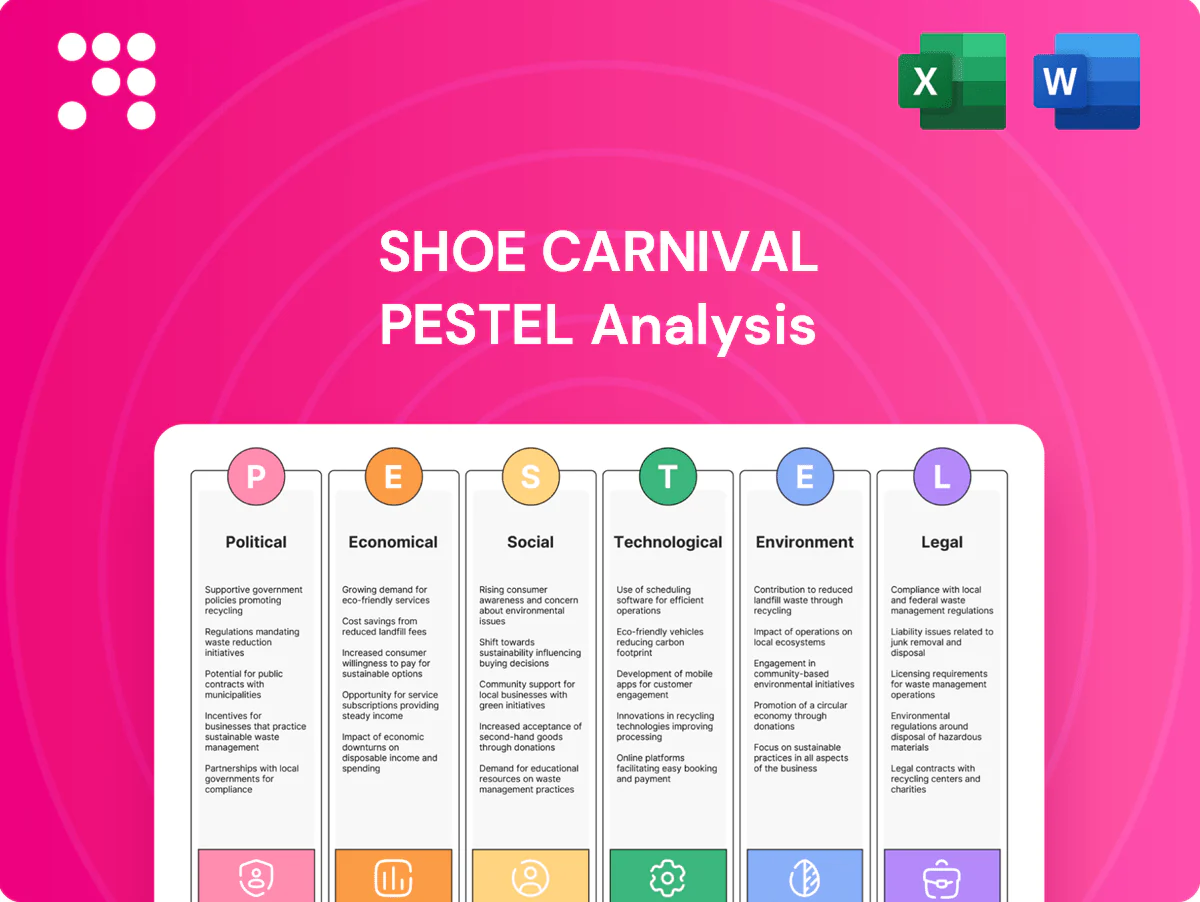
Shoe Carnival PESTLE Analysis

Your Competitive Advantage Starts with This Report
Explore how political shifts, economic cycles, social trends, technological change, legal developments, and environmental pressures shape Shoe Carnival’s strategy in our concise PESTLE Analysis—perfect for investors and strategists. Get the full, actionable report with editable charts and instant download to inform decisions and spot opportunities.
Political factors

Footwear import tariffs
U.S. footwear faces long-standing MFN tariffs (commonly around 8.5% for many shoe categories) plus China-specific Section 301 duties of 7.5% imposed since 2018, elevating landed costs. Policy shifts or USTR exclusions have materially altered cost curves, directly affecting retail margins and pricing power. Diversifying sourcing lowers China exposure but increases supply-chain complexity and working-capital needs. Monitoring USTR actions and trade talks is critical for planning.
State sales tax and holidays
More than 10 Southern states run back-to-school sales tax holidays that reliably lift store traffic and average ticket, affecting Shoe Carnival's roughly 320-store footprint. Variability in exemption thresholds and timing across states complicates in-store and regional pricing and inventory allocation. Changes to thresholds or timing shift promotional calendars and markdown strategies. Tight coordination with e-commerce tax engines is essential to apply state rules in real time.

Port, logistics, and infrastructure policy
Federal investment under the Infrastructure Investment and Jobs Act committed roughly 17 billion dollars for ports, waterways and coastal resilience, aiming to reduce congestion that otherwise lengthens lead times and raises freight costs. Labor disputes at major U.S. ports have historically added weeks to transit and spiked spot rates, increasing landed cost volatility. Southeast distribution hubs (closer to major ports) boost service levels and lower inland transit time. Policy changes to trucking and rail rules continue to alter capacity, surcharges and require network redesign to maintain reliability.

Retail theft and ORC initiatives
Political focus on organized retail crime has spurred state attorney general task forces and tougher penalties, increasing enforcement attention on chains like Shoe Carnival. State and local funding levels directly affect store-level shrink through staffing and investigative capacity. New marketplace seller verification laws aim to reduce fencing of stolen goods while coalition engagement amplifies policy impact.
- State AG task forces
- Enforcement funding ↔ shrink
- Seller verification laws
- Coalition engagement
Minimum wage and local incentives
State and municipal wage policies drive Shoe Carnival store labor costs, with state minimums varying roughly from 7.25 to about 16.50 per hour in recent years, pushing labor to roughly 12–15% of sales in many locations; rising local wages require tailored scheduling and staffing mixes. Local incentives for distribution centers or store openings can offset millions in capex. Strategic advocacy can secure workforce training grants (WIOA and state programs) to lower hiring and training costs.
- Labor cost range: 7.25–16.50/hr
- Labor share: ~12–15% of sales
- Incentives: can offset millions in capex
- Grants: WIOA/state workforce training
Tariffs, IIJA port funding and labor costs squeeze margins and fuel shipping volatility
Tariffs: MFN ~8.5% + China Section 301 duties 7.5% raise landed costs and compress margins. Sales-tax holidays in >10 Southern states reliably boost traffic and tickets, complicating regional pricing. IIJA port funding ~$17B and port labor disputes affect lead times and freight volatility. State wage range $7.25–$16.50/hr; labor ~12–15% of sales.
| Item | Metric |
|---|---|
| MFN tariff | ~8.5% |
| Section 301 | 7.5% |
| IIJA ports | $17B |
| Wage range | $7.25–$16.50/hr |
| Labor share | ~12–15% sales |
What is included in the product
 Detailed Word Document
Explores how Political, Economic, Social, Technological, Environmental and Legal forces uniquely affect Shoe Carnival, with each factor grounded in current data and industry trends to reveal risks and opportunities; designed for executives, advisors and investors to support strategy, scenario planning and funding discussions.

 Customizable Excel Spreadsheet
Condenses Shoe Carnival's full PESTLE into a visually segmented, easy-to-share summary for meetings or decks, using plain language and editable notes so teams can quickly assess external risks, regional impacts, and market positioning during planning sessions.
Economic factors

Consumer spending sensitivity
Footwear is discretionary and tracks real wages and confidence; Conference Board consumer confidence was 103.4 in June 2025, while real average hourly earnings remain below pre‑pandemic peaks, pressuring spending. Families commonly trade down or delay shoe purchases when stretched, concentrating demand in back‑to‑school and holiday seasons that together drive a large share of annual footwear sales. Shoe Carnival’s value messaging and promotions help smooth these seasonal and macro-driven swings.
Inflation and input costs
Material, labor, and freight inflation drove vendor pricing pressure—US CPI rose about 3.4% in 2024 and average hourly earnings grew roughly 4.2%, while container rates remained markedly below 2022 peaks (container indices down roughly 60–70%), forcing brands to push cost onto retail. Retail price elasticity varies by category and brand, so Shoe Carnival leans on mix shifts, private label growth and strict markdown discipline to protect margins. Margin management has relied on higher-margin private label penetration and reduced promotional depth; hedging freight and executing early buys have been used to mitigate spike risk.

Competitive pricing dynamics
Competitive pricing dynamics: off-price, mass, and brand DTC have increased price transparency, pressuring Shoe Carnival (NASDAQ: SCVL) to align dynamic pricing and promo cadence with local competitors; vendor MAP policies limit discount flexibility, while data-driven assortment and targeted promotions defended traffic and margins amid FY2024 net sales of about $1.1 billion.

Labor market tightness
Tight labor markets (U.S. unemployment ~3.7% June 2024, BLS) push wage rates and turnover higher, compressing per-store productivity for Shoe Carnival; incentives and targeted training lift conversion in experiential store formats, while cross-training enables lean staffing during peaks. Automation of backroom functions (inventory/counting) reduces labor cost per transaction and supports margin resilience.
- Wage pressure: higher hourly costs
- Training/incentives: better conversion
- Cross-training + automation: lean staffing
Interest rates and capital allocation
Higher interest rates (Federal Reserve target roughly 5.25–5.50% in mid‑2025) raise lease and build‑out hurdle rates for Shoe Carnival, increasing the cost of capital and squeezing ROI on store projects; inventory carrying costs rise as discount rates used in valuation climb, tightening open‑to‑buy and prioritizing cash deployment between share repurchases and remodels.
- Higher policy rate: 5.25–5.50% (mid‑2025)
- Capital allocation tradeoff: repurchases vs. remodels
- Mitigant: flexible leases and landlord allowances preserve optionality
Tariffs, IIJA port funding and labor costs squeeze margins and fuel shipping volatility
Shoe Carnival sales track discretionary spend; Conference Board consumer confidence 103.4 (Jun 2025) while real wages remain below pre‑pandemic peaks, concentrating demand in back‑to‑school and holiday seasons and favoring value positioning. 2024 US CPI ~3.4% and avg hourly earnings +4.2% pressured costs; FY2024 net sales ~$1.1B and private‑label mix supports margins. Fed funds ~5.25–5.50% mid‑2025 raises capex and lease hurdle rates.
| Metric | Value |
|---|---|
| Consumer Confidence (Jun 2025) | 103.4 |
| US CPI (2024) | ~3.4% |
| Avg Hourly Earnings (2024) | +4.2% |
| FY2024 Net Sales | $1.1B |
| Fed Funds (mid‑2025) | 5.25–5.50% |
What You See Is What You Get
Shoe Carnival PESTLE Analysis
The Shoe Carnival PESTLE Analysis preview shown here is the exact document you’ll receive after purchase—fully formatted and ready to use. The layout, content, and structure visible are identical to the downloadable file, with no placeholders or surprises. After checkout you’ll instantly own this finished, professionally structured report.

Your Competitive Advantage Starts with This Report
Explore how political shifts, economic cycles, social trends, technological change, legal developments, and environmental pressures shape Shoe Carnival’s strategy in our concise PESTLE Analysis—perfect for investors and strategists. Get the full, actionable report with editable charts and instant download to inform decisions and spot opportunities.
Political factors
Footwear import tariffs
U.S. footwear faces long-standing MFN tariffs (commonly around 8.5% for many shoe categories) plus China-specific Section 301 duties of 7.5% imposed since 2018, elevating landed costs. Policy shifts or USTR exclusions have materially altered cost curves, directly affecting retail margins and pricing power. Diversifying sourcing lowers China exposure but increases supply-chain complexity and working-capital needs. Monitoring USTR actions and trade talks is critical for planning.
State sales tax and holidays
More than 10 Southern states run back-to-school sales tax holidays that reliably lift store traffic and average ticket, affecting Shoe Carnival's roughly 320-store footprint. Variability in exemption thresholds and timing across states complicates in-store and regional pricing and inventory allocation. Changes to thresholds or timing shift promotional calendars and markdown strategies. Tight coordination with e-commerce tax engines is essential to apply state rules in real time.
Port, logistics, and infrastructure policy
Federal investment under the Infrastructure Investment and Jobs Act committed roughly 17 billion dollars for ports, waterways and coastal resilience, aiming to reduce congestion that otherwise lengthens lead times and raises freight costs. Labor disputes at major U.S. ports have historically added weeks to transit and spiked spot rates, increasing landed cost volatility. Southeast distribution hubs (closer to major ports) boost service levels and lower inland transit time. Policy changes to trucking and rail rules continue to alter capacity, surcharges and require network redesign to maintain reliability.
Retail theft and ORC initiatives
Political focus on organized retail crime has spurred state attorney general task forces and tougher penalties, increasing enforcement attention on chains like Shoe Carnival. State and local funding levels directly affect store-level shrink through staffing and investigative capacity. New marketplace seller verification laws aim to reduce fencing of stolen goods while coalition engagement amplifies policy impact.
- State AG task forces
- Enforcement funding ↔ shrink
- Seller verification laws
- Coalition engagement
Minimum wage and local incentives
State and municipal wage policies drive Shoe Carnival store labor costs, with state minimums varying roughly from 7.25 to about 16.50 per hour in recent years, pushing labor to roughly 12–15% of sales in many locations; rising local wages require tailored scheduling and staffing mixes. Local incentives for distribution centers or store openings can offset millions in capex. Strategic advocacy can secure workforce training grants (WIOA and state programs) to lower hiring and training costs.
- Labor cost range: 7.25–16.50/hr
- Labor share: ~12–15% of sales
- Incentives: can offset millions in capex
- Grants: WIOA/state workforce training
Tariffs, IIJA port funding and labor costs squeeze margins and fuel shipping volatility
Tariffs: MFN ~8.5% + China Section 301 duties 7.5% raise landed costs and compress margins. Sales-tax holidays in >10 Southern states reliably boost traffic and tickets, complicating regional pricing. IIJA port funding ~$17B and port labor disputes affect lead times and freight volatility. State wage range $7.25–$16.50/hr; labor ~12–15% of sales.
| Item | Metric |
|---|---|
| MFN tariff | ~8.5% |
| Section 301 | 7.5% |
| IIJA ports | $17B |
| Wage range | $7.25–$16.50/hr |
| Labor share | ~12–15% sales |
What is included in the product
Detailed Word Document
Explores how Political, Economic, Social, Technological, Environmental and Legal forces uniquely affect Shoe Carnival, with each factor grounded in current data and industry trends to reveal risks and opportunities; designed for executives, advisors and investors to support strategy, scenario planning and funding discussions.
Customizable Excel Spreadsheet
Condenses Shoe Carnival's full PESTLE into a visually segmented, easy-to-share summary for meetings or decks, using plain language and editable notes so teams can quickly assess external risks, regional impacts, and market positioning during planning sessions.
Economic factors
Consumer spending sensitivity
Footwear is discretionary and tracks real wages and confidence; Conference Board consumer confidence was 103.4 in June 2025, while real average hourly earnings remain below pre‑pandemic peaks, pressuring spending. Families commonly trade down or delay shoe purchases when stretched, concentrating demand in back‑to‑school and holiday seasons that together drive a large share of annual footwear sales. Shoe Carnival’s value messaging and promotions help smooth these seasonal and macro-driven swings.
Inflation and input costs
Material, labor, and freight inflation drove vendor pricing pressure—US CPI rose about 3.4% in 2024 and average hourly earnings grew roughly 4.2%, while container rates remained markedly below 2022 peaks (container indices down roughly 60–70%), forcing brands to push cost onto retail. Retail price elasticity varies by category and brand, so Shoe Carnival leans on mix shifts, private label growth and strict markdown discipline to protect margins. Margin management has relied on higher-margin private label penetration and reduced promotional depth; hedging freight and executing early buys have been used to mitigate spike risk.
Competitive pricing dynamics
Competitive pricing dynamics: off-price, mass, and brand DTC have increased price transparency, pressuring Shoe Carnival (NASDAQ: SCVL) to align dynamic pricing and promo cadence with local competitors; vendor MAP policies limit discount flexibility, while data-driven assortment and targeted promotions defended traffic and margins amid FY2024 net sales of about $1.1 billion.
Labor market tightness
Tight labor markets (U.S. unemployment ~3.7% June 2024, BLS) push wage rates and turnover higher, compressing per-store productivity for Shoe Carnival; incentives and targeted training lift conversion in experiential store formats, while cross-training enables lean staffing during peaks. Automation of backroom functions (inventory/counting) reduces labor cost per transaction and supports margin resilience.
- Wage pressure: higher hourly costs
- Training/incentives: better conversion
- Cross-training + automation: lean staffing
Interest rates and capital allocation
Higher interest rates (Federal Reserve target roughly 5.25–5.50% in mid‑2025) raise lease and build‑out hurdle rates for Shoe Carnival, increasing the cost of capital and squeezing ROI on store projects; inventory carrying costs rise as discount rates used in valuation climb, tightening open‑to‑buy and prioritizing cash deployment between share repurchases and remodels.
- Higher policy rate: 5.25–5.50% (mid‑2025)
- Capital allocation tradeoff: repurchases vs. remodels
- Mitigant: flexible leases and landlord allowances preserve optionality
Tariffs, IIJA port funding and labor costs squeeze margins and fuel shipping volatility
Shoe Carnival sales track discretionary spend; Conference Board consumer confidence 103.4 (Jun 2025) while real wages remain below pre‑pandemic peaks, concentrating demand in back‑to‑school and holiday seasons and favoring value positioning. 2024 US CPI ~3.4% and avg hourly earnings +4.2% pressured costs; FY2024 net sales ~$1.1B and private‑label mix supports margins. Fed funds ~5.25–5.50% mid‑2025 raises capex and lease hurdle rates.
| Metric | Value |
|---|---|
| Consumer Confidence (Jun 2025) | 103.4 |
| US CPI (2024) | ~3.4% |
| Avg Hourly Earnings (2024) | +4.2% |
| FY2024 Net Sales | $1.1B |
| Fed Funds (mid‑2025) | 5.25–5.50% |
What You See Is What You Get
Shoe Carnival PESTLE Analysis
The Shoe Carnival PESTLE Analysis preview shown here is the exact document you’ll receive after purchase—fully formatted and ready to use. The layout, content, and structure visible are identical to the downloadable file, with no placeholders or surprises. After checkout you’ll instantly own this finished, professionally structured report.
Description
Your Competitive Advantage Starts with This Report
Explore how political shifts, economic cycles, social trends, technological change, legal developments, and environmental pressures shape Shoe Carnival’s strategy in our concise PESTLE Analysis—perfect for investors and strategists. Get the full, actionable report with editable charts and instant download to inform decisions and spot opportunities.
Political factors
Footwear import tariffs
U.S. footwear faces long-standing MFN tariffs (commonly around 8.5% for many shoe categories) plus China-specific Section 301 duties of 7.5% imposed since 2018, elevating landed costs. Policy shifts or USTR exclusions have materially altered cost curves, directly affecting retail margins and pricing power. Diversifying sourcing lowers China exposure but increases supply-chain complexity and working-capital needs. Monitoring USTR actions and trade talks is critical for planning.
State sales tax and holidays
More than 10 Southern states run back-to-school sales tax holidays that reliably lift store traffic and average ticket, affecting Shoe Carnival's roughly 320-store footprint. Variability in exemption thresholds and timing across states complicates in-store and regional pricing and inventory allocation. Changes to thresholds or timing shift promotional calendars and markdown strategies. Tight coordination with e-commerce tax engines is essential to apply state rules in real time.
Port, logistics, and infrastructure policy
Federal investment under the Infrastructure Investment and Jobs Act committed roughly 17 billion dollars for ports, waterways and coastal resilience, aiming to reduce congestion that otherwise lengthens lead times and raises freight costs. Labor disputes at major U.S. ports have historically added weeks to transit and spiked spot rates, increasing landed cost volatility. Southeast distribution hubs (closer to major ports) boost service levels and lower inland transit time. Policy changes to trucking and rail rules continue to alter capacity, surcharges and require network redesign to maintain reliability.
Retail theft and ORC initiatives
Political focus on organized retail crime has spurred state attorney general task forces and tougher penalties, increasing enforcement attention on chains like Shoe Carnival. State and local funding levels directly affect store-level shrink through staffing and investigative capacity. New marketplace seller verification laws aim to reduce fencing of stolen goods while coalition engagement amplifies policy impact.
- State AG task forces
- Enforcement funding ↔ shrink
- Seller verification laws
- Coalition engagement
Minimum wage and local incentives
State and municipal wage policies drive Shoe Carnival store labor costs, with state minimums varying roughly from 7.25 to about 16.50 per hour in recent years, pushing labor to roughly 12–15% of sales in many locations; rising local wages require tailored scheduling and staffing mixes. Local incentives for distribution centers or store openings can offset millions in capex. Strategic advocacy can secure workforce training grants (WIOA and state programs) to lower hiring and training costs.
- Labor cost range: 7.25–16.50/hr
- Labor share: ~12–15% of sales
- Incentives: can offset millions in capex
- Grants: WIOA/state workforce training
Tariffs, IIJA port funding and labor costs squeeze margins and fuel shipping volatility
Tariffs: MFN ~8.5% + China Section 301 duties 7.5% raise landed costs and compress margins. Sales-tax holidays in >10 Southern states reliably boost traffic and tickets, complicating regional pricing. IIJA port funding ~$17B and port labor disputes affect lead times and freight volatility. State wage range $7.25–$16.50/hr; labor ~12–15% of sales.
| Item | Metric |
|---|---|
| MFN tariff | ~8.5% |
| Section 301 | 7.5% |
| IIJA ports | $17B |
| Wage range | $7.25–$16.50/hr |
| Labor share | ~12–15% sales |
What is included in the product
Detailed Word Document
Explores how Political, Economic, Social, Technological, Environmental and Legal forces uniquely affect Shoe Carnival, with each factor grounded in current data and industry trends to reveal risks and opportunities; designed for executives, advisors and investors to support strategy, scenario planning and funding discussions.
Customizable Excel Spreadsheet
Condenses Shoe Carnival's full PESTLE into a visually segmented, easy-to-share summary for meetings or decks, using plain language and editable notes so teams can quickly assess external risks, regional impacts, and market positioning during planning sessions.
Economic factors
Consumer spending sensitivity
Footwear is discretionary and tracks real wages and confidence; Conference Board consumer confidence was 103.4 in June 2025, while real average hourly earnings remain below pre‑pandemic peaks, pressuring spending. Families commonly trade down or delay shoe purchases when stretched, concentrating demand in back‑to‑school and holiday seasons that together drive a large share of annual footwear sales. Shoe Carnival’s value messaging and promotions help smooth these seasonal and macro-driven swings.
Inflation and input costs
Material, labor, and freight inflation drove vendor pricing pressure—US CPI rose about 3.4% in 2024 and average hourly earnings grew roughly 4.2%, while container rates remained markedly below 2022 peaks (container indices down roughly 60–70%), forcing brands to push cost onto retail. Retail price elasticity varies by category and brand, so Shoe Carnival leans on mix shifts, private label growth and strict markdown discipline to protect margins. Margin management has relied on higher-margin private label penetration and reduced promotional depth; hedging freight and executing early buys have been used to mitigate spike risk.
Competitive pricing dynamics
Competitive pricing dynamics: off-price, mass, and brand DTC have increased price transparency, pressuring Shoe Carnival (NASDAQ: SCVL) to align dynamic pricing and promo cadence with local competitors; vendor MAP policies limit discount flexibility, while data-driven assortment and targeted promotions defended traffic and margins amid FY2024 net sales of about $1.1 billion.
Labor market tightness
Tight labor markets (U.S. unemployment ~3.7% June 2024, BLS) push wage rates and turnover higher, compressing per-store productivity for Shoe Carnival; incentives and targeted training lift conversion in experiential store formats, while cross-training enables lean staffing during peaks. Automation of backroom functions (inventory/counting) reduces labor cost per transaction and supports margin resilience.
- Wage pressure: higher hourly costs
- Training/incentives: better conversion
- Cross-training + automation: lean staffing
Interest rates and capital allocation
Higher interest rates (Federal Reserve target roughly 5.25–5.50% in mid‑2025) raise lease and build‑out hurdle rates for Shoe Carnival, increasing the cost of capital and squeezing ROI on store projects; inventory carrying costs rise as discount rates used in valuation climb, tightening open‑to‑buy and prioritizing cash deployment between share repurchases and remodels.
- Higher policy rate: 5.25–5.50% (mid‑2025)
- Capital allocation tradeoff: repurchases vs. remodels
- Mitigant: flexible leases and landlord allowances preserve optionality
Tariffs, IIJA port funding and labor costs squeeze margins and fuel shipping volatility
Shoe Carnival sales track discretionary spend; Conference Board consumer confidence 103.4 (Jun 2025) while real wages remain below pre‑pandemic peaks, concentrating demand in back‑to‑school and holiday seasons and favoring value positioning. 2024 US CPI ~3.4% and avg hourly earnings +4.2% pressured costs; FY2024 net sales ~$1.1B and private‑label mix supports margins. Fed funds ~5.25–5.50% mid‑2025 raises capex and lease hurdle rates.
| Metric | Value |
|---|---|
| Consumer Confidence (Jun 2025) | 103.4 |
| US CPI (2024) | ~3.4% |
| Avg Hourly Earnings (2024) | +4.2% |
| FY2024 Net Sales | $1.1B |
| Fed Funds (mid‑2025) | 5.25–5.50% |
What You See Is What You Get
Shoe Carnival PESTLE Analysis
The Shoe Carnival PESTLE Analysis preview shown here is the exact document you’ll receive after purchase—fully formatted and ready to use. The layout, content, and structure visible are identical to the downloadable file, with no placeholders or surprises. After checkout you’ll instantly own this finished, professionally structured report.











