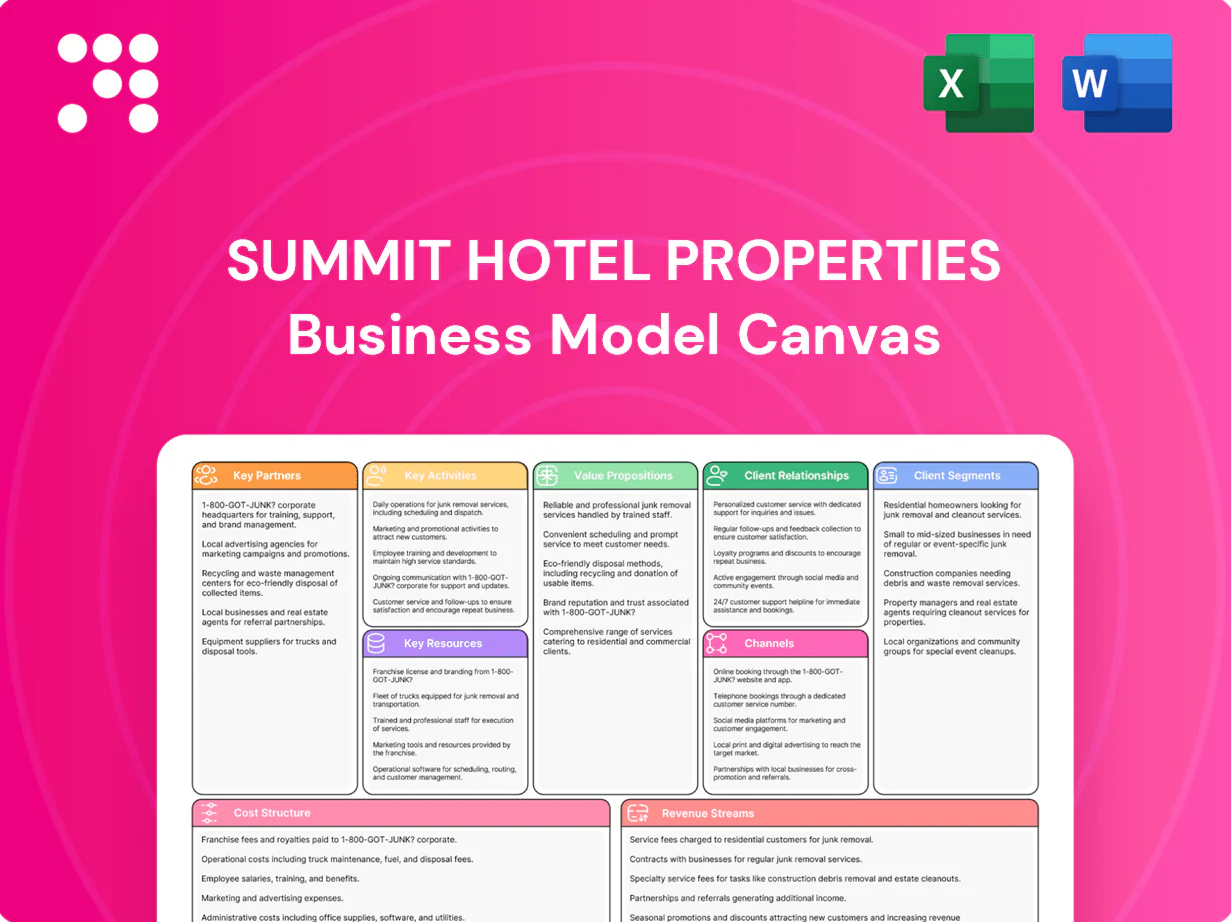
Summit Hotel Properties Business Model Canvas

Business Model Canvas for a Hotel REIT: revenue, partners, and growth levers
Unlock Summit Hotel Properties’s strategic playbook with a concise Business Model Canvas that maps customer segments, revenue streams, partnerships, and operational levers. This three-sentence snapshot reveals how the REIT scales value and manages risk. Purchase the full, editable canvas in Word and Excel for a sector-ready template to benchmark, plan, and pitch with confidence.
Partnerships

Global hotel brands
Partnerships with Marriott, Hilton, Hyatt and similar premium select-service brands provide flagging, brand standards, loyalty access and global distribution scale; Marriott (≈8,100 properties), Hilton (≈7,300) and Hyatt (≈1,400) extend channel reach and guest trust. Brand affiliation boosts pricing power and occupancy through recognition, while franchise agreements specify fees, PIPs and performance metrics. These partnerships underpin demand generation and asset value.
Third-party hotel operators
Specialized third-party management companies run day-to-day hotel operations for Summit under management agreements, delivering labor management, guest service and local sales execution. Contracts typically include base fees around 2–4% of total revenue plus incentive fees up to ~20% of GOP tied to profitability. Strong operator alignment historically supports RevPAR gains and margin expansion.

OTAs, GDS, and travel platforms
Distribution partners like Booking and Expedia plus GDS platforms extend Summit Hotel Properties reach to leisure and unmanaged corporate travelers; OTAs typically charge average commissions around 15% (2024 industry norm) but boost occupancy in shoulder periods and provide booking and guest data that feed revenue management systems to optimize rate and channel mix.

Lenders, equity and JV partners
Relationships with banks, CMBS lenders and institutional equity provide Summit Hotel Properties with acquisition and refinancing capacity, enabling opportunistic purchases and debt resets across the portfolio.
Joint ventures allow participation in larger or specialized transactions while sharing execution risk, and flexible capital structures support portfolio optimization through maturities and covenant management; financing partners remain critical through cycles.
- Bank and CMBS lending: acquisition/refinance capacity
- Institutional equity: capital for growth
- Joint ventures: scale and risk-sharing
- Flexible capital: portfolio optimization
Vendors, contractors, and insurers
Vendors, contractors, and insurers coordinate FF&E suppliers, renovation contractors, and technology providers to ensure brand compliance and asset upkeep; 2024 industry FF&E cycles average 7–10 years with typical capex per room widely cited at roughly 4,000–7,000 USD, supporting long-term asset value.
- Insurance: property, liability, BI coverage
- Renovation: brand-compliant contractors
- Energy: utility partners reduce OPEX
- Vendor ecosystem: protects quality & resilience
Franchise brands, managers and OTAs boost distribution, pricing and capital; OTA ~15% commission
Summit’s brand franchises (Marriott ≈8,100; Hilton ≈7,300; Hyatt ≈1,400 in 2024) drive distribution, pricing power and loyalty access. Third-party managers deliver operations via fees ~2–4% revenue plus incentives up to ~20% GOP. OTAs/GDS boost occupancy despite ~15% commission (2024). Lenders, JV partners and vendors enable transactions, capex and risk-sharing.
| Partner | Key Metric (2024) |
|---|---|
| Brands | Marriott ≈8,100; Hilton ≈7,300; Hyatt ≈1,400 |
| Management | Fees 2–4% rev; incentive ≤20% GOP |
| OTAs | Commission ≈15% |
| FF&E | $4,000–7,000 per room |
What is included in the product
 Detailed Word Document
A tailored Business Model Canvas for Summit Hotel Properties outlining customer segments, value propositions, channels, revenue streams, cost structure, key partners and activities across 9 blocks, with competitive analysis, SWOT-linked insights and investor-ready narrative to support strategic decisions and financing discussions.

 Customizable Excel Spreadsheet
Condenses Summit Hotel Properties’ strategy into an editable one-page canvas, quickly highlighting revenue drivers, asset-management and operational pain points for faster decision-making and portfolio optimization.
Activities

Active asset management
Oversee operational KPIs, dynamic pricing, and tight cost controls with third-party managers to maximize NOI, coordinating monthly performance reviews and variance analyses. Benchmark performance against comp sets to drive RevPAR penetration and adjust strategy when market share lags. Intervene on underperformers with targeted action plans—capital improvements, marketing shifts, and management changes. Align incentives to owner-priority returns and monitor through quarterly waterfall and return metrics.
Portfolio optimization
Portfolio optimization focuses on acquiring, disposing, and reflagging assets to upgrade the quality mix and improve market exposure, recycling capital from non-core markets into higher-growth corridors. Executing targeted PIPs unlocks brand-led demand and ADR gains, while active asset rotation reduces concentration and mitigates seasonality risk through geographic diversification.

Capital allocation and financing
Summit allocates capital across debt, equity, and joint-venture structures to fund growth and renovations while managing sponsor dilution. The company pursues refinancing to lower its weighted average cost of capital and extend debt maturities. It maintains REIT compliance on qualifying income and distributions and prioritizes liquidity buffers to navigate hotel cycles and opportunistic acquisitions.

Renovation and PIP execution
Plan and deliver brand-mandated upgrades on time and budget, sequencing room-out strategies to minimize displacement and maintain occupancy; capture energy and operational efficiencies—2024 ENERGY STAR/DOE data show lighting and controls plus HVAC upgrades reduce energy 20–35%—and elevate guest satisfaction to support RevPAR and ADR growth (industry renovation lifts RevPAR ~6–12%).
- On-time, on-budget PIP delivery
- Room-out sequencing to reduce displacement
- Energy savings 20–35% (2024 DOE/ENERGY STAR)
- Renovation-driven RevPAR uplift ~6–12%
Investor relations and compliance
Investor relations and compliance provide transparent reporting and guidance to public shareholders through SEC 10-K/10-Q filings and quarterly calls; dividend policy is managed to satisfy REIT rules requiring distribution of at least 90% of taxable income (2024). ESG efforts prioritize energy, water and waste reductions material to hospitality real estate, while compliance teams enforce regulatory and franchise agreement adherence via audits and franchise oversight.
- SEC filings: 10-K annual, 10-Q quarterly
- REIT payout requirement: ≥90% taxable income (2024)
- ESG focus: energy, water, waste
- Controls: audits, franchise compliance programs
Boost NOI & RevPAR Renovation uplift 6-12%, energy 20-35%
Manage operational KPIs with third-party managers to maximize NOI and RevPAR penetration, intervening on underperformers with PIPs, capex, or management changes. Optimize portfolio via targeted acquisitions, dispositions, and reflagging to improve market mix and reduce concentration. Allocate capital across debt, equity, and JVs, pursuing refinancing to lower WACC and preserve liquidity. Deliver on-time PIPs to capture energy savings and renovation-driven RevPAR gains.
| Metric | 2024 |
|---|---|
| Renovation RevPAR uplift | ~6–12% |
| Energy savings (DOE/ENERGY STAR) | 20–35% |
| REIT payout requirement | ≥90% taxable income |
| SEC reporting | 10-K, 10-Q |
Preview Before You Purchase
Business Model Canvas
The Business Model Canvas previewed here for Summit Hotel Properties is the exact section from the final deliverable, not a mockup. After purchase you'll receive this same fully formatted, editable document in its complete form. No placeholders, no surprises—ready to use, present, and adapt.

Business Model Canvas for a Hotel REIT: revenue, partners, and growth levers
Unlock Summit Hotel Properties’s strategic playbook with a concise Business Model Canvas that maps customer segments, revenue streams, partnerships, and operational levers. This three-sentence snapshot reveals how the REIT scales value and manages risk. Purchase the full, editable canvas in Word and Excel for a sector-ready template to benchmark, plan, and pitch with confidence.
Partnerships
Global hotel brands
Partnerships with Marriott, Hilton, Hyatt and similar premium select-service brands provide flagging, brand standards, loyalty access and global distribution scale; Marriott (≈8,100 properties), Hilton (≈7,300) and Hyatt (≈1,400) extend channel reach and guest trust. Brand affiliation boosts pricing power and occupancy through recognition, while franchise agreements specify fees, PIPs and performance metrics. These partnerships underpin demand generation and asset value.
Third-party hotel operators
Specialized third-party management companies run day-to-day hotel operations for Summit under management agreements, delivering labor management, guest service and local sales execution. Contracts typically include base fees around 2–4% of total revenue plus incentive fees up to ~20% of GOP tied to profitability. Strong operator alignment historically supports RevPAR gains and margin expansion.
OTAs, GDS, and travel platforms
Distribution partners like Booking and Expedia plus GDS platforms extend Summit Hotel Properties reach to leisure and unmanaged corporate travelers; OTAs typically charge average commissions around 15% (2024 industry norm) but boost occupancy in shoulder periods and provide booking and guest data that feed revenue management systems to optimize rate and channel mix.
Lenders, equity and JV partners
Relationships with banks, CMBS lenders and institutional equity provide Summit Hotel Properties with acquisition and refinancing capacity, enabling opportunistic purchases and debt resets across the portfolio.
Joint ventures allow participation in larger or specialized transactions while sharing execution risk, and flexible capital structures support portfolio optimization through maturities and covenant management; financing partners remain critical through cycles.
- Bank and CMBS lending: acquisition/refinance capacity
- Institutional equity: capital for growth
- Joint ventures: scale and risk-sharing
- Flexible capital: portfolio optimization
Vendors, contractors, and insurers
Vendors, contractors, and insurers coordinate FF&E suppliers, renovation contractors, and technology providers to ensure brand compliance and asset upkeep; 2024 industry FF&E cycles average 7–10 years with typical capex per room widely cited at roughly 4,000–7,000 USD, supporting long-term asset value.
- Insurance: property, liability, BI coverage
- Renovation: brand-compliant contractors
- Energy: utility partners reduce OPEX
- Vendor ecosystem: protects quality & resilience
Franchise brands, managers and OTAs boost distribution, pricing and capital; OTA ~15% commission
Summit’s brand franchises (Marriott ≈8,100; Hilton ≈7,300; Hyatt ≈1,400 in 2024) drive distribution, pricing power and loyalty access. Third-party managers deliver operations via fees ~2–4% revenue plus incentives up to ~20% GOP. OTAs/GDS boost occupancy despite ~15% commission (2024). Lenders, JV partners and vendors enable transactions, capex and risk-sharing.
| Partner | Key Metric (2024) |
|---|---|
| Brands | Marriott ≈8,100; Hilton ≈7,300; Hyatt ≈1,400 |
| Management | Fees 2–4% rev; incentive ≤20% GOP |
| OTAs | Commission ≈15% |
| FF&E | $4,000–7,000 per room |
What is included in the product
Detailed Word Document
A tailored Business Model Canvas for Summit Hotel Properties outlining customer segments, value propositions, channels, revenue streams, cost structure, key partners and activities across 9 blocks, with competitive analysis, SWOT-linked insights and investor-ready narrative to support strategic decisions and financing discussions.
Customizable Excel Spreadsheet
Condenses Summit Hotel Properties’ strategy into an editable one-page canvas, quickly highlighting revenue drivers, asset-management and operational pain points for faster decision-making and portfolio optimization.
Activities
Active asset management
Oversee operational KPIs, dynamic pricing, and tight cost controls with third-party managers to maximize NOI, coordinating monthly performance reviews and variance analyses. Benchmark performance against comp sets to drive RevPAR penetration and adjust strategy when market share lags. Intervene on underperformers with targeted action plans—capital improvements, marketing shifts, and management changes. Align incentives to owner-priority returns and monitor through quarterly waterfall and return metrics.
Portfolio optimization
Portfolio optimization focuses on acquiring, disposing, and reflagging assets to upgrade the quality mix and improve market exposure, recycling capital from non-core markets into higher-growth corridors. Executing targeted PIPs unlocks brand-led demand and ADR gains, while active asset rotation reduces concentration and mitigates seasonality risk through geographic diversification.
Capital allocation and financing
Summit allocates capital across debt, equity, and joint-venture structures to fund growth and renovations while managing sponsor dilution. The company pursues refinancing to lower its weighted average cost of capital and extend debt maturities. It maintains REIT compliance on qualifying income and distributions and prioritizes liquidity buffers to navigate hotel cycles and opportunistic acquisitions.
Renovation and PIP execution
Plan and deliver brand-mandated upgrades on time and budget, sequencing room-out strategies to minimize displacement and maintain occupancy; capture energy and operational efficiencies—2024 ENERGY STAR/DOE data show lighting and controls plus HVAC upgrades reduce energy 20–35%—and elevate guest satisfaction to support RevPAR and ADR growth (industry renovation lifts RevPAR ~6–12%).
- On-time, on-budget PIP delivery
- Room-out sequencing to reduce displacement
- Energy savings 20–35% (2024 DOE/ENERGY STAR)
- Renovation-driven RevPAR uplift ~6–12%
Investor relations and compliance
Investor relations and compliance provide transparent reporting and guidance to public shareholders through SEC 10-K/10-Q filings and quarterly calls; dividend policy is managed to satisfy REIT rules requiring distribution of at least 90% of taxable income (2024). ESG efforts prioritize energy, water and waste reductions material to hospitality real estate, while compliance teams enforce regulatory and franchise agreement adherence via audits and franchise oversight.
- SEC filings: 10-K annual, 10-Q quarterly
- REIT payout requirement: ≥90% taxable income (2024)
- ESG focus: energy, water, waste
- Controls: audits, franchise compliance programs
Boost NOI & RevPAR Renovation uplift 6-12%, energy 20-35%
Manage operational KPIs with third-party managers to maximize NOI and RevPAR penetration, intervening on underperformers with PIPs, capex, or management changes. Optimize portfolio via targeted acquisitions, dispositions, and reflagging to improve market mix and reduce concentration. Allocate capital across debt, equity, and JVs, pursuing refinancing to lower WACC and preserve liquidity. Deliver on-time PIPs to capture energy savings and renovation-driven RevPAR gains.
| Metric | 2024 |
|---|---|
| Renovation RevPAR uplift | ~6–12% |
| Energy savings (DOE/ENERGY STAR) | 20–35% |
| REIT payout requirement | ≥90% taxable income |
| SEC reporting | 10-K, 10-Q |
Preview Before You Purchase
Business Model Canvas
The Business Model Canvas previewed here for Summit Hotel Properties is the exact section from the final deliverable, not a mockup. After purchase you'll receive this same fully formatted, editable document in its complete form. No placeholders, no surprises—ready to use, present, and adapt.
Description
Business Model Canvas for a Hotel REIT: revenue, partners, and growth levers
Unlock Summit Hotel Properties’s strategic playbook with a concise Business Model Canvas that maps customer segments, revenue streams, partnerships, and operational levers. This three-sentence snapshot reveals how the REIT scales value and manages risk. Purchase the full, editable canvas in Word and Excel for a sector-ready template to benchmark, plan, and pitch with confidence.
Partnerships
Global hotel brands
Partnerships with Marriott, Hilton, Hyatt and similar premium select-service brands provide flagging, brand standards, loyalty access and global distribution scale; Marriott (≈8,100 properties), Hilton (≈7,300) and Hyatt (≈1,400) extend channel reach and guest trust. Brand affiliation boosts pricing power and occupancy through recognition, while franchise agreements specify fees, PIPs and performance metrics. These partnerships underpin demand generation and asset value.
Third-party hotel operators
Specialized third-party management companies run day-to-day hotel operations for Summit under management agreements, delivering labor management, guest service and local sales execution. Contracts typically include base fees around 2–4% of total revenue plus incentive fees up to ~20% of GOP tied to profitability. Strong operator alignment historically supports RevPAR gains and margin expansion.
OTAs, GDS, and travel platforms
Distribution partners like Booking and Expedia plus GDS platforms extend Summit Hotel Properties reach to leisure and unmanaged corporate travelers; OTAs typically charge average commissions around 15% (2024 industry norm) but boost occupancy in shoulder periods and provide booking and guest data that feed revenue management systems to optimize rate and channel mix.
Lenders, equity and JV partners
Relationships with banks, CMBS lenders and institutional equity provide Summit Hotel Properties with acquisition and refinancing capacity, enabling opportunistic purchases and debt resets across the portfolio.
Joint ventures allow participation in larger or specialized transactions while sharing execution risk, and flexible capital structures support portfolio optimization through maturities and covenant management; financing partners remain critical through cycles.
- Bank and CMBS lending: acquisition/refinance capacity
- Institutional equity: capital for growth
- Joint ventures: scale and risk-sharing
- Flexible capital: portfolio optimization
Vendors, contractors, and insurers
Vendors, contractors, and insurers coordinate FF&E suppliers, renovation contractors, and technology providers to ensure brand compliance and asset upkeep; 2024 industry FF&E cycles average 7–10 years with typical capex per room widely cited at roughly 4,000–7,000 USD, supporting long-term asset value.
- Insurance: property, liability, BI coverage
- Renovation: brand-compliant contractors
- Energy: utility partners reduce OPEX
- Vendor ecosystem: protects quality & resilience
Franchise brands, managers and OTAs boost distribution, pricing and capital; OTA ~15% commission
Summit’s brand franchises (Marriott ≈8,100; Hilton ≈7,300; Hyatt ≈1,400 in 2024) drive distribution, pricing power and loyalty access. Third-party managers deliver operations via fees ~2–4% revenue plus incentives up to ~20% GOP. OTAs/GDS boost occupancy despite ~15% commission (2024). Lenders, JV partners and vendors enable transactions, capex and risk-sharing.
| Partner | Key Metric (2024) |
|---|---|
| Brands | Marriott ≈8,100; Hilton ≈7,300; Hyatt ≈1,400 |
| Management | Fees 2–4% rev; incentive ≤20% GOP |
| OTAs | Commission ≈15% |
| FF&E | $4,000–7,000 per room |
What is included in the product
Detailed Word Document
A tailored Business Model Canvas for Summit Hotel Properties outlining customer segments, value propositions, channels, revenue streams, cost structure, key partners and activities across 9 blocks, with competitive analysis, SWOT-linked insights and investor-ready narrative to support strategic decisions and financing discussions.
Customizable Excel Spreadsheet
Condenses Summit Hotel Properties’ strategy into an editable one-page canvas, quickly highlighting revenue drivers, asset-management and operational pain points for faster decision-making and portfolio optimization.
Activities
Active asset management
Oversee operational KPIs, dynamic pricing, and tight cost controls with third-party managers to maximize NOI, coordinating monthly performance reviews and variance analyses. Benchmark performance against comp sets to drive RevPAR penetration and adjust strategy when market share lags. Intervene on underperformers with targeted action plans—capital improvements, marketing shifts, and management changes. Align incentives to owner-priority returns and monitor through quarterly waterfall and return metrics.
Portfolio optimization
Portfolio optimization focuses on acquiring, disposing, and reflagging assets to upgrade the quality mix and improve market exposure, recycling capital from non-core markets into higher-growth corridors. Executing targeted PIPs unlocks brand-led demand and ADR gains, while active asset rotation reduces concentration and mitigates seasonality risk through geographic diversification.
Capital allocation and financing
Summit allocates capital across debt, equity, and joint-venture structures to fund growth and renovations while managing sponsor dilution. The company pursues refinancing to lower its weighted average cost of capital and extend debt maturities. It maintains REIT compliance on qualifying income and distributions and prioritizes liquidity buffers to navigate hotel cycles and opportunistic acquisitions.
Renovation and PIP execution
Plan and deliver brand-mandated upgrades on time and budget, sequencing room-out strategies to minimize displacement and maintain occupancy; capture energy and operational efficiencies—2024 ENERGY STAR/DOE data show lighting and controls plus HVAC upgrades reduce energy 20–35%—and elevate guest satisfaction to support RevPAR and ADR growth (industry renovation lifts RevPAR ~6–12%).
- On-time, on-budget PIP delivery
- Room-out sequencing to reduce displacement
- Energy savings 20–35% (2024 DOE/ENERGY STAR)
- Renovation-driven RevPAR uplift ~6–12%
Investor relations and compliance
Investor relations and compliance provide transparent reporting and guidance to public shareholders through SEC 10-K/10-Q filings and quarterly calls; dividend policy is managed to satisfy REIT rules requiring distribution of at least 90% of taxable income (2024). ESG efforts prioritize energy, water and waste reductions material to hospitality real estate, while compliance teams enforce regulatory and franchise agreement adherence via audits and franchise oversight.
- SEC filings: 10-K annual, 10-Q quarterly
- REIT payout requirement: ≥90% taxable income (2024)
- ESG focus: energy, water, waste
- Controls: audits, franchise compliance programs
Boost NOI & RevPAR Renovation uplift 6-12%, energy 20-35%
Manage operational KPIs with third-party managers to maximize NOI and RevPAR penetration, intervening on underperformers with PIPs, capex, or management changes. Optimize portfolio via targeted acquisitions, dispositions, and reflagging to improve market mix and reduce concentration. Allocate capital across debt, equity, and JVs, pursuing refinancing to lower WACC and preserve liquidity. Deliver on-time PIPs to capture energy savings and renovation-driven RevPAR gains.
| Metric | 2024 |
|---|---|
| Renovation RevPAR uplift | ~6–12% |
| Energy savings (DOE/ENERGY STAR) | 20–35% |
| REIT payout requirement | ≥90% taxable income |
| SEC reporting | 10-K, 10-Q |
Preview Before You Purchase
Business Model Canvas
The Business Model Canvas previewed here for Summit Hotel Properties is the exact section from the final deliverable, not a mockup. After purchase you'll receive this same fully formatted, editable document in its complete form. No placeholders, no surprises—ready to use, present, and adapt.











