SIA Engineering Porter's Five Forces Analysis

Go Beyond the Preview—Access the Full Strategic Report
SIA Engineering faces moderate buyer power, concentrated airline customers, and significant supplier reliance on OEMs and skilled labor, while high regulatory barriers and capital intensity lower threat of new entrants; substitute threats are limited but technological shifts and MRO alliances raise competitive intensity. This brief snapshot only scratches the surface—unlock the full Porter's Five Forces Analysis for detailed ratings, visuals, and strategic implications to inform investment or strategy.
Suppliers Bargaining Power

OEM concentration and IP control
Aircraft and engine OEMs tightly control manuals, tooling and proprietary parts, giving them leverage over pricing, licensing and permitted workscopes for SIA Engineering; mandatory service bulletins and warranty channels can funnel work to OEM-affiliated shops. Airbus and Boeing together account for about 90% of the large commercial fleet and GE/Pratt/ RR roughly 80% of engines (2024), so SIAEC offsets this via JVs, partnerships and multi-OEM approvals.
Critical parts and lead times
Safety-critical components for SIAEC often have few qualified sources and 2024 lead times commonly range 12–26 weeks, enabling suppliers to prioritize larger OEMs and global carriers and forcing SIAEC to carry higher spare inventory and pay expedited shipping premiums. Delays extend aircraft turnaround and can trigger contract penalties; strategic stocking and pooling reduce but do not remove this exposure.

Skilled labor and certifications
Licensed engineers and specialized technicians are scarce and mobile, giving labor substantial bargaining power; rising wage pressures and certification costs further elevate this supplier strength. Attrition directly threatens schedule reliability and customer SLAs, increasing operational risk. SIA Engineering invests in training pipelines and productivity tools to retain talent and mitigate disruption.

Airport and hangar infrastructure
Access to Changi slots, hangar bays and ground equipment is finite; Changi operates three runways and Terminals 1–4 in service, concentrating demand and giving airport authorities and infrastructure providers leverage over availability and fees. Capacity constraints raise supplier bargaining power in peak periods, while long-term leases and facility upgrades by SIA Engineering partially offset this pressure.
- Finite slots: three runways
- High peak leverage
- Fees set by airport authorities
- Mitigation: long-term leases, upgrades
Digital tools and data platforms
MRO IT, diagnostics and maintenance data commonly reside on vendor or OEM-linked platforms; industry estimates in 2024 place OEM-tied data access at about 60% of major operators, creating subscription costs and limited portability. Contract terms and proprietary formats lock in fees, while integration complexity raises switching frictions and hidden migration costs. SIA Engineering Company (SIAEC) has accelerated digital initiatives in 2024 to improve interoperability and reduce supplier dependency.
- OEM data concentration ~60% (2024)
- Subscription lock-in -> higher operating costs
- Integration complexity = switching friction
- SIAEC 2024 digital push to rebalance dependency
OEMs dominate fleets and parts: long lead times, scarce technicians raise MRO costs
OEMs wield strong leverage: Airbus/Boeing ~90% fleet share and GE/Pratt/RR ~80% engine share (2024), plus OEM-controlled manuals/licensing. Critical spares lead times 12–26 weeks in 2024, raising inventory and expediting costs. Skilled technicians scarce amid rising wages; Changi capacity (three runways) and OEM-tied MRO data (~60% of operators, 2024) add switching friction.
| Metric | 2024 Value |
|---|---|
| Airframe OEM share | ~90% |
| Engine OEM share | ~80% |
| Spare lead times | 12–26 weeks |
| OEM-tied MRO data | ~60% |
| Changi runways | 3 |
What is included in the product
 Detailed Word Document
Tailored exclusively for SIA Engineering, this Porter's Five Forces analysis evaluates competitive rivalry, supplier and buyer power, threats of new entrants and substitutes, highlights disruptive forces and emerging threats to market share, and identifies barriers that protect incumbency—fully editable for integration into reports, investor materials, and strategy decks.

 Customizable Excel Spreadsheet
A concise one-sheet Porter’s Five Forces for SIA Engineering that instantly highlights supplier, buyer, and competitive pressures—perfect for quick strategic decisions. Customize force ratings, export a spider chart for decks, and copy into reports to remove analysis bottlenecks and align stakeholder actions fast.
Customers Bargaining Power

Airline consolidation and scale
Global carriers and alliances—Star Alliance (26 members), oneworld (13) and SkyTeam (16) as of 2024—aggregate volumes and negotiate aggressively, leveraging members' large fleets to bundle multi-year line and base maintenance for discounts. Large carriers trade volume commitments against price and tight performance clauses. SIA Engineering must demonstrate superior reliability and KPIs to defend margins under these contract pressures.
Price sensitivity and cyclical demand
Airlines operate on single-digit margins and aggressively push cost-downs, especially in downturns; IATA reported 2023 passenger demand at about 95% of 2019 levels, keeping buyer leverage high. Capacity tightness in recoveries tempers but does not erase buyer power. PBH and fixed-rate contracts limit upside in inflationary periods, while flexible pricing tied to turnaround time can better align incentives.

Switching costs and approvals
Regulatory approvals, induction learning curves and ferry costs create tangible switching frictions for airlines contracting SIA Engineering Company, yet heavy-check work is still frequently put to competitive tender; buyers focus on total cost of ownership — parts, downtime and logistics — not just labor rates. Consistently strong on-time performance increases customer stickiness and raises the effective cost of switching.

Service breadth and convenience
Customers prize SIAEC’s end-to-end MRO, line maintenance at Changi and component pooling because one-stop solutions cut coordination risk and AOG exposure, increasing switching costs for carriers.
SIAEC’s Changi hub and JV network raise buyer dependence by concentrating capabilities and turnaround efficiency, though gaps in engine or component depth can weaken this edge and invite specialist suppliers.
- Service breadth raises switching costs
- One-stop reduces AOG/coordination risk
- Changi hub + JVs increase dependence
- Engine/component gaps erode advantage
Contractual penalties and SLAs
Airlines embed turnaround, defect rectification and reliability KPIs in SLAs; 2024 industry surveys show about 60% of MRO contracts include explicit performance penalties, shifting measurable financial risk to providers. Penalties and credits—often 2–5% per incident—push bargaining power to buyers, forcing SIAEC to deploy transparent analytics and predictive planning to protect margins while leveraging its long operational track record.
- KPIs: turnaround, defects, reliability
- Penalties: 2–5% per incident (2024 data)
- Mitigation: analytics + predictive planning
- Leverage: SIAEC long operational track record
Alliances concentrate volume; demand at ~95% keeps buyer leverage high
Global alliances (Star 26, oneworld 13, SkyTeam 16 in 2024) concentrate volume and push multi-year discounts; airlines at ~95% of 2019 demand (IATA 2023) keep buyer leverage high. ~60% of MRO contracts include 2–5% performance penalties, raising switching costs for one-stop hubs like SIAEC Changi but inviting specialist bids where engine/component gaps exist.
| Metric | 2024 Value |
|---|---|
| Alliances (members) | 26/13/16 |
| IATA demand vs 2019 | ~95% |
| Contracts w/ penalties | ~60% |
| Penalty size | 2–5% |
Same Document Delivered
SIA Engineering Porter's Five Forces Analysis
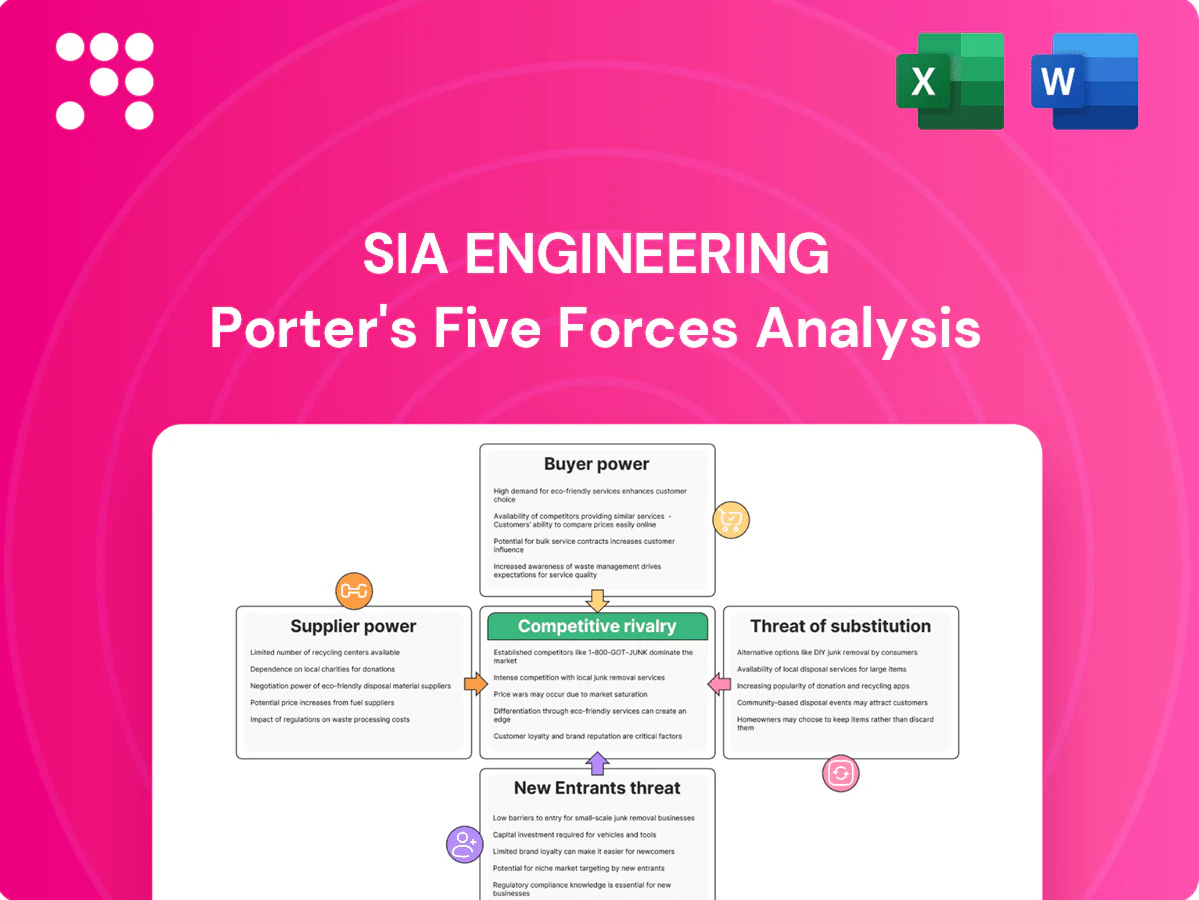
This preview shows the exact SIA Engineering Porter's Five Forces Analysis you will receive after purchase—no placeholders or samples. The file is fully formatted, comprehensive and ready for immediate download and use. It covers supplier power, buyer power, competitive rivalry, threat of substitutes and barriers to entry tailored to SIA Engineering. What you see here is the final deliverable available instantly after payment.

Go Beyond the Preview—Access the Full Strategic Report
SIA Engineering faces moderate buyer power, concentrated airline customers, and significant supplier reliance on OEMs and skilled labor, while high regulatory barriers and capital intensity lower threat of new entrants; substitute threats are limited but technological shifts and MRO alliances raise competitive intensity. This brief snapshot only scratches the surface—unlock the full Porter's Five Forces Analysis for detailed ratings, visuals, and strategic implications to inform investment or strategy.
Suppliers Bargaining Power
OEM concentration and IP control
Aircraft and engine OEMs tightly control manuals, tooling and proprietary parts, giving them leverage over pricing, licensing and permitted workscopes for SIA Engineering; mandatory service bulletins and warranty channels can funnel work to OEM-affiliated shops. Airbus and Boeing together account for about 90% of the large commercial fleet and GE/Pratt/ RR roughly 80% of engines (2024), so SIAEC offsets this via JVs, partnerships and multi-OEM approvals.
Critical parts and lead times
Safety-critical components for SIAEC often have few qualified sources and 2024 lead times commonly range 12–26 weeks, enabling suppliers to prioritize larger OEMs and global carriers and forcing SIAEC to carry higher spare inventory and pay expedited shipping premiums. Delays extend aircraft turnaround and can trigger contract penalties; strategic stocking and pooling reduce but do not remove this exposure.
Skilled labor and certifications
Licensed engineers and specialized technicians are scarce and mobile, giving labor substantial bargaining power; rising wage pressures and certification costs further elevate this supplier strength. Attrition directly threatens schedule reliability and customer SLAs, increasing operational risk. SIA Engineering invests in training pipelines and productivity tools to retain talent and mitigate disruption.
Airport and hangar infrastructure
Access to Changi slots, hangar bays and ground equipment is finite; Changi operates three runways and Terminals 1–4 in service, concentrating demand and giving airport authorities and infrastructure providers leverage over availability and fees. Capacity constraints raise supplier bargaining power in peak periods, while long-term leases and facility upgrades by SIA Engineering partially offset this pressure.
- Finite slots: three runways
- High peak leverage
- Fees set by airport authorities
- Mitigation: long-term leases, upgrades
Digital tools and data platforms
MRO IT, diagnostics and maintenance data commonly reside on vendor or OEM-linked platforms; industry estimates in 2024 place OEM-tied data access at about 60% of major operators, creating subscription costs and limited portability. Contract terms and proprietary formats lock in fees, while integration complexity raises switching frictions and hidden migration costs. SIA Engineering Company (SIAEC) has accelerated digital initiatives in 2024 to improve interoperability and reduce supplier dependency.
- OEM data concentration ~60% (2024)
- Subscription lock-in -> higher operating costs
- Integration complexity = switching friction
- SIAEC 2024 digital push to rebalance dependency
OEMs dominate fleets and parts: long lead times, scarce technicians raise MRO costs
OEMs wield strong leverage: Airbus/Boeing ~90% fleet share and GE/Pratt/RR ~80% engine share (2024), plus OEM-controlled manuals/licensing. Critical spares lead times 12–26 weeks in 2024, raising inventory and expediting costs. Skilled technicians scarce amid rising wages; Changi capacity (three runways) and OEM-tied MRO data (~60% of operators, 2024) add switching friction.
| Metric | 2024 Value |
|---|---|
| Airframe OEM share | ~90% |
| Engine OEM share | ~80% |
| Spare lead times | 12–26 weeks |
| OEM-tied MRO data | ~60% |
| Changi runways | 3 |
What is included in the product
Detailed Word Document
Tailored exclusively for SIA Engineering, this Porter's Five Forces analysis evaluates competitive rivalry, supplier and buyer power, threats of new entrants and substitutes, highlights disruptive forces and emerging threats to market share, and identifies barriers that protect incumbency—fully editable for integration into reports, investor materials, and strategy decks.
Customizable Excel Spreadsheet
A concise one-sheet Porter’s Five Forces for SIA Engineering that instantly highlights supplier, buyer, and competitive pressures—perfect for quick strategic decisions. Customize force ratings, export a spider chart for decks, and copy into reports to remove analysis bottlenecks and align stakeholder actions fast.
Customers Bargaining Power
Airline consolidation and scale
Global carriers and alliances—Star Alliance (26 members), oneworld (13) and SkyTeam (16) as of 2024—aggregate volumes and negotiate aggressively, leveraging members' large fleets to bundle multi-year line and base maintenance for discounts. Large carriers trade volume commitments against price and tight performance clauses. SIA Engineering must demonstrate superior reliability and KPIs to defend margins under these contract pressures.
Price sensitivity and cyclical demand
Airlines operate on single-digit margins and aggressively push cost-downs, especially in downturns; IATA reported 2023 passenger demand at about 95% of 2019 levels, keeping buyer leverage high. Capacity tightness in recoveries tempers but does not erase buyer power. PBH and fixed-rate contracts limit upside in inflationary periods, while flexible pricing tied to turnaround time can better align incentives.
Switching costs and approvals
Regulatory approvals, induction learning curves and ferry costs create tangible switching frictions for airlines contracting SIA Engineering Company, yet heavy-check work is still frequently put to competitive tender; buyers focus on total cost of ownership — parts, downtime and logistics — not just labor rates. Consistently strong on-time performance increases customer stickiness and raises the effective cost of switching.
Service breadth and convenience
Customers prize SIAEC’s end-to-end MRO, line maintenance at Changi and component pooling because one-stop solutions cut coordination risk and AOG exposure, increasing switching costs for carriers.
SIAEC’s Changi hub and JV network raise buyer dependence by concentrating capabilities and turnaround efficiency, though gaps in engine or component depth can weaken this edge and invite specialist suppliers.
- Service breadth raises switching costs
- One-stop reduces AOG/coordination risk
- Changi hub + JVs increase dependence
- Engine/component gaps erode advantage
Contractual penalties and SLAs
Airlines embed turnaround, defect rectification and reliability KPIs in SLAs; 2024 industry surveys show about 60% of MRO contracts include explicit performance penalties, shifting measurable financial risk to providers. Penalties and credits—often 2–5% per incident—push bargaining power to buyers, forcing SIAEC to deploy transparent analytics and predictive planning to protect margins while leveraging its long operational track record.
- KPIs: turnaround, defects, reliability
- Penalties: 2–5% per incident (2024 data)
- Mitigation: analytics + predictive planning
- Leverage: SIAEC long operational track record
Alliances concentrate volume; demand at ~95% keeps buyer leverage high
Global alliances (Star 26, oneworld 13, SkyTeam 16 in 2024) concentrate volume and push multi-year discounts; airlines at ~95% of 2019 demand (IATA 2023) keep buyer leverage high. ~60% of MRO contracts include 2–5% performance penalties, raising switching costs for one-stop hubs like SIAEC Changi but inviting specialist bids where engine/component gaps exist.
| Metric | 2024 Value |
|---|---|
| Alliances (members) | 26/13/16 |
| IATA demand vs 2019 | ~95% |
| Contracts w/ penalties | ~60% |
| Penalty size | 2–5% |
Same Document Delivered
SIA Engineering Porter's Five Forces Analysis
This preview shows the exact SIA Engineering Porter's Five Forces Analysis you will receive after purchase—no placeholders or samples. The file is fully formatted, comprehensive and ready for immediate download and use. It covers supplier power, buyer power, competitive rivalry, threat of substitutes and barriers to entry tailored to SIA Engineering. What you see here is the final deliverable available instantly after payment.
Original: $10.00
-65%$10.00
$3.50Description
Go Beyond the Preview—Access the Full Strategic Report
SIA Engineering faces moderate buyer power, concentrated airline customers, and significant supplier reliance on OEMs and skilled labor, while high regulatory barriers and capital intensity lower threat of new entrants; substitute threats are limited but technological shifts and MRO alliances raise competitive intensity. This brief snapshot only scratches the surface—unlock the full Porter's Five Forces Analysis for detailed ratings, visuals, and strategic implications to inform investment or strategy.
Suppliers Bargaining Power
OEM concentration and IP control
Aircraft and engine OEMs tightly control manuals, tooling and proprietary parts, giving them leverage over pricing, licensing and permitted workscopes for SIA Engineering; mandatory service bulletins and warranty channels can funnel work to OEM-affiliated shops. Airbus and Boeing together account for about 90% of the large commercial fleet and GE/Pratt/ RR roughly 80% of engines (2024), so SIAEC offsets this via JVs, partnerships and multi-OEM approvals.
Critical parts and lead times
Safety-critical components for SIAEC often have few qualified sources and 2024 lead times commonly range 12–26 weeks, enabling suppliers to prioritize larger OEMs and global carriers and forcing SIAEC to carry higher spare inventory and pay expedited shipping premiums. Delays extend aircraft turnaround and can trigger contract penalties; strategic stocking and pooling reduce but do not remove this exposure.
Skilled labor and certifications
Licensed engineers and specialized technicians are scarce and mobile, giving labor substantial bargaining power; rising wage pressures and certification costs further elevate this supplier strength. Attrition directly threatens schedule reliability and customer SLAs, increasing operational risk. SIA Engineering invests in training pipelines and productivity tools to retain talent and mitigate disruption.
Airport and hangar infrastructure
Access to Changi slots, hangar bays and ground equipment is finite; Changi operates three runways and Terminals 1–4 in service, concentrating demand and giving airport authorities and infrastructure providers leverage over availability and fees. Capacity constraints raise supplier bargaining power in peak periods, while long-term leases and facility upgrades by SIA Engineering partially offset this pressure.
- Finite slots: three runways
- High peak leverage
- Fees set by airport authorities
- Mitigation: long-term leases, upgrades
Digital tools and data platforms
MRO IT, diagnostics and maintenance data commonly reside on vendor or OEM-linked platforms; industry estimates in 2024 place OEM-tied data access at about 60% of major operators, creating subscription costs and limited portability. Contract terms and proprietary formats lock in fees, while integration complexity raises switching frictions and hidden migration costs. SIA Engineering Company (SIAEC) has accelerated digital initiatives in 2024 to improve interoperability and reduce supplier dependency.
- OEM data concentration ~60% (2024)
- Subscription lock-in -> higher operating costs
- Integration complexity = switching friction
- SIAEC 2024 digital push to rebalance dependency
OEMs dominate fleets and parts: long lead times, scarce technicians raise MRO costs
OEMs wield strong leverage: Airbus/Boeing ~90% fleet share and GE/Pratt/RR ~80% engine share (2024), plus OEM-controlled manuals/licensing. Critical spares lead times 12–26 weeks in 2024, raising inventory and expediting costs. Skilled technicians scarce amid rising wages; Changi capacity (three runways) and OEM-tied MRO data (~60% of operators, 2024) add switching friction.
| Metric | 2024 Value |
|---|---|
| Airframe OEM share | ~90% |
| Engine OEM share | ~80% |
| Spare lead times | 12–26 weeks |
| OEM-tied MRO data | ~60% |
| Changi runways | 3 |
What is included in the product
Detailed Word Document
Tailored exclusively for SIA Engineering, this Porter's Five Forces analysis evaluates competitive rivalry, supplier and buyer power, threats of new entrants and substitutes, highlights disruptive forces and emerging threats to market share, and identifies barriers that protect incumbency—fully editable for integration into reports, investor materials, and strategy decks.
Customizable Excel Spreadsheet
A concise one-sheet Porter’s Five Forces for SIA Engineering that instantly highlights supplier, buyer, and competitive pressures—perfect for quick strategic decisions. Customize force ratings, export a spider chart for decks, and copy into reports to remove analysis bottlenecks and align stakeholder actions fast.
Customers Bargaining Power
Airline consolidation and scale
Global carriers and alliances—Star Alliance (26 members), oneworld (13) and SkyTeam (16) as of 2024—aggregate volumes and negotiate aggressively, leveraging members' large fleets to bundle multi-year line and base maintenance for discounts. Large carriers trade volume commitments against price and tight performance clauses. SIA Engineering must demonstrate superior reliability and KPIs to defend margins under these contract pressures.
Price sensitivity and cyclical demand
Airlines operate on single-digit margins and aggressively push cost-downs, especially in downturns; IATA reported 2023 passenger demand at about 95% of 2019 levels, keeping buyer leverage high. Capacity tightness in recoveries tempers but does not erase buyer power. PBH and fixed-rate contracts limit upside in inflationary periods, while flexible pricing tied to turnaround time can better align incentives.
Switching costs and approvals
Regulatory approvals, induction learning curves and ferry costs create tangible switching frictions for airlines contracting SIA Engineering Company, yet heavy-check work is still frequently put to competitive tender; buyers focus on total cost of ownership — parts, downtime and logistics — not just labor rates. Consistently strong on-time performance increases customer stickiness and raises the effective cost of switching.
Service breadth and convenience
Customers prize SIAEC’s end-to-end MRO, line maintenance at Changi and component pooling because one-stop solutions cut coordination risk and AOG exposure, increasing switching costs for carriers.
SIAEC’s Changi hub and JV network raise buyer dependence by concentrating capabilities and turnaround efficiency, though gaps in engine or component depth can weaken this edge and invite specialist suppliers.
- Service breadth raises switching costs
- One-stop reduces AOG/coordination risk
- Changi hub + JVs increase dependence
- Engine/component gaps erode advantage
Contractual penalties and SLAs
Airlines embed turnaround, defect rectification and reliability KPIs in SLAs; 2024 industry surveys show about 60% of MRO contracts include explicit performance penalties, shifting measurable financial risk to providers. Penalties and credits—often 2–5% per incident—push bargaining power to buyers, forcing SIAEC to deploy transparent analytics and predictive planning to protect margins while leveraging its long operational track record.
- KPIs: turnaround, defects, reliability
- Penalties: 2–5% per incident (2024 data)
- Mitigation: analytics + predictive planning
- Leverage: SIAEC long operational track record
Alliances concentrate volume; demand at ~95% keeps buyer leverage high
Global alliances (Star 26, oneworld 13, SkyTeam 16 in 2024) concentrate volume and push multi-year discounts; airlines at ~95% of 2019 demand (IATA 2023) keep buyer leverage high. ~60% of MRO contracts include 2–5% performance penalties, raising switching costs for one-stop hubs like SIAEC Changi but inviting specialist bids where engine/component gaps exist.
| Metric | 2024 Value |
|---|---|
| Alliances (members) | 26/13/16 |
| IATA demand vs 2019 | ~95% |
| Contracts w/ penalties | ~60% |
| Penalty size | 2–5% |
Same Document Delivered
SIA Engineering Porter's Five Forces Analysis
This preview shows the exact SIA Engineering Porter's Five Forces Analysis you will receive after purchase—no placeholders or samples. The file is fully formatted, comprehensive and ready for immediate download and use. It covers supplier power, buyer power, competitive rivalry, threat of substitutes and barriers to entry tailored to SIA Engineering. What you see here is the final deliverable available instantly after payment.











