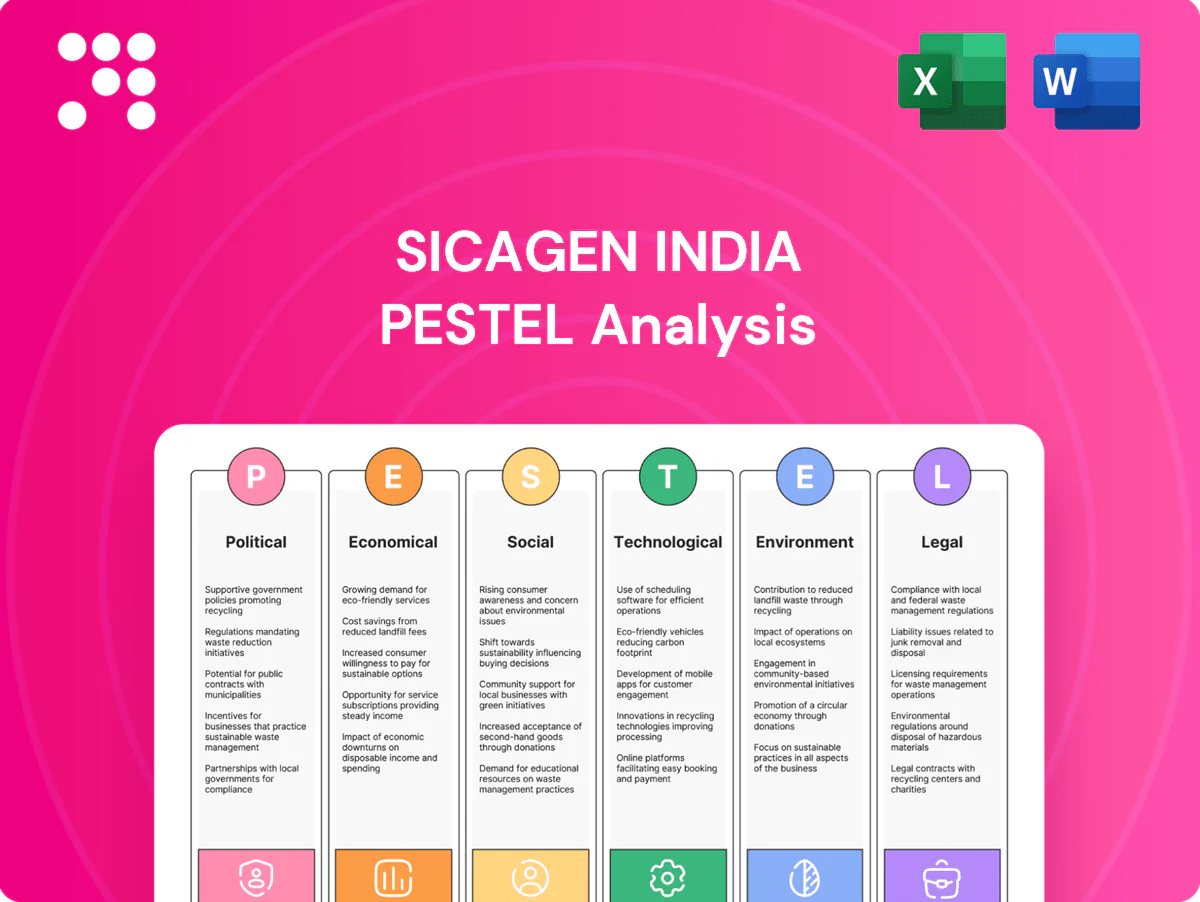
Sicagen India PESTLE Analysis

Your Competitive Advantage Starts with This Report
Unlock strategic clarity with our PESTLE Analysis of Sicagen India—three concise sections reveal how political shifts, economic trends, and regulatory changes will shape growth. Ideal for investors and strategists seeking actionable context. Purchase the full report to get the complete, editable intelligence instantly.
Political factors

Infrastructure push
Government initiatives like Gati Shakti and the National Infrastructure Pipeline (NIP) — sized at about INR 111 lakh crore — sustain multi-year demand for pipes, fittings and scaffolding, supporting Sicagen’s order book. Public capex (centre capex >INR 10 lakh crore in recent budgets) directly influences order flows and payment cycles. Aligning with PSU and EPC procurement norms can secure long-tenor contracts and stable receivables. Monitoring state-level tenders helps balance regional exposure and mitigate concentration risk.
Trade policy shifts
Import duties and anti-dumping measures (duties up to 25% on targeted steel/polymer lines) and expanded BIS mandatory quality orders increase input and compliance costs for Sicagen; Make in India incentives and PLI schemes (total announced ~INR 1.97 lakh crore across sectors) shift sourcing toward local suppliers; fast-changing customs rules affect project-cargo timelines; supplier diversification mitigates geopolitical and tariff shocks.

Regulatory federalism
Regulatory federalism across India s 28 states and 8 union territories creates significant compliance complexity for Sicagen, with state-by-state building codes and procurement norms increasing touchpoints. Local approvals and logistics permits often add weeks to delivery schedules; political stability in key states influences project continuity, and proactive stakeholder engagement measurably reduces bottlenecks.

Public procurement dynamics
Public procurement rules favoring domestic content boost opportunities for Sicagen through local JV and manufacturing tie-ups, while e-auctions and reverse bidding on platforms like GeM squeeze distributor margins; government and PSU payment cycles often strain working capital, making strict contract management essential to avoid liquidated damages.
- Preference policies: leverage local partnerships
- E-auctions/reverse bidding: margin pressure
- Payment terms: working capital impact
- Contract management: avoid LD risks
Logistics policy
National Logistics Policy and PM GatiShakti's multimodal corridors (Rs 100 lakh crore integrated plan) can lower Sicagen's freight costs from India's current logistics burden of ~13-14% of GDP (2023) by shortening transit times; port modernization—major ports handled ~760 million tonnes (FY23)—improves project cargo efficiency; tighter road-safety enforcement raises fleet compliance costs, while policy incentives enable network optimization.
- Logistics cost: ~13-14% of GDP (2023)
- PM GatiShakti: Rs 100 lakh crore plan
- Major ports throughput: ~760 MT (FY23)
- Road-safety regs increase compliance costs
INR 111L-cr NIP and >INR 10L-cr central capex spur multi-year infra demand
Government NIP (~INR 111 lakh crore) and GatiShakti drive multi-year pipe/scaffold demand; central capex >INR 10 lakh crore sustains orders and affects payment cycles. Import duties/anti-dumping (up to 25%) and BIS rules raise input costs; Make in India/PLI (~INR 1.97 lakh crore) favor local sourcing. PM GatiShakti/logistics reforms aim to cut logistics burden (~13-14% of GDP) and improve port throughput (~760 MT FY23).
| Factor | Key metric |
|---|---|
| NIP | INR 111 lakh crore |
| Central capex | >INR 10 lakh crore |
| Import duties | Up to 25% |
| PLI | INR 1.97 lakh crore |
| Logistics cost | 13-14% of GDP |
| Port throughput | ~760 MT (FY23) |
What is included in the product
 Detailed Word Document
Explores how Political, Economic, Social, Technological, Environmental and Legal forces uniquely impact Sicagen India, with data-backed trends and industry-specific examples to highlight risks and opportunities. Designed for executives and investors to support scenario planning, strategy and funding decisions.

 Customizable Excel Spreadsheet
A concise, visually segmented PESTLE summary of Sicagen India that simplifies external risk assessment and market positioning, easily droppable into presentations, editable for local context, and shareable for quick cross‑team alignment.
Economic factors

Construction cycle
Sicagen’s volumes track macro growth—India GDP ~7% in FY24—while housing demand and industrial capex remain primary drivers; cement consumption rose about 6% to ~380 MT in FY24 and steel consumption increased ~5% (apparent ~115 MT), making them leading indicators. Real estate or infrastructure slowdowns typically elongate receivables and working-capital cycles. Diversification across housing, infra and industrial end-markets smooths volume volatility.
Commodity volatility
Steel, copper and PVC price swings—which in 2024–25 showed volatility of roughly 15–20% across regional benchmarks— materially affect Sicagen India’s inventory valuation and customer pricing. Frequent repricing clauses in distribution contracts protect gross margins by allowing index-linked adjustments. Active hedging programs and vendor-aligned pass-throughs further reduce exposure, while lean inventory and disciplined S&OP limit write-downs and working capital strain.

Interest and liquidity
Rate movements, with the RBI policy repo at 6.50% in mid-2024, directly curb housing starts and raise working-capital costs for builders and dealers, compressing margins. Tight credit elevates receivable risk among MSME customers, who account for roughly 30% of India’s GDP, increasing default likelihood. Optimizing the cash-conversion cycle preserves ROCE, while supply-chain finance and invoice-discounting (growing in India) can sustain sales without overextending credit.

FX and import mix
Foreign exchange volatility raises costs for Sicagen's imported components and project cargo, with USD/INR averaging about 83.0 in H1 2025 (RBI), pressuring margins when imports are dollar-priced. Natural hedges from export-linked customers are limited for a primarily domestic distribution network, so company exposure remains concentrated. Use of forward covers and currency-pass-through clauses has stabilized procurement costs in 2024–25, while progressive localization of suppliers is reducing FX risk over time.
Freight and fuel
- Diesel share ~30-35% of road transport cost
- Seasonal/monsoon yield swings 15-20%
- Rail/coastal cost savings ~30-50% for bulk
- Telematics lowers empty miles up to 20%
INR 111L-cr NIP and >INR 10L-cr central capex spur multi-year infra demand
Sicagen volumes track India GDP ~7% (FY24); cement consumption ~380 MT (+6%) and apparent steel ~115 MT (+5%) drive demand. RBI repo 6.50% (mid‑2024) raises working‑capital costs; USD/INR ~83.0 (H1 2025) and diesel share ~30–35% of road cost compress margins. Diversification, index‑linked pricing, forward covers and localization mitigate risks.
| Metric | Value |
|---|---|
| India GDP (FY24) | ~7% |
| Cement cons. (FY24) | ~380 MT (+6%) |
| Apparent steel (FY24) | ~115 MT (+5%) |
| RBI repo | 6.50% (mid‑2024) |
| USD/INR | ~83.0 (H1 2025) |
| Diesel share | 30–35% |
Preview Before You Purchase
Sicagen India PESTLE Analysis
The preview shown here is the exact Sicagen India PESTLE Analysis you’ll receive after purchase—fully formatted and ready to use. The content, layout, and insights visible are the final version with no placeholders. After checkout you’ll download this same professionally structured file instantly.

Your Competitive Advantage Starts with This Report
Unlock strategic clarity with our PESTLE Analysis of Sicagen India—three concise sections reveal how political shifts, economic trends, and regulatory changes will shape growth. Ideal for investors and strategists seeking actionable context. Purchase the full report to get the complete, editable intelligence instantly.
Political factors
Infrastructure push
Government initiatives like Gati Shakti and the National Infrastructure Pipeline (NIP) — sized at about INR 111 lakh crore — sustain multi-year demand for pipes, fittings and scaffolding, supporting Sicagen’s order book. Public capex (centre capex >INR 10 lakh crore in recent budgets) directly influences order flows and payment cycles. Aligning with PSU and EPC procurement norms can secure long-tenor contracts and stable receivables. Monitoring state-level tenders helps balance regional exposure and mitigate concentration risk.
Trade policy shifts
Import duties and anti-dumping measures (duties up to 25% on targeted steel/polymer lines) and expanded BIS mandatory quality orders increase input and compliance costs for Sicagen; Make in India incentives and PLI schemes (total announced ~INR 1.97 lakh crore across sectors) shift sourcing toward local suppliers; fast-changing customs rules affect project-cargo timelines; supplier diversification mitigates geopolitical and tariff shocks.
Regulatory federalism
Regulatory federalism across India s 28 states and 8 union territories creates significant compliance complexity for Sicagen, with state-by-state building codes and procurement norms increasing touchpoints. Local approvals and logistics permits often add weeks to delivery schedules; political stability in key states influences project continuity, and proactive stakeholder engagement measurably reduces bottlenecks.
Public procurement dynamics
Public procurement rules favoring domestic content boost opportunities for Sicagen through local JV and manufacturing tie-ups, while e-auctions and reverse bidding on platforms like GeM squeeze distributor margins; government and PSU payment cycles often strain working capital, making strict contract management essential to avoid liquidated damages.
- Preference policies: leverage local partnerships
- E-auctions/reverse bidding: margin pressure
- Payment terms: working capital impact
- Contract management: avoid LD risks
Logistics policy
National Logistics Policy and PM GatiShakti's multimodal corridors (Rs 100 lakh crore integrated plan) can lower Sicagen's freight costs from India's current logistics burden of ~13-14% of GDP (2023) by shortening transit times; port modernization—major ports handled ~760 million tonnes (FY23)—improves project cargo efficiency; tighter road-safety enforcement raises fleet compliance costs, while policy incentives enable network optimization.
- Logistics cost: ~13-14% of GDP (2023)
- PM GatiShakti: Rs 100 lakh crore plan
- Major ports throughput: ~760 MT (FY23)
- Road-safety regs increase compliance costs
INR 111L-cr NIP and >INR 10L-cr central capex spur multi-year infra demand
Government NIP (~INR 111 lakh crore) and GatiShakti drive multi-year pipe/scaffold demand; central capex >INR 10 lakh crore sustains orders and affects payment cycles. Import duties/anti-dumping (up to 25%) and BIS rules raise input costs; Make in India/PLI (~INR 1.97 lakh crore) favor local sourcing. PM GatiShakti/logistics reforms aim to cut logistics burden (~13-14% of GDP) and improve port throughput (~760 MT FY23).
| Factor | Key metric |
|---|---|
| NIP | INR 111 lakh crore |
| Central capex | >INR 10 lakh crore |
| Import duties | Up to 25% |
| PLI | INR 1.97 lakh crore |
| Logistics cost | 13-14% of GDP |
| Port throughput | ~760 MT (FY23) |
What is included in the product
Detailed Word Document
Explores how Political, Economic, Social, Technological, Environmental and Legal forces uniquely impact Sicagen India, with data-backed trends and industry-specific examples to highlight risks and opportunities. Designed for executives and investors to support scenario planning, strategy and funding decisions.
Customizable Excel Spreadsheet
A concise, visually segmented PESTLE summary of Sicagen India that simplifies external risk assessment and market positioning, easily droppable into presentations, editable for local context, and shareable for quick cross‑team alignment.
Economic factors
Construction cycle
Sicagen’s volumes track macro growth—India GDP ~7% in FY24—while housing demand and industrial capex remain primary drivers; cement consumption rose about 6% to ~380 MT in FY24 and steel consumption increased ~5% (apparent ~115 MT), making them leading indicators. Real estate or infrastructure slowdowns typically elongate receivables and working-capital cycles. Diversification across housing, infra and industrial end-markets smooths volume volatility.
Commodity volatility
Steel, copper and PVC price swings—which in 2024–25 showed volatility of roughly 15–20% across regional benchmarks— materially affect Sicagen India’s inventory valuation and customer pricing. Frequent repricing clauses in distribution contracts protect gross margins by allowing index-linked adjustments. Active hedging programs and vendor-aligned pass-throughs further reduce exposure, while lean inventory and disciplined S&OP limit write-downs and working capital strain.
Interest and liquidity
Rate movements, with the RBI policy repo at 6.50% in mid-2024, directly curb housing starts and raise working-capital costs for builders and dealers, compressing margins. Tight credit elevates receivable risk among MSME customers, who account for roughly 30% of India’s GDP, increasing default likelihood. Optimizing the cash-conversion cycle preserves ROCE, while supply-chain finance and invoice-discounting (growing in India) can sustain sales without overextending credit.
FX and import mix
Foreign exchange volatility raises costs for Sicagen's imported components and project cargo, with USD/INR averaging about 83.0 in H1 2025 (RBI), pressuring margins when imports are dollar-priced. Natural hedges from export-linked customers are limited for a primarily domestic distribution network, so company exposure remains concentrated. Use of forward covers and currency-pass-through clauses has stabilized procurement costs in 2024–25, while progressive localization of suppliers is reducing FX risk over time.
Freight and fuel
- Diesel share ~30-35% of road transport cost
- Seasonal/monsoon yield swings 15-20%
- Rail/coastal cost savings ~30-50% for bulk
- Telematics lowers empty miles up to 20%
INR 111L-cr NIP and >INR 10L-cr central capex spur multi-year infra demand
Sicagen volumes track India GDP ~7% (FY24); cement consumption ~380 MT (+6%) and apparent steel ~115 MT (+5%) drive demand. RBI repo 6.50% (mid‑2024) raises working‑capital costs; USD/INR ~83.0 (H1 2025) and diesel share ~30–35% of road cost compress margins. Diversification, index‑linked pricing, forward covers and localization mitigate risks.
| Metric | Value |
|---|---|
| India GDP (FY24) | ~7% |
| Cement cons. (FY24) | ~380 MT (+6%) |
| Apparent steel (FY24) | ~115 MT (+5%) |
| RBI repo | 6.50% (mid‑2024) |
| USD/INR | ~83.0 (H1 2025) |
| Diesel share | 30–35% |
Preview Before You Purchase
Sicagen India PESTLE Analysis
The preview shown here is the exact Sicagen India PESTLE Analysis you’ll receive after purchase—fully formatted and ready to use. The content, layout, and insights visible are the final version with no placeholders. After checkout you’ll download this same professionally structured file instantly.
Description
Your Competitive Advantage Starts with This Report
Unlock strategic clarity with our PESTLE Analysis of Sicagen India—three concise sections reveal how political shifts, economic trends, and regulatory changes will shape growth. Ideal for investors and strategists seeking actionable context. Purchase the full report to get the complete, editable intelligence instantly.
Political factors
Infrastructure push
Government initiatives like Gati Shakti and the National Infrastructure Pipeline (NIP) — sized at about INR 111 lakh crore — sustain multi-year demand for pipes, fittings and scaffolding, supporting Sicagen’s order book. Public capex (centre capex >INR 10 lakh crore in recent budgets) directly influences order flows and payment cycles. Aligning with PSU and EPC procurement norms can secure long-tenor contracts and stable receivables. Monitoring state-level tenders helps balance regional exposure and mitigate concentration risk.
Trade policy shifts
Import duties and anti-dumping measures (duties up to 25% on targeted steel/polymer lines) and expanded BIS mandatory quality orders increase input and compliance costs for Sicagen; Make in India incentives and PLI schemes (total announced ~INR 1.97 lakh crore across sectors) shift sourcing toward local suppliers; fast-changing customs rules affect project-cargo timelines; supplier diversification mitigates geopolitical and tariff shocks.
Regulatory federalism
Regulatory federalism across India s 28 states and 8 union territories creates significant compliance complexity for Sicagen, with state-by-state building codes and procurement norms increasing touchpoints. Local approvals and logistics permits often add weeks to delivery schedules; political stability in key states influences project continuity, and proactive stakeholder engagement measurably reduces bottlenecks.
Public procurement dynamics
Public procurement rules favoring domestic content boost opportunities for Sicagen through local JV and manufacturing tie-ups, while e-auctions and reverse bidding on platforms like GeM squeeze distributor margins; government and PSU payment cycles often strain working capital, making strict contract management essential to avoid liquidated damages.
- Preference policies: leverage local partnerships
- E-auctions/reverse bidding: margin pressure
- Payment terms: working capital impact
- Contract management: avoid LD risks
Logistics policy
National Logistics Policy and PM GatiShakti's multimodal corridors (Rs 100 lakh crore integrated plan) can lower Sicagen's freight costs from India's current logistics burden of ~13-14% of GDP (2023) by shortening transit times; port modernization—major ports handled ~760 million tonnes (FY23)—improves project cargo efficiency; tighter road-safety enforcement raises fleet compliance costs, while policy incentives enable network optimization.
- Logistics cost: ~13-14% of GDP (2023)
- PM GatiShakti: Rs 100 lakh crore plan
- Major ports throughput: ~760 MT (FY23)
- Road-safety regs increase compliance costs
INR 111L-cr NIP and >INR 10L-cr central capex spur multi-year infra demand
Government NIP (~INR 111 lakh crore) and GatiShakti drive multi-year pipe/scaffold demand; central capex >INR 10 lakh crore sustains orders and affects payment cycles. Import duties/anti-dumping (up to 25%) and BIS rules raise input costs; Make in India/PLI (~INR 1.97 lakh crore) favor local sourcing. PM GatiShakti/logistics reforms aim to cut logistics burden (~13-14% of GDP) and improve port throughput (~760 MT FY23).
| Factor | Key metric |
|---|---|
| NIP | INR 111 lakh crore |
| Central capex | >INR 10 lakh crore |
| Import duties | Up to 25% |
| PLI | INR 1.97 lakh crore |
| Logistics cost | 13-14% of GDP |
| Port throughput | ~760 MT (FY23) |
What is included in the product
Detailed Word Document
Explores how Political, Economic, Social, Technological, Environmental and Legal forces uniquely impact Sicagen India, with data-backed trends and industry-specific examples to highlight risks and opportunities. Designed for executives and investors to support scenario planning, strategy and funding decisions.
Customizable Excel Spreadsheet
A concise, visually segmented PESTLE summary of Sicagen India that simplifies external risk assessment and market positioning, easily droppable into presentations, editable for local context, and shareable for quick cross‑team alignment.
Economic factors
Construction cycle
Sicagen’s volumes track macro growth—India GDP ~7% in FY24—while housing demand and industrial capex remain primary drivers; cement consumption rose about 6% to ~380 MT in FY24 and steel consumption increased ~5% (apparent ~115 MT), making them leading indicators. Real estate or infrastructure slowdowns typically elongate receivables and working-capital cycles. Diversification across housing, infra and industrial end-markets smooths volume volatility.
Commodity volatility
Steel, copper and PVC price swings—which in 2024–25 showed volatility of roughly 15–20% across regional benchmarks— materially affect Sicagen India’s inventory valuation and customer pricing. Frequent repricing clauses in distribution contracts protect gross margins by allowing index-linked adjustments. Active hedging programs and vendor-aligned pass-throughs further reduce exposure, while lean inventory and disciplined S&OP limit write-downs and working capital strain.
Interest and liquidity
Rate movements, with the RBI policy repo at 6.50% in mid-2024, directly curb housing starts and raise working-capital costs for builders and dealers, compressing margins. Tight credit elevates receivable risk among MSME customers, who account for roughly 30% of India’s GDP, increasing default likelihood. Optimizing the cash-conversion cycle preserves ROCE, while supply-chain finance and invoice-discounting (growing in India) can sustain sales without overextending credit.
FX and import mix
Foreign exchange volatility raises costs for Sicagen's imported components and project cargo, with USD/INR averaging about 83.0 in H1 2025 (RBI), pressuring margins when imports are dollar-priced. Natural hedges from export-linked customers are limited for a primarily domestic distribution network, so company exposure remains concentrated. Use of forward covers and currency-pass-through clauses has stabilized procurement costs in 2024–25, while progressive localization of suppliers is reducing FX risk over time.
Freight and fuel
- Diesel share ~30-35% of road transport cost
- Seasonal/monsoon yield swings 15-20%
- Rail/coastal cost savings ~30-50% for bulk
- Telematics lowers empty miles up to 20%
INR 111L-cr NIP and >INR 10L-cr central capex spur multi-year infra demand
Sicagen volumes track India GDP ~7% (FY24); cement consumption ~380 MT (+6%) and apparent steel ~115 MT (+5%) drive demand. RBI repo 6.50% (mid‑2024) raises working‑capital costs; USD/INR ~83.0 (H1 2025) and diesel share ~30–35% of road cost compress margins. Diversification, index‑linked pricing, forward covers and localization mitigate risks.
| Metric | Value |
|---|---|
| India GDP (FY24) | ~7% |
| Cement cons. (FY24) | ~380 MT (+6%) |
| Apparent steel (FY24) | ~115 MT (+5%) |
| RBI repo | 6.50% (mid‑2024) |
| USD/INR | ~83.0 (H1 2025) |
| Diesel share | 30–35% |
Preview Before You Purchase
Sicagen India PESTLE Analysis
The preview shown here is the exact Sicagen India PESTLE Analysis you’ll receive after purchase—fully formatted and ready to use. The content, layout, and insights visible are the final version with no placeholders. After checkout you’ll download this same professionally structured file instantly.











