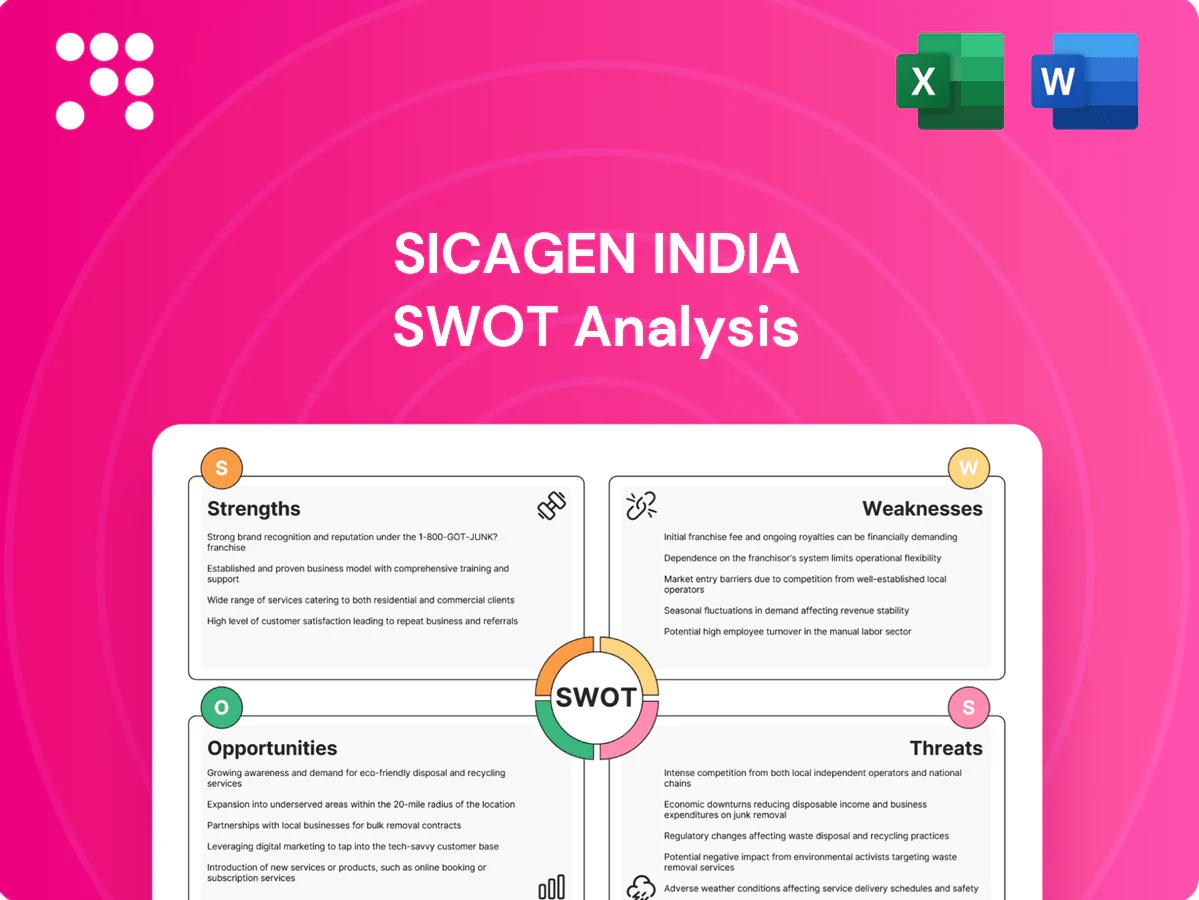
Sicagen India SWOT Analysis

Dive Deeper Into the Company’s Strategic Blueprint
Sicagen India’s SWOT analysis highlights robust manufacturing capacity and strong regional distribution, alongside exposure to cyclical cement demand and raw material volatility. Our full report uncovers strategic opportunities in capacity expansion, margin improvement levers, and competitive threats. Purchase the complete SWOT for an editable, research-backed report and Excel tools to plan and pitch with confidence.
Strengths

Diversified portfolio
Sicagen Indias diversified portfolio across building materials distribution, engineering solutions and logistics smooths revenue volatility by spreading demand across segments. Complementary cycles—materials demand peaking in construction while engineering services follow project timelines—reduce downturn correlation. Cross-selling and bundled solutions enable larger-ticket contracts and sustained margins, and multi-sector exposure enhances resilience against sector-specific shocks.
End-market coverage
Sicagen’s footprint spans infrastructure, building construction and industrial manufacturing, broadening its addressable demand and tender pipelines across project types. This diversification lets it tap India’s National Infrastructure Pipeline (estimated 111 lakh crore for 2020–25) plus private capex in housing and factories. Exposure to both public and private spends smooths revenue seasonality. The company can pivot focus between sectors as cycles shift.

Strong distribution reach
Sicagen India, listed on NSE and BSE, leverages long-standing supplier contracts and an extensive channel network for pipes, fittings and scaffolding to ensure high availability and strong fill rates, supported by efficient last-mile delivery to project sites. This scale enables volume purchasing that tightens pricing and elevates service levels, lowering lead times. The network delivers faster turnaround on urgent project requirements, improving on-site continuity and reducing downtime.

Project cargo & SCM
Sicagen India demonstrates end-to-end project cargo and integrated supply chain management capabilities, handling complex oversized consignments and multimodal logistics to streamline project execution and reduce clients total cost of ownership through optimized routing, inventory and mill-to-site coordination. Single-window accountability ensures clear responsibility and faster issue resolution, driving high execution reliability and strong repeat business.
- End-to-end multimodal handling
- Single-window project accountability
- Lower client TCO via optimized SCM
- High repeat business from execution reliability
Quality-value focus
Sicagen India positions as a quality-value supplier, delivering reliable products at competitive prices that cut customer rework and downtime, boosting onsite productivity. Strict compliance with industry standards and specifications underpins product consistency, fostering buyer trust and anchoring multi-year supply contracts.
- Reliable quality at competitive pricing
- Less rework and lower downtime
- Standards-driven consistency
- Trust enabling long-term contracts
Diversified materials, engineering & logistics positioned to capture ₹111 lakh crore
Sicagen India’s diversified portfolio across building materials, engineering and logistics reduces revenue volatility and enables cross-selling to secure larger contracts. Presence in infrastructure, construction and manufacturing taps India’s National Infrastructure Pipeline of ₹111 lakh crore (2020–25) and both public/private capex. Listed on NSE and BSE, strong supplier contracts and multimodal logistics drive high fill rates and repeat business.
| Metric | Value |
|---|---|
| Listed | NSE, BSE |
| NIP (2020–25) | ₹111 lakh crore |
| Core segments | Materials, Engineering, Logistics |
What is included in the product
 Detailed Word Document
Provides a concise SWOT framework that highlights Sicagen India's internal capabilities, market strengths, operational weaknesses, growth opportunities and external risks shaping its competitive position.

 Customizable Excel Spreadsheet
Provides a concise SWOT snapshot of Sicagen India to quickly diagnose strategic gaps and opportunities. Ideal for executives and teams needing a fast, editable view to align decisions and relieve strategic planning bottlenecks.
Weaknesses

Cyclical exposure
Sicagen India is highly dependent on construction and industrial cycles, so downturns compress volumes and margins. The company is sensitive to government capex timing, with project awards and payments often lagging policy announcements. Order lulls were evident during the 2024 general election period and around budget transitions. Revenue also faces seasonality risk from monsoon-driven slowdowns in on-site construction.
Thin distribution margins
Commoditized products like PVC pipes and fittings limit Sicagen India’s pricing power, forcing frequent promotional discounting that squeezes gross margins. Intense competition from domestic players and imports drives price cuts and compresses margin pools. The business therefore depends heavily on high volumes and rapid working-capital turns, and faces vulnerability when cost inflation cannot be passed through promptly.

Working capital intensity
Sicagen’s working capital is driven by inventory build-up and project receivables common in construction-chemicals players, with Indian EPC receivables typically 90–180 days, creating cash conversion risk; prolonged cycles raise funding needs and squeeze margins as RBI-era borrowing costs around 6–7% (2024–25) increase interest expense, while rapid cement/chemicals commodity swings can sharply strain liquidity and cash flows.

Geographic concentration
Sicagen India’s operations remain primarily concentrated within India and a few adjacent regions, exposing revenue to regional demand shocks and state-level policy shifts such as tax or land-use changes. Uneven logistics and infrastructure across states raise distribution costs and delivery lead times, while under-penetration in several states limits national economies of scale and negotiating leverage with suppliers.
Low brand differentiation
Low brand differentiation limits Sicagen India in standardized materials and logistics, where products are commoditized and hard to distinguish on technical merit alone; customers often choose suppliers based on price and local availability, not brand.
Ease of switching among distributors magnifies margin pressure and churn; Sicagen must develop value-added services—technical support, faster delivery, tailored formulations—to create stickiness and justify premium pricing.
- Weakness: commoditized product mix
- Customer drivers: price & availability
- Risk: easy distributor switching
- Action need: add technical services & logistics
Cyclical PVC slowdown: election, monsoon and working-capital squeeze
Sicagen India is cyclical and election/budget timing compressed 2024 volumes and margins; monsoon seasonality amplifies slowdowns. Commoditized PVC/chemicals limit pricing power, forcing discounts and margin erosion. High working capital—receivables 90–150 days—plus 2024–25 RBI rates ~6–7% strain cash flows and funding.
| Metric | Value (2024/25) |
|---|---|
| Receivables (days) | 90–150 |
| RBI repo (avg) | 6–7% |
| Revenue domestic share | ~90% |
| Election-budget impact | Notable Q2–Q3 2024 lull |
Same Document Delivered
Sicagen India SWOT Analysis
This is the actual SWOT analysis document you’ll receive upon purchase—no surprises, just professional quality. The preview below is taken directly from the full SWOT report you'll get. Once purchased, the complete, editable version covering Sicagen India’s strengths, weaknesses, opportunities and threats becomes available after checkout.

Dive Deeper Into the Company’s Strategic Blueprint
Sicagen India’s SWOT analysis highlights robust manufacturing capacity and strong regional distribution, alongside exposure to cyclical cement demand and raw material volatility. Our full report uncovers strategic opportunities in capacity expansion, margin improvement levers, and competitive threats. Purchase the complete SWOT for an editable, research-backed report and Excel tools to plan and pitch with confidence.
Strengths
Diversified portfolio
Sicagen Indias diversified portfolio across building materials distribution, engineering solutions and logistics smooths revenue volatility by spreading demand across segments. Complementary cycles—materials demand peaking in construction while engineering services follow project timelines—reduce downturn correlation. Cross-selling and bundled solutions enable larger-ticket contracts and sustained margins, and multi-sector exposure enhances resilience against sector-specific shocks.
End-market coverage
Sicagen’s footprint spans infrastructure, building construction and industrial manufacturing, broadening its addressable demand and tender pipelines across project types. This diversification lets it tap India’s National Infrastructure Pipeline (estimated 111 lakh crore for 2020–25) plus private capex in housing and factories. Exposure to both public and private spends smooths revenue seasonality. The company can pivot focus between sectors as cycles shift.
Strong distribution reach
Sicagen India, listed on NSE and BSE, leverages long-standing supplier contracts and an extensive channel network for pipes, fittings and scaffolding to ensure high availability and strong fill rates, supported by efficient last-mile delivery to project sites. This scale enables volume purchasing that tightens pricing and elevates service levels, lowering lead times. The network delivers faster turnaround on urgent project requirements, improving on-site continuity and reducing downtime.
Project cargo & SCM
Sicagen India demonstrates end-to-end project cargo and integrated supply chain management capabilities, handling complex oversized consignments and multimodal logistics to streamline project execution and reduce clients total cost of ownership through optimized routing, inventory and mill-to-site coordination. Single-window accountability ensures clear responsibility and faster issue resolution, driving high execution reliability and strong repeat business.
- End-to-end multimodal handling
- Single-window project accountability
- Lower client TCO via optimized SCM
- High repeat business from execution reliability
Quality-value focus
Sicagen India positions as a quality-value supplier, delivering reliable products at competitive prices that cut customer rework and downtime, boosting onsite productivity. Strict compliance with industry standards and specifications underpins product consistency, fostering buyer trust and anchoring multi-year supply contracts.
- Reliable quality at competitive pricing
- Less rework and lower downtime
- Standards-driven consistency
- Trust enabling long-term contracts
Diversified materials, engineering & logistics positioned to capture ₹111 lakh crore
Sicagen India’s diversified portfolio across building materials, engineering and logistics reduces revenue volatility and enables cross-selling to secure larger contracts. Presence in infrastructure, construction and manufacturing taps India’s National Infrastructure Pipeline of ₹111 lakh crore (2020–25) and both public/private capex. Listed on NSE and BSE, strong supplier contracts and multimodal logistics drive high fill rates and repeat business.
| Metric | Value |
|---|---|
| Listed | NSE, BSE |
| NIP (2020–25) | ₹111 lakh crore |
| Core segments | Materials, Engineering, Logistics |
What is included in the product
Detailed Word Document
Provides a concise SWOT framework that highlights Sicagen India's internal capabilities, market strengths, operational weaknesses, growth opportunities and external risks shaping its competitive position.
Customizable Excel Spreadsheet
Provides a concise SWOT snapshot of Sicagen India to quickly diagnose strategic gaps and opportunities. Ideal for executives and teams needing a fast, editable view to align decisions and relieve strategic planning bottlenecks.
Weaknesses
Cyclical exposure
Sicagen India is highly dependent on construction and industrial cycles, so downturns compress volumes and margins. The company is sensitive to government capex timing, with project awards and payments often lagging policy announcements. Order lulls were evident during the 2024 general election period and around budget transitions. Revenue also faces seasonality risk from monsoon-driven slowdowns in on-site construction.
Thin distribution margins
Commoditized products like PVC pipes and fittings limit Sicagen India’s pricing power, forcing frequent promotional discounting that squeezes gross margins. Intense competition from domestic players and imports drives price cuts and compresses margin pools. The business therefore depends heavily on high volumes and rapid working-capital turns, and faces vulnerability when cost inflation cannot be passed through promptly.
Working capital intensity
Sicagen’s working capital is driven by inventory build-up and project receivables common in construction-chemicals players, with Indian EPC receivables typically 90–180 days, creating cash conversion risk; prolonged cycles raise funding needs and squeeze margins as RBI-era borrowing costs around 6–7% (2024–25) increase interest expense, while rapid cement/chemicals commodity swings can sharply strain liquidity and cash flows.
Geographic concentration
Sicagen India’s operations remain primarily concentrated within India and a few adjacent regions, exposing revenue to regional demand shocks and state-level policy shifts such as tax or land-use changes. Uneven logistics and infrastructure across states raise distribution costs and delivery lead times, while under-penetration in several states limits national economies of scale and negotiating leverage with suppliers.
Low brand differentiation
Low brand differentiation limits Sicagen India in standardized materials and logistics, where products are commoditized and hard to distinguish on technical merit alone; customers often choose suppliers based on price and local availability, not brand.
Ease of switching among distributors magnifies margin pressure and churn; Sicagen must develop value-added services—technical support, faster delivery, tailored formulations—to create stickiness and justify premium pricing.
- Weakness: commoditized product mix
- Customer drivers: price & availability
- Risk: easy distributor switching
- Action need: add technical services & logistics
Cyclical PVC slowdown: election, monsoon and working-capital squeeze
Sicagen India is cyclical and election/budget timing compressed 2024 volumes and margins; monsoon seasonality amplifies slowdowns. Commoditized PVC/chemicals limit pricing power, forcing discounts and margin erosion. High working capital—receivables 90–150 days—plus 2024–25 RBI rates ~6–7% strain cash flows and funding.
| Metric | Value (2024/25) |
|---|---|
| Receivables (days) | 90–150 |
| RBI repo (avg) | 6–7% |
| Revenue domestic share | ~90% |
| Election-budget impact | Notable Q2–Q3 2024 lull |
Same Document Delivered
Sicagen India SWOT Analysis
This is the actual SWOT analysis document you’ll receive upon purchase—no surprises, just professional quality. The preview below is taken directly from the full SWOT report you'll get. Once purchased, the complete, editable version covering Sicagen India’s strengths, weaknesses, opportunities and threats becomes available after checkout.
Description
Dive Deeper Into the Company’s Strategic Blueprint
Sicagen India’s SWOT analysis highlights robust manufacturing capacity and strong regional distribution, alongside exposure to cyclical cement demand and raw material volatility. Our full report uncovers strategic opportunities in capacity expansion, margin improvement levers, and competitive threats. Purchase the complete SWOT for an editable, research-backed report and Excel tools to plan and pitch with confidence.
Strengths
Diversified portfolio
Sicagen Indias diversified portfolio across building materials distribution, engineering solutions and logistics smooths revenue volatility by spreading demand across segments. Complementary cycles—materials demand peaking in construction while engineering services follow project timelines—reduce downturn correlation. Cross-selling and bundled solutions enable larger-ticket contracts and sustained margins, and multi-sector exposure enhances resilience against sector-specific shocks.
End-market coverage
Sicagen’s footprint spans infrastructure, building construction and industrial manufacturing, broadening its addressable demand and tender pipelines across project types. This diversification lets it tap India’s National Infrastructure Pipeline (estimated 111 lakh crore for 2020–25) plus private capex in housing and factories. Exposure to both public and private spends smooths revenue seasonality. The company can pivot focus between sectors as cycles shift.
Strong distribution reach
Sicagen India, listed on NSE and BSE, leverages long-standing supplier contracts and an extensive channel network for pipes, fittings and scaffolding to ensure high availability and strong fill rates, supported by efficient last-mile delivery to project sites. This scale enables volume purchasing that tightens pricing and elevates service levels, lowering lead times. The network delivers faster turnaround on urgent project requirements, improving on-site continuity and reducing downtime.
Project cargo & SCM
Sicagen India demonstrates end-to-end project cargo and integrated supply chain management capabilities, handling complex oversized consignments and multimodal logistics to streamline project execution and reduce clients total cost of ownership through optimized routing, inventory and mill-to-site coordination. Single-window accountability ensures clear responsibility and faster issue resolution, driving high execution reliability and strong repeat business.
- End-to-end multimodal handling
- Single-window project accountability
- Lower client TCO via optimized SCM
- High repeat business from execution reliability
Quality-value focus
Sicagen India positions as a quality-value supplier, delivering reliable products at competitive prices that cut customer rework and downtime, boosting onsite productivity. Strict compliance with industry standards and specifications underpins product consistency, fostering buyer trust and anchoring multi-year supply contracts.
- Reliable quality at competitive pricing
- Less rework and lower downtime
- Standards-driven consistency
- Trust enabling long-term contracts
Diversified materials, engineering & logistics positioned to capture ₹111 lakh crore
Sicagen India’s diversified portfolio across building materials, engineering and logistics reduces revenue volatility and enables cross-selling to secure larger contracts. Presence in infrastructure, construction and manufacturing taps India’s National Infrastructure Pipeline of ₹111 lakh crore (2020–25) and both public/private capex. Listed on NSE and BSE, strong supplier contracts and multimodal logistics drive high fill rates and repeat business.
| Metric | Value |
|---|---|
| Listed | NSE, BSE |
| NIP (2020–25) | ₹111 lakh crore |
| Core segments | Materials, Engineering, Logistics |
What is included in the product
Detailed Word Document
Provides a concise SWOT framework that highlights Sicagen India's internal capabilities, market strengths, operational weaknesses, growth opportunities and external risks shaping its competitive position.
Customizable Excel Spreadsheet
Provides a concise SWOT snapshot of Sicagen India to quickly diagnose strategic gaps and opportunities. Ideal for executives and teams needing a fast, editable view to align decisions and relieve strategic planning bottlenecks.
Weaknesses
Cyclical exposure
Sicagen India is highly dependent on construction and industrial cycles, so downturns compress volumes and margins. The company is sensitive to government capex timing, with project awards and payments often lagging policy announcements. Order lulls were evident during the 2024 general election period and around budget transitions. Revenue also faces seasonality risk from monsoon-driven slowdowns in on-site construction.
Thin distribution margins
Commoditized products like PVC pipes and fittings limit Sicagen India’s pricing power, forcing frequent promotional discounting that squeezes gross margins. Intense competition from domestic players and imports drives price cuts and compresses margin pools. The business therefore depends heavily on high volumes and rapid working-capital turns, and faces vulnerability when cost inflation cannot be passed through promptly.
Working capital intensity
Sicagen’s working capital is driven by inventory build-up and project receivables common in construction-chemicals players, with Indian EPC receivables typically 90–180 days, creating cash conversion risk; prolonged cycles raise funding needs and squeeze margins as RBI-era borrowing costs around 6–7% (2024–25) increase interest expense, while rapid cement/chemicals commodity swings can sharply strain liquidity and cash flows.
Geographic concentration
Sicagen India’s operations remain primarily concentrated within India and a few adjacent regions, exposing revenue to regional demand shocks and state-level policy shifts such as tax or land-use changes. Uneven logistics and infrastructure across states raise distribution costs and delivery lead times, while under-penetration in several states limits national economies of scale and negotiating leverage with suppliers.
Low brand differentiation
Low brand differentiation limits Sicagen India in standardized materials and logistics, where products are commoditized and hard to distinguish on technical merit alone; customers often choose suppliers based on price and local availability, not brand.
Ease of switching among distributors magnifies margin pressure and churn; Sicagen must develop value-added services—technical support, faster delivery, tailored formulations—to create stickiness and justify premium pricing.
- Weakness: commoditized product mix
- Customer drivers: price & availability
- Risk: easy distributor switching
- Action need: add technical services & logistics
Cyclical PVC slowdown: election, monsoon and working-capital squeeze
Sicagen India is cyclical and election/budget timing compressed 2024 volumes and margins; monsoon seasonality amplifies slowdowns. Commoditized PVC/chemicals limit pricing power, forcing discounts and margin erosion. High working capital—receivables 90–150 days—plus 2024–25 RBI rates ~6–7% strain cash flows and funding.
| Metric | Value (2024/25) |
|---|---|
| Receivables (days) | 90–150 |
| RBI repo (avg) | 6–7% |
| Revenue domestic share | ~90% |
| Election-budget impact | Notable Q2–Q3 2024 lull |
Same Document Delivered
Sicagen India SWOT Analysis
This is the actual SWOT analysis document you’ll receive upon purchase—no surprises, just professional quality. The preview below is taken directly from the full SWOT report you'll get. Once purchased, the complete, editable version covering Sicagen India’s strengths, weaknesses, opportunities and threats becomes available after checkout.











