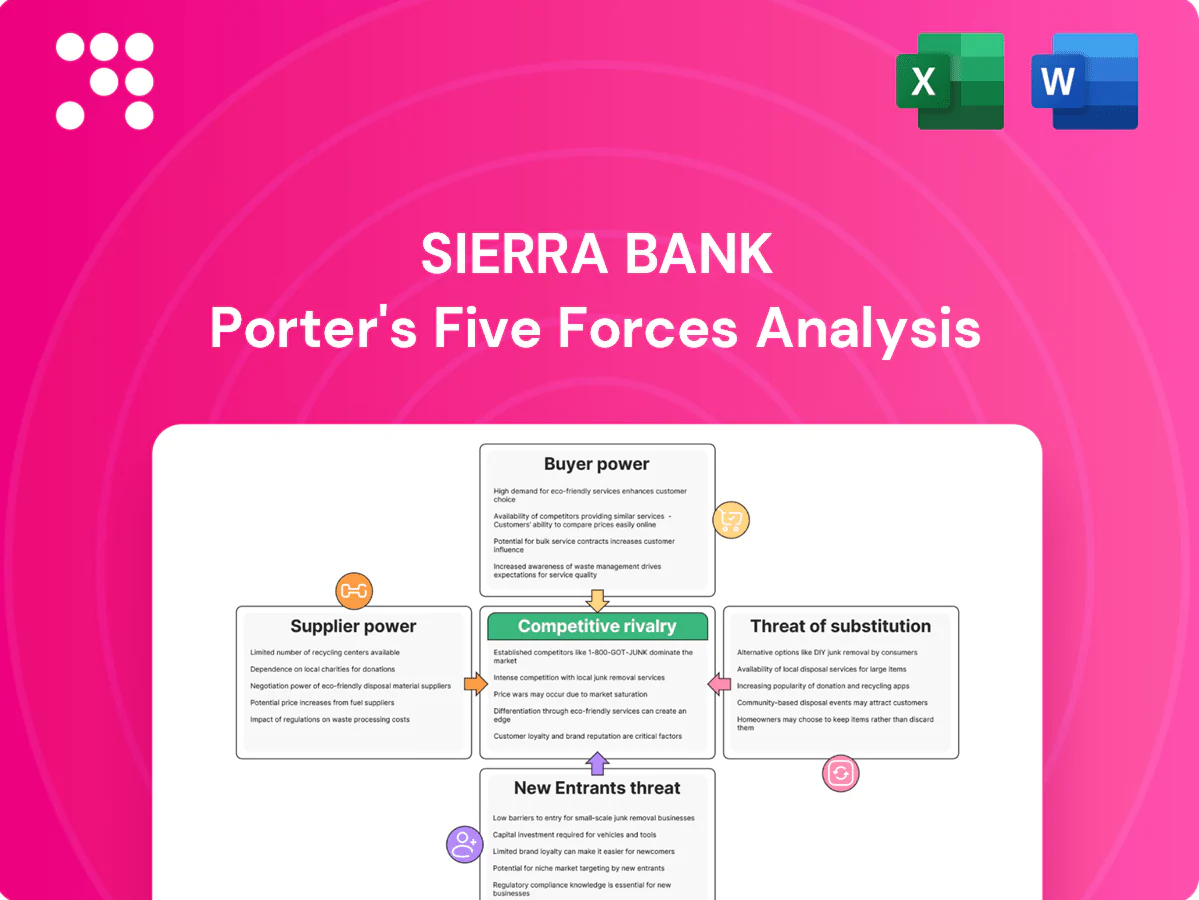
Sierra Bank Porter's Five Forces Analysis

Don't Miss the Bigger Picture
Sierra Bank faces moderate buyer power, concentrated local competition, regulatory pressure, and evolving fintech substitutes that shape its margins and growth prospects. Our snapshot highlights key strategic vulnerabilities and potential competitive advantages, but deeper force-by-force ratings and scenario-based implications are required to act decisively. Unlock the full Porter's Five Forces Analysis for Sierra Bank to get visuals, quantitative ratings, and actionable recommendations.
Suppliers Bargaining Power

Core deposit funding concentration
Depositors are a primary funding source and can push rates higher when competitors run promotions; insured balances are capped at 250,000 per account by the FDIC. In a localized Central Valley market, a few large municipal, agricultural, or business accounts can exert outsized influence on liquidity and pricing power. Maintaining diversified, granular retail deposits reduces single-supplier risk, while relationship banking and treasury services anchor stickier balances.
Reliance on wholesale and brokered funding
When liquidity tightens or loan growth outpaces deposits, reliance on FHLB advances or brokered CDs can climb to roughly 15–25% of funding, and these sources typically reprice with market rates—brokered CDs often reset within 30–90 days—giving suppliers higher bargaining power. Covenants and collateral requirements can impose 10–30% haircuts and restrict balance-sheet flexibility. Proactive liquidity management and laddered maturities that target rollover below 10% mitigate exposure.

Core technology vendor lock-in
Banks rely on a concentrated set of core, digital-banking and payments vendors—FIS, Fiserv and Jack Henry account for roughly 70% of US core market share while Visa and Mastercard process over 80% of card volume—so switching cores is costly, risky and often takes 12–36 months and tens of millions of dollars, boosting supplier leverage. Contract terms, integration fees and roadmap control can compress margins, though multi-vendor architectures and strict SLAs can restore negotiating balance.

Capital markets and regulators as gatekeepers
Equity and debt investors set Sierra Bank’s cost of capital, constraining growth and pricing flexibility; investor expectations tightened after 2023–24 regional bank stress. Regulators enforce Basel III minima (CET1 ≥ 4.5% plus buffers) and LCR ≥ 100%, acting as non-price supplier constraints. Examiners can mandate system upgrades or risk controls that raise costs, while transparent risk management reduces implicit funding premia.
- Investors: cost of capital drives strategy
- Regulators: CET1 ≥ 4.5% + buffers, LCR ≥ 100%
- Examiners: upgrades raise expenses
Skilled banking talent and branch real estate
Experienced lenders and compliance staff are scarce in regional markets, with US unemployment around 4.0% in 2024 (BLS), pressuring wages and elevating supplier bargaining power; producer bankers with deep ag/SMB books often command recruitment premiums and retention incentives. Prime branch sites in small communities are limited, but retention programs and hybrid delivery (digital + selective branches) reduce dependence on physical footprints.
- Talent scarcity: drives wage inflation
- Producer bankers: command premiums
- Branch scarcity: limits site options
- Retention/hybrid: lowers footprint reliance
Deposit caps, brokered funding and vendor concentration heighten bank funding and operational risk
Depositors, FHLB/brokered funding and core tech vendors exert meaningful supplier power: FDIC insurance cap 250000, brokered CDs/FHLB can reach 15–25% of funding under stress, FIS/Fiserv/Jack Henry ≈70% core share and Visa/Mastercard >80% card volume. Regulatory capital/LCR (CET1 ≥4.5% + buffers; LCR ≥100%) and 2024 unemployment ~4.0% raise wage/supplier pressure. Diversified deposits, laddering and multi-vendor strategies reduce leverage.
| Metric | Value |
|---|---|
| FDIC cap | 250000 |
| Brokered/FHLB share | 15–25% |
| Core vendors market | ≈70% |
| Card networks | >80% |
| CET1 regulatory | ≥4.5% + buffers |
| LCR | ≥100% |
| US unemployment 2024 | ≈4.0% |
What is included in the product
 Detailed Word Document
Tailored Porter's Five Forces analysis for Sierra Bank that uncovers competitive drivers, buyer and supplier power, entry barriers and substitute threats, highlights disruptive risks and strategic levers, and delivers actionable insights for investors, management, and advisors.

 Customizable Excel Spreadsheet
A concise one-sheet summary of Sierra Bank's Five Forces for rapid risk triage and strategic action—customize pressure levels and view a radar chart to quickly spot threats, prioritize responses, and streamline boardroom decisions.
Customers Bargaining Power

Price-sensitive borrowers
Bargaining power is high as borrowers routinely shop rates across community banks, regionals and credit unions; even 10–25 basis point spread moves can trigger switching for commercial real estate and agricultural loans. Competitors offering fee waivers or 1–2 week faster closes further increase borrower leverage. Differentiated underwriting, faster turn times and relationship credits can offset pure price competition.
Deposit rate elasticity
Households and businesses increasingly benchmark Sierra Bank deposit APYs against online savings rates near 4.5% and money market fund yields about 4.6% in mid-2024. Rising-rate conditions amplify customer demands for higher yields. Short-term promotions drive hot-money inflows and rapid outflows. Loyalty perks and bundled services raise retention while lowering effective funding costs.

Moderate switching costs
Bill pay, payroll and treasury setups create moderate friction—enough to deter some moves but not prohibitive for SMEs that cite convenience as primary factor. Digital account opening and fintech tools pushed by 2024 saw roughly 80% customer digital adoption, materially lowering switching barriers. Relationship managers remain a key retention moat in small markets, preserving localized share. Data-driven onboarding (behavioral triggers, API integrations) reinforces stickiness post-acquisition.

Concentrated ag and SMB clients
Regional concentration in agriculture and SMBs concentrates negotiating leverage among key clients; agriculture represented about 1% of US GDP in 2024 while small businesses made up 99.9% of US firms (SBA 2024). Seasonal credit lines and crop collateral nuances enable informed haggling; niche ag lenders can poach with specialized products, while tailored advisory and covenants deepen client dependence.
- Concentration: regional ag/SMB exposure
- Seasonality: seasonal lines, collateral nuances
- Competition: niche ag lenders poach
- Retention: advisory/tailored solutions raise switching costs
Rising digital experience expectations
Customers now expect seamless mobile experiences, instant payments and 24/7 support; by 2024 roughly 78% of retail banking interactions are via mobile and ~67% of consumers expect real‑time settlement, benchmarks set by national banks and fintechs raise the standard.
UX gaps translate directly into bargaining leverage—poor app experiences correlate with higher attrition and requests for fee concessions—continuous app improvements have been shown to cut churn and non‑price leverage materially.
- Benchmarks: national banks and fintech apps dominate UX expectations
- Customer leverage: UX gaps → higher churn and demand for concessions
- Defense: ongoing app improvements reduce non‑price bargaining power
Customers switch on 10–25 bps; digital 80%, yields 4.5–4.6%
Customer bargaining power is high: 10–25 bps rate moves trigger switches; online savings ~4.5% and money markets ~4.6% (mid‑2024). Digital adoption ~80%/mobile interactions ~78% lower switching friction, while ag/SMB concentration (ag ~1% GDP; SMBs 99.9% firms) concentrates leverage mitigated by relationship managers, faster closes and UX improvements.
| Metric | 2024 |
|---|---|
| Rate sensitivity | 10–25 bps |
| Online savings | 4.5% |
| Money market | 4.6% |
| Digital adoption | ~80% |
Full Version Awaits
Sierra Bank Porter's Five Forces Analysis
This preview shows the exact Sierra Bank Porter's Five Forces Analysis you'll receive—no placeholders or mockups. The document is fully formatted and ready for immediate download the moment you complete your purchase. You're looking at the final deliverable, complete and ready to use for decision‑making or reporting.

Don't Miss the Bigger Picture
Sierra Bank faces moderate buyer power, concentrated local competition, regulatory pressure, and evolving fintech substitutes that shape its margins and growth prospects. Our snapshot highlights key strategic vulnerabilities and potential competitive advantages, but deeper force-by-force ratings and scenario-based implications are required to act decisively. Unlock the full Porter's Five Forces Analysis for Sierra Bank to get visuals, quantitative ratings, and actionable recommendations.
Suppliers Bargaining Power
Core deposit funding concentration
Depositors are a primary funding source and can push rates higher when competitors run promotions; insured balances are capped at 250,000 per account by the FDIC. In a localized Central Valley market, a few large municipal, agricultural, or business accounts can exert outsized influence on liquidity and pricing power. Maintaining diversified, granular retail deposits reduces single-supplier risk, while relationship banking and treasury services anchor stickier balances.
Reliance on wholesale and brokered funding
When liquidity tightens or loan growth outpaces deposits, reliance on FHLB advances or brokered CDs can climb to roughly 15–25% of funding, and these sources typically reprice with market rates—brokered CDs often reset within 30–90 days—giving suppliers higher bargaining power. Covenants and collateral requirements can impose 10–30% haircuts and restrict balance-sheet flexibility. Proactive liquidity management and laddered maturities that target rollover below 10% mitigate exposure.
Core technology vendor lock-in
Banks rely on a concentrated set of core, digital-banking and payments vendors—FIS, Fiserv and Jack Henry account for roughly 70% of US core market share while Visa and Mastercard process over 80% of card volume—so switching cores is costly, risky and often takes 12–36 months and tens of millions of dollars, boosting supplier leverage. Contract terms, integration fees and roadmap control can compress margins, though multi-vendor architectures and strict SLAs can restore negotiating balance.
Capital markets and regulators as gatekeepers
Equity and debt investors set Sierra Bank’s cost of capital, constraining growth and pricing flexibility; investor expectations tightened after 2023–24 regional bank stress. Regulators enforce Basel III minima (CET1 ≥ 4.5% plus buffers) and LCR ≥ 100%, acting as non-price supplier constraints. Examiners can mandate system upgrades or risk controls that raise costs, while transparent risk management reduces implicit funding premia.
- Investors: cost of capital drives strategy
- Regulators: CET1 ≥ 4.5% + buffers, LCR ≥ 100%
- Examiners: upgrades raise expenses
Skilled banking talent and branch real estate
Experienced lenders and compliance staff are scarce in regional markets, with US unemployment around 4.0% in 2024 (BLS), pressuring wages and elevating supplier bargaining power; producer bankers with deep ag/SMB books often command recruitment premiums and retention incentives. Prime branch sites in small communities are limited, but retention programs and hybrid delivery (digital + selective branches) reduce dependence on physical footprints.
- Talent scarcity: drives wage inflation
- Producer bankers: command premiums
- Branch scarcity: limits site options
- Retention/hybrid: lowers footprint reliance
Deposit caps, brokered funding and vendor concentration heighten bank funding and operational risk
Depositors, FHLB/brokered funding and core tech vendors exert meaningful supplier power: FDIC insurance cap 250000, brokered CDs/FHLB can reach 15–25% of funding under stress, FIS/Fiserv/Jack Henry ≈70% core share and Visa/Mastercard >80% card volume. Regulatory capital/LCR (CET1 ≥4.5% + buffers; LCR ≥100%) and 2024 unemployment ~4.0% raise wage/supplier pressure. Diversified deposits, laddering and multi-vendor strategies reduce leverage.
| Metric | Value |
|---|---|
| FDIC cap | 250000 |
| Brokered/FHLB share | 15–25% |
| Core vendors market | ≈70% |
| Card networks | >80% |
| CET1 regulatory | ≥4.5% + buffers |
| LCR | ≥100% |
| US unemployment 2024 | ≈4.0% |
What is included in the product
Detailed Word Document
Tailored Porter's Five Forces analysis for Sierra Bank that uncovers competitive drivers, buyer and supplier power, entry barriers and substitute threats, highlights disruptive risks and strategic levers, and delivers actionable insights for investors, management, and advisors.
Customizable Excel Spreadsheet
A concise one-sheet summary of Sierra Bank's Five Forces for rapid risk triage and strategic action—customize pressure levels and view a radar chart to quickly spot threats, prioritize responses, and streamline boardroom decisions.
Customers Bargaining Power
Price-sensitive borrowers
Bargaining power is high as borrowers routinely shop rates across community banks, regionals and credit unions; even 10–25 basis point spread moves can trigger switching for commercial real estate and agricultural loans. Competitors offering fee waivers or 1–2 week faster closes further increase borrower leverage. Differentiated underwriting, faster turn times and relationship credits can offset pure price competition.
Deposit rate elasticity
Households and businesses increasingly benchmark Sierra Bank deposit APYs against online savings rates near 4.5% and money market fund yields about 4.6% in mid-2024. Rising-rate conditions amplify customer demands for higher yields. Short-term promotions drive hot-money inflows and rapid outflows. Loyalty perks and bundled services raise retention while lowering effective funding costs.
Moderate switching costs
Bill pay, payroll and treasury setups create moderate friction—enough to deter some moves but not prohibitive for SMEs that cite convenience as primary factor. Digital account opening and fintech tools pushed by 2024 saw roughly 80% customer digital adoption, materially lowering switching barriers. Relationship managers remain a key retention moat in small markets, preserving localized share. Data-driven onboarding (behavioral triggers, API integrations) reinforces stickiness post-acquisition.
Concentrated ag and SMB clients
Regional concentration in agriculture and SMBs concentrates negotiating leverage among key clients; agriculture represented about 1% of US GDP in 2024 while small businesses made up 99.9% of US firms (SBA 2024). Seasonal credit lines and crop collateral nuances enable informed haggling; niche ag lenders can poach with specialized products, while tailored advisory and covenants deepen client dependence.
- Concentration: regional ag/SMB exposure
- Seasonality: seasonal lines, collateral nuances
- Competition: niche ag lenders poach
- Retention: advisory/tailored solutions raise switching costs
Rising digital experience expectations
Customers now expect seamless mobile experiences, instant payments and 24/7 support; by 2024 roughly 78% of retail banking interactions are via mobile and ~67% of consumers expect real‑time settlement, benchmarks set by national banks and fintechs raise the standard.
UX gaps translate directly into bargaining leverage—poor app experiences correlate with higher attrition and requests for fee concessions—continuous app improvements have been shown to cut churn and non‑price leverage materially.
- Benchmarks: national banks and fintech apps dominate UX expectations
- Customer leverage: UX gaps → higher churn and demand for concessions
- Defense: ongoing app improvements reduce non‑price bargaining power
Customers switch on 10–25 bps; digital 80%, yields 4.5–4.6%
Customer bargaining power is high: 10–25 bps rate moves trigger switches; online savings ~4.5% and money markets ~4.6% (mid‑2024). Digital adoption ~80%/mobile interactions ~78% lower switching friction, while ag/SMB concentration (ag ~1% GDP; SMBs 99.9% firms) concentrates leverage mitigated by relationship managers, faster closes and UX improvements.
| Metric | 2024 |
|---|---|
| Rate sensitivity | 10–25 bps |
| Online savings | 4.5% |
| Money market | 4.6% |
| Digital adoption | ~80% |
Full Version Awaits
Sierra Bank Porter's Five Forces Analysis
This preview shows the exact Sierra Bank Porter's Five Forces Analysis you'll receive—no placeholders or mockups. The document is fully formatted and ready for immediate download the moment you complete your purchase. You're looking at the final deliverable, complete and ready to use for decision‑making or reporting.
Original: $10.00
-65%$10.00
$3.50Description
Don't Miss the Bigger Picture
Sierra Bank faces moderate buyer power, concentrated local competition, regulatory pressure, and evolving fintech substitutes that shape its margins and growth prospects. Our snapshot highlights key strategic vulnerabilities and potential competitive advantages, but deeper force-by-force ratings and scenario-based implications are required to act decisively. Unlock the full Porter's Five Forces Analysis for Sierra Bank to get visuals, quantitative ratings, and actionable recommendations.
Suppliers Bargaining Power
Core deposit funding concentration
Depositors are a primary funding source and can push rates higher when competitors run promotions; insured balances are capped at 250,000 per account by the FDIC. In a localized Central Valley market, a few large municipal, agricultural, or business accounts can exert outsized influence on liquidity and pricing power. Maintaining diversified, granular retail deposits reduces single-supplier risk, while relationship banking and treasury services anchor stickier balances.
Reliance on wholesale and brokered funding
When liquidity tightens or loan growth outpaces deposits, reliance on FHLB advances or brokered CDs can climb to roughly 15–25% of funding, and these sources typically reprice with market rates—brokered CDs often reset within 30–90 days—giving suppliers higher bargaining power. Covenants and collateral requirements can impose 10–30% haircuts and restrict balance-sheet flexibility. Proactive liquidity management and laddered maturities that target rollover below 10% mitigate exposure.
Core technology vendor lock-in
Banks rely on a concentrated set of core, digital-banking and payments vendors—FIS, Fiserv and Jack Henry account for roughly 70% of US core market share while Visa and Mastercard process over 80% of card volume—so switching cores is costly, risky and often takes 12–36 months and tens of millions of dollars, boosting supplier leverage. Contract terms, integration fees and roadmap control can compress margins, though multi-vendor architectures and strict SLAs can restore negotiating balance.
Capital markets and regulators as gatekeepers
Equity and debt investors set Sierra Bank’s cost of capital, constraining growth and pricing flexibility; investor expectations tightened after 2023–24 regional bank stress. Regulators enforce Basel III minima (CET1 ≥ 4.5% plus buffers) and LCR ≥ 100%, acting as non-price supplier constraints. Examiners can mandate system upgrades or risk controls that raise costs, while transparent risk management reduces implicit funding premia.
- Investors: cost of capital drives strategy
- Regulators: CET1 ≥ 4.5% + buffers, LCR ≥ 100%
- Examiners: upgrades raise expenses
Skilled banking talent and branch real estate
Experienced lenders and compliance staff are scarce in regional markets, with US unemployment around 4.0% in 2024 (BLS), pressuring wages and elevating supplier bargaining power; producer bankers with deep ag/SMB books often command recruitment premiums and retention incentives. Prime branch sites in small communities are limited, but retention programs and hybrid delivery (digital + selective branches) reduce dependence on physical footprints.
- Talent scarcity: drives wage inflation
- Producer bankers: command premiums
- Branch scarcity: limits site options
- Retention/hybrid: lowers footprint reliance
Deposit caps, brokered funding and vendor concentration heighten bank funding and operational risk
Depositors, FHLB/brokered funding and core tech vendors exert meaningful supplier power: FDIC insurance cap 250000, brokered CDs/FHLB can reach 15–25% of funding under stress, FIS/Fiserv/Jack Henry ≈70% core share and Visa/Mastercard >80% card volume. Regulatory capital/LCR (CET1 ≥4.5% + buffers; LCR ≥100%) and 2024 unemployment ~4.0% raise wage/supplier pressure. Diversified deposits, laddering and multi-vendor strategies reduce leverage.
| Metric | Value |
|---|---|
| FDIC cap | 250000 |
| Brokered/FHLB share | 15–25% |
| Core vendors market | ≈70% |
| Card networks | >80% |
| CET1 regulatory | ≥4.5% + buffers |
| LCR | ≥100% |
| US unemployment 2024 | ≈4.0% |
What is included in the product
Detailed Word Document
Tailored Porter's Five Forces analysis for Sierra Bank that uncovers competitive drivers, buyer and supplier power, entry barriers and substitute threats, highlights disruptive risks and strategic levers, and delivers actionable insights for investors, management, and advisors.
Customizable Excel Spreadsheet
A concise one-sheet summary of Sierra Bank's Five Forces for rapid risk triage and strategic action—customize pressure levels and view a radar chart to quickly spot threats, prioritize responses, and streamline boardroom decisions.
Customers Bargaining Power
Price-sensitive borrowers
Bargaining power is high as borrowers routinely shop rates across community banks, regionals and credit unions; even 10–25 basis point spread moves can trigger switching for commercial real estate and agricultural loans. Competitors offering fee waivers or 1–2 week faster closes further increase borrower leverage. Differentiated underwriting, faster turn times and relationship credits can offset pure price competition.
Deposit rate elasticity
Households and businesses increasingly benchmark Sierra Bank deposit APYs against online savings rates near 4.5% and money market fund yields about 4.6% in mid-2024. Rising-rate conditions amplify customer demands for higher yields. Short-term promotions drive hot-money inflows and rapid outflows. Loyalty perks and bundled services raise retention while lowering effective funding costs.
Moderate switching costs
Bill pay, payroll and treasury setups create moderate friction—enough to deter some moves but not prohibitive for SMEs that cite convenience as primary factor. Digital account opening and fintech tools pushed by 2024 saw roughly 80% customer digital adoption, materially lowering switching barriers. Relationship managers remain a key retention moat in small markets, preserving localized share. Data-driven onboarding (behavioral triggers, API integrations) reinforces stickiness post-acquisition.
Concentrated ag and SMB clients
Regional concentration in agriculture and SMBs concentrates negotiating leverage among key clients; agriculture represented about 1% of US GDP in 2024 while small businesses made up 99.9% of US firms (SBA 2024). Seasonal credit lines and crop collateral nuances enable informed haggling; niche ag lenders can poach with specialized products, while tailored advisory and covenants deepen client dependence.
- Concentration: regional ag/SMB exposure
- Seasonality: seasonal lines, collateral nuances
- Competition: niche ag lenders poach
- Retention: advisory/tailored solutions raise switching costs
Rising digital experience expectations
Customers now expect seamless mobile experiences, instant payments and 24/7 support; by 2024 roughly 78% of retail banking interactions are via mobile and ~67% of consumers expect real‑time settlement, benchmarks set by national banks and fintechs raise the standard.
UX gaps translate directly into bargaining leverage—poor app experiences correlate with higher attrition and requests for fee concessions—continuous app improvements have been shown to cut churn and non‑price leverage materially.
- Benchmarks: national banks and fintech apps dominate UX expectations
- Customer leverage: UX gaps → higher churn and demand for concessions
- Defense: ongoing app improvements reduce non‑price bargaining power
Customers switch on 10–25 bps; digital 80%, yields 4.5–4.6%
Customer bargaining power is high: 10–25 bps rate moves trigger switches; online savings ~4.5% and money markets ~4.6% (mid‑2024). Digital adoption ~80%/mobile interactions ~78% lower switching friction, while ag/SMB concentration (ag ~1% GDP; SMBs 99.9% firms) concentrates leverage mitigated by relationship managers, faster closes and UX improvements.
| Metric | 2024 |
|---|---|
| Rate sensitivity | 10–25 bps |
| Online savings | 4.5% |
| Money market | 4.6% |
| Digital adoption | ~80% |
Full Version Awaits
Sierra Bank Porter's Five Forces Analysis
This preview shows the exact Sierra Bank Porter's Five Forces Analysis you'll receive—no placeholders or mockups. The document is fully formatted and ready for immediate download the moment you complete your purchase. You're looking at the final deliverable, complete and ready to use for decision‑making or reporting.











