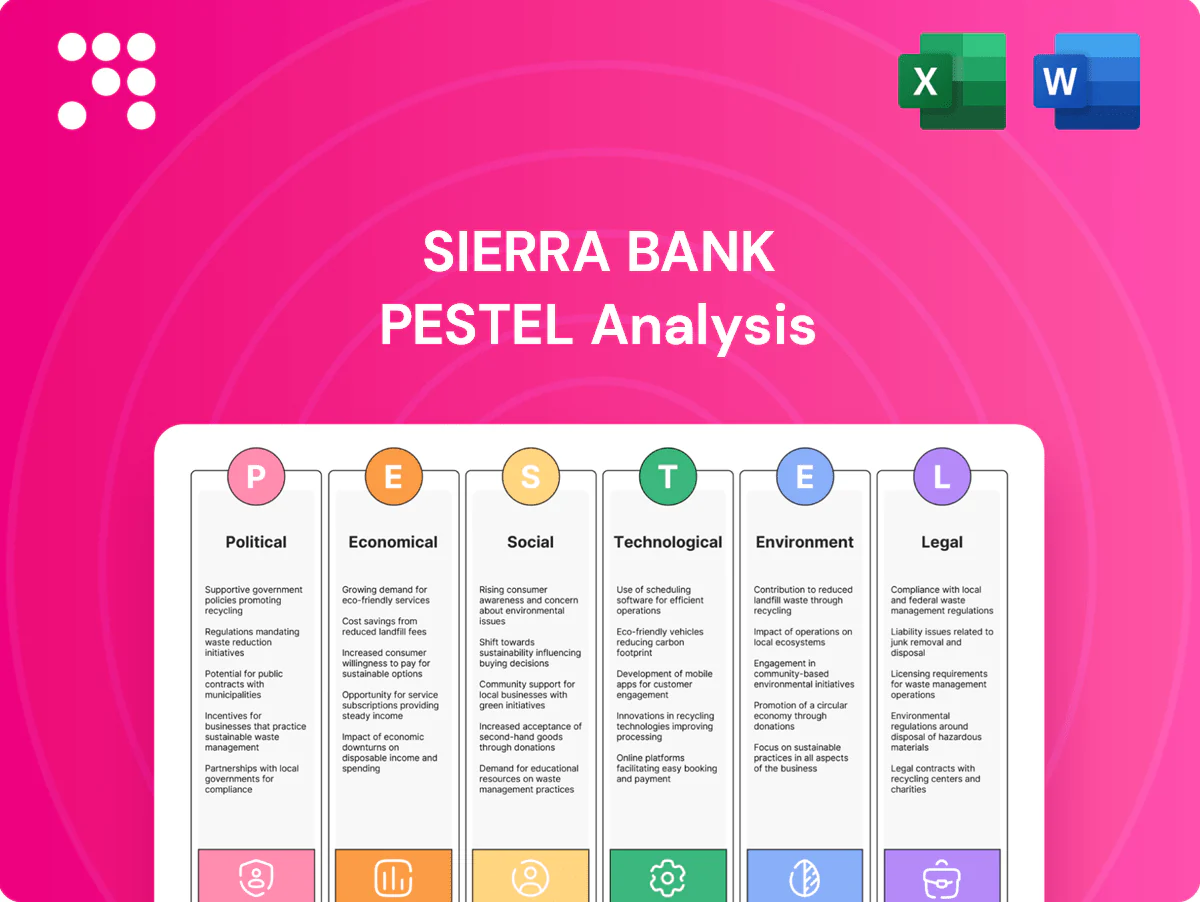
Sierra Bank PESTLE Analysis

Plan Smarter. Present Sharper. Compete Stronger.
Understand how political shifts, economic cycles, social trends, technological advances, legal changes, and environmental factors are shaping Sierra Bank's strategic position and risk profile. Our concise PESTLE distills these external forces into actionable insights for investors, advisors, and managers. Purchase the full analysis to access detailed scenarios, data-driven implications, and ready-to-use strategic recommendations.
Political factors

State and federal banking policy direction
Federal policy tightening that pushed short-term rates above 5% and post-2023 regional-bank stresses have elevated Fed/FDIC/OCC supervisory scrutiny, raising compliance costs and capital planning for community banks. California’s pro-consumer enforcement, including the CCFPL, increases state-level compliance burdens and litigation risk. Stability aids planning; abrupt pivots compress margins and lending capacity. Sierra Bancorp must track federal and state rulemaking calendars and comment windows.
Central Valley regional priorities
Local government emphasis on agriculture, water infrastructure and housing in the Central Valley—home to roughly 4 million residents and part of California’s agricultural base that supplies about 40% of U.S. fruits, nuts and vegetables—directly shapes Sierra Bank’s credit demand and concentration risk. County incentives and zoning changes can catalyze small-business and construction lending, while budget constraints or political turnover slow projects and dampen pipelines. Active engagement with municipal stakeholders helps tailor loan products to regional development priorities and mitigate policy-driven timing risks.

Public investment and infrastructure funding
Federal programs like NTIA BEAD with $42.45 billion for broadband and the IIJA's roughly $110 billion for roads and bridges, plus sizable state grants for water projects, can drive deposit growth and construction lending for Sierra Bank. Timing of multi-year disbursements requires active liquidity planning and staging of credit lines. Public-private project participation can diversify fee and interest income but raises underwriting and compliance demands. Sierra can target contractors and suppliers as financing partners, offering receivables, equipment loans and pledge accounts to capture project cash flows.

Trade and agricultural policy exposure
Trade tariffs, export programs and federal farm supports materially shape cash flows for San Joaquin Valley agribusiness; California farm cash receipts were about $50 billion in 2023 (CDFA), so policy shifts can quickly affect borrower liquidity and credit metrics.
Adverse tariff changes or cuts to commodity supports raise default risk, while favorable trade deals and export promotion improve margins and repayment capacity.
Political uncertainty on immigration and seasonal farm labor access also drives operational disruption; portfolio monitoring should include scenario analysis tied to policy outcomes.
- Tariffs impact export prices and margins
- Federal farm supports cushion volatility
- Immigration policy affects labor availability
- Implement policy scenario stress-testing
Cannabis and local banking stance
California permits commercial cannabis (legal market ~5.5B USD in 2023 and ~11,000 licensed businesses in 2024), but federal illegality and absence of enacted SAFE Banking reform as of July 2025 keep banking complex. County enforcement intensity and local licensing materially affect deposit opportunities and branch risk. Political momentum toward reform could cut BSA/AML costs; stalemate preserves elevated compliance burdens, so clear risk appetite and board oversight are essential.
- State market size: ~5.5B USD (2023)
- Licensed businesses: ~11,000 (2024)
- Federal reform: not enacted (July 2025)
- Key controls: explicit risk appetite, board oversight, enhanced BSA/AML
CA lenders: higher compliance/capital costs, Central Valley concentration; infra & cannabis opps
Federal/state tightening, post‑2023 regional‑bank scrutiny and CA consumer laws raise compliance/capital costs; Fed rate regime and abrupt pivots compress margins. Central Valley (≈4M population) and CA farm receipts ≈$50B (2023) drive credit concentration risk. Infrastructure funds (BEAD $42.45B; IIJA ~$110B) and cannabis market ~$5.5B (2023) create lending opportunities but higher AML/BSA costs.
| Item | 2023/2024/Jul‑2025 |
|---|---|
| Central Valley pop | ≈4,000,000 |
| CA farm receipts | $50B (2023) |
| BEAD | $42.45B |
| IIJA | ≈$110B |
| Cannabis market | $5.5B (2023); 11,000 licenses (2024) |
What is included in the product
 Detailed Word Document
Explores how macro-environmental forces uniquely affect Sierra Bank across Political, Economic, Social, Technological, Environmental and Legal dimensions, with data-backed trends, region-specific examples, forward-looking scenario insights and actionable implications to inform strategy, risk mitigation and investor communications.

 Customizable Excel Spreadsheet
A concise, visually segmented PESTLE snapshot of Sierra Bank that’s editable for local context and notes, perfect for slides, meetings, and quick cross‑team alignment on external risks and market positioning.
Economic factors

Interest rate cycle and margin
Net interest margin at Sierra Bank is highly sensitive to the Fed funds rate, which stood at 5.25–5.50% in July 2025, and to deposit betas that historically range roughly 20–60% for community banks. Rapid easing would quickly compress asset yields while a higher-for-longer rate path sustains elevated funding costs and margin pressure. Active balance sheet remixing and hedging are required to stabilize earnings, and local loan pricing must mirror competitive community-banking dynamics.
Agricultural and water-dependent economy
San Joaquin Valley output hinges on crop prices, water availability, and input costs; California supplies about half of US fruits, nuts and vegetables, so regional swings materially affect Sierra Bank portfolio performance. Strong harvests and stable water access improve repayment rates, while droughts or disease raise delinquencies. Diversification across crops and agriservices reduces concentration risk. Stress testing must include commodity price and water-supply scenarios.

Regional employment and population trends
Regional job growth concentrated in logistics (up ~3% YoY in 2024), healthcare (~2% YoY) and construction (~1.5% YoY) has supported retail deposits and consumer lending, per BLS 2024 data. Out-migration and slower household formation (homeownership ~65% in 2024, Census) have damped demand. Wage inflation (average hourly earnings +~4% YoY) raises operating costs and credit stress. Branch placement and product mix must track these local demographic shifts.

Commercial real estate cycle
Central Valley CRE shows varied risk-return: industrial tied to distribution remains resilient with vacancy around 4.0% and cap rates near 5.5% (2024–mid‑2025 market data), while office and older retail face structural headwinds and higher cap rates (~8.0% office, ~6.5% retail). Rising insurance costs (approximately +25% YoY in 2023–24) and cap‑rate expansion pressure collateral values; conservative LTVs (60–65%) and strict tenant analysis mitigate downside.
- industrial: vacancy ~4.0%, cap rate ~5.5%
- office: cap rate ~8.0%, structural decline
- retail: cap rate ~6.5%, older assets at risk
- insurance +25% YoY (2023–24)
- typical conservative LTV 60–65%
Credit quality and small business health
Small enterprises are highly sensitive to input costs, labor and financing; delinquency trends typically lag macro turns so Sierra Bank must monitor payment behavior proactively. SBA 7(a) guarantees (up to 85% for loans ≤150,000 and 75% above, max $5M) can expand lending with risk-sharing. Prudent underwriting and portfolio analytics sustain performance.
- Input costs, labor, financing sensitivity
- Delinquencies lag macro shifts — monitor
- SBA 7(a) guarantees: up to 85%/75%, max $5M
- Underwriting + analytics to sustain asset quality
CA lenders: higher compliance/capital costs, Central Valley concentration; infra & cannabis opps
NIM highly sensitive to Fed funds 5.25–5.50% (Jul 2025) and deposit betas ~20–60%, exposing margins; hedging and repricing needed. California supplies ~50% of US fruits/nuts/veg, so water/commodity swings drive ag delinquencies. Local jobs: logistics +3% YoY (2024); CRE: industrial vac ~4%, cap rates I 5.5%/O 8.0%/R 6.5%.
| Metric | Value |
|---|---|
| Fed funds (Jul 2025) | 5.25–5.50% |
| Deposit beta | 20–60% |
| CA share fruits/nuts/veg | ~50% |
| Logistics growth (2024) | +3% YoY |
| Industrial vacancy | ~4% |
| Cap rates I/O/R | 5.5% / 8.0% / 6.5% |
Preview Before You Purchase
Sierra Bank PESTLE Analysis
The Sierra Bank PESTLE Analysis preview shown here is the exact, fully formatted document you’ll receive after purchase—professionally structured and ready to use. No placeholders or teasers: the content, layout, and analysis visible are the final file you’ll download. What you see is what you’ll own upon checkout.

Plan Smarter. Present Sharper. Compete Stronger.
Understand how political shifts, economic cycles, social trends, technological advances, legal changes, and environmental factors are shaping Sierra Bank's strategic position and risk profile. Our concise PESTLE distills these external forces into actionable insights for investors, advisors, and managers. Purchase the full analysis to access detailed scenarios, data-driven implications, and ready-to-use strategic recommendations.
Political factors
State and federal banking policy direction
Federal policy tightening that pushed short-term rates above 5% and post-2023 regional-bank stresses have elevated Fed/FDIC/OCC supervisory scrutiny, raising compliance costs and capital planning for community banks. California’s pro-consumer enforcement, including the CCFPL, increases state-level compliance burdens and litigation risk. Stability aids planning; abrupt pivots compress margins and lending capacity. Sierra Bancorp must track federal and state rulemaking calendars and comment windows.
Central Valley regional priorities
Local government emphasis on agriculture, water infrastructure and housing in the Central Valley—home to roughly 4 million residents and part of California’s agricultural base that supplies about 40% of U.S. fruits, nuts and vegetables—directly shapes Sierra Bank’s credit demand and concentration risk. County incentives and zoning changes can catalyze small-business and construction lending, while budget constraints or political turnover slow projects and dampen pipelines. Active engagement with municipal stakeholders helps tailor loan products to regional development priorities and mitigate policy-driven timing risks.
Public investment and infrastructure funding
Federal programs like NTIA BEAD with $42.45 billion for broadband and the IIJA's roughly $110 billion for roads and bridges, plus sizable state grants for water projects, can drive deposit growth and construction lending for Sierra Bank. Timing of multi-year disbursements requires active liquidity planning and staging of credit lines. Public-private project participation can diversify fee and interest income but raises underwriting and compliance demands. Sierra can target contractors and suppliers as financing partners, offering receivables, equipment loans and pledge accounts to capture project cash flows.
Trade and agricultural policy exposure
Trade tariffs, export programs and federal farm supports materially shape cash flows for San Joaquin Valley agribusiness; California farm cash receipts were about $50 billion in 2023 (CDFA), so policy shifts can quickly affect borrower liquidity and credit metrics.
Adverse tariff changes or cuts to commodity supports raise default risk, while favorable trade deals and export promotion improve margins and repayment capacity.
Political uncertainty on immigration and seasonal farm labor access also drives operational disruption; portfolio monitoring should include scenario analysis tied to policy outcomes.
- Tariffs impact export prices and margins
- Federal farm supports cushion volatility
- Immigration policy affects labor availability
- Implement policy scenario stress-testing
Cannabis and local banking stance
California permits commercial cannabis (legal market ~5.5B USD in 2023 and ~11,000 licensed businesses in 2024), but federal illegality and absence of enacted SAFE Banking reform as of July 2025 keep banking complex. County enforcement intensity and local licensing materially affect deposit opportunities and branch risk. Political momentum toward reform could cut BSA/AML costs; stalemate preserves elevated compliance burdens, so clear risk appetite and board oversight are essential.
- State market size: ~5.5B USD (2023)
- Licensed businesses: ~11,000 (2024)
- Federal reform: not enacted (July 2025)
- Key controls: explicit risk appetite, board oversight, enhanced BSA/AML
CA lenders: higher compliance/capital costs, Central Valley concentration; infra & cannabis opps
Federal/state tightening, post‑2023 regional‑bank scrutiny and CA consumer laws raise compliance/capital costs; Fed rate regime and abrupt pivots compress margins. Central Valley (≈4M population) and CA farm receipts ≈$50B (2023) drive credit concentration risk. Infrastructure funds (BEAD $42.45B; IIJA ~$110B) and cannabis market ~$5.5B (2023) create lending opportunities but higher AML/BSA costs.
| Item | 2023/2024/Jul‑2025 |
|---|---|
| Central Valley pop | ≈4,000,000 |
| CA farm receipts | $50B (2023) |
| BEAD | $42.45B |
| IIJA | ≈$110B |
| Cannabis market | $5.5B (2023); 11,000 licenses (2024) |
What is included in the product
Detailed Word Document
Explores how macro-environmental forces uniquely affect Sierra Bank across Political, Economic, Social, Technological, Environmental and Legal dimensions, with data-backed trends, region-specific examples, forward-looking scenario insights and actionable implications to inform strategy, risk mitigation and investor communications.
Customizable Excel Spreadsheet
A concise, visually segmented PESTLE snapshot of Sierra Bank that’s editable for local context and notes, perfect for slides, meetings, and quick cross‑team alignment on external risks and market positioning.
Economic factors
Interest rate cycle and margin
Net interest margin at Sierra Bank is highly sensitive to the Fed funds rate, which stood at 5.25–5.50% in July 2025, and to deposit betas that historically range roughly 20–60% for community banks. Rapid easing would quickly compress asset yields while a higher-for-longer rate path sustains elevated funding costs and margin pressure. Active balance sheet remixing and hedging are required to stabilize earnings, and local loan pricing must mirror competitive community-banking dynamics.
Agricultural and water-dependent economy
San Joaquin Valley output hinges on crop prices, water availability, and input costs; California supplies about half of US fruits, nuts and vegetables, so regional swings materially affect Sierra Bank portfolio performance. Strong harvests and stable water access improve repayment rates, while droughts or disease raise delinquencies. Diversification across crops and agriservices reduces concentration risk. Stress testing must include commodity price and water-supply scenarios.
Regional employment and population trends
Regional job growth concentrated in logistics (up ~3% YoY in 2024), healthcare (~2% YoY) and construction (~1.5% YoY) has supported retail deposits and consumer lending, per BLS 2024 data. Out-migration and slower household formation (homeownership ~65% in 2024, Census) have damped demand. Wage inflation (average hourly earnings +~4% YoY) raises operating costs and credit stress. Branch placement and product mix must track these local demographic shifts.
Commercial real estate cycle
Central Valley CRE shows varied risk-return: industrial tied to distribution remains resilient with vacancy around 4.0% and cap rates near 5.5% (2024–mid‑2025 market data), while office and older retail face structural headwinds and higher cap rates (~8.0% office, ~6.5% retail). Rising insurance costs (approximately +25% YoY in 2023–24) and cap‑rate expansion pressure collateral values; conservative LTVs (60–65%) and strict tenant analysis mitigate downside.
- industrial: vacancy ~4.0%, cap rate ~5.5%
- office: cap rate ~8.0%, structural decline
- retail: cap rate ~6.5%, older assets at risk
- insurance +25% YoY (2023–24)
- typical conservative LTV 60–65%
Credit quality and small business health
Small enterprises are highly sensitive to input costs, labor and financing; delinquency trends typically lag macro turns so Sierra Bank must monitor payment behavior proactively. SBA 7(a) guarantees (up to 85% for loans ≤150,000 and 75% above, max $5M) can expand lending with risk-sharing. Prudent underwriting and portfolio analytics sustain performance.
- Input costs, labor, financing sensitivity
- Delinquencies lag macro shifts — monitor
- SBA 7(a) guarantees: up to 85%/75%, max $5M
- Underwriting + analytics to sustain asset quality
CA lenders: higher compliance/capital costs, Central Valley concentration; infra & cannabis opps
NIM highly sensitive to Fed funds 5.25–5.50% (Jul 2025) and deposit betas ~20–60%, exposing margins; hedging and repricing needed. California supplies ~50% of US fruits/nuts/veg, so water/commodity swings drive ag delinquencies. Local jobs: logistics +3% YoY (2024); CRE: industrial vac ~4%, cap rates I 5.5%/O 8.0%/R 6.5%.
| Metric | Value |
|---|---|
| Fed funds (Jul 2025) | 5.25–5.50% |
| Deposit beta | 20–60% |
| CA share fruits/nuts/veg | ~50% |
| Logistics growth (2024) | +3% YoY |
| Industrial vacancy | ~4% |
| Cap rates I/O/R | 5.5% / 8.0% / 6.5% |
Preview Before You Purchase
Sierra Bank PESTLE Analysis
The Sierra Bank PESTLE Analysis preview shown here is the exact, fully formatted document you’ll receive after purchase—professionally structured and ready to use. No placeholders or teasers: the content, layout, and analysis visible are the final file you’ll download. What you see is what you’ll own upon checkout.
Original: $10.00
-65%$10.00
$3.50Description
Plan Smarter. Present Sharper. Compete Stronger.
Understand how political shifts, economic cycles, social trends, technological advances, legal changes, and environmental factors are shaping Sierra Bank's strategic position and risk profile. Our concise PESTLE distills these external forces into actionable insights for investors, advisors, and managers. Purchase the full analysis to access detailed scenarios, data-driven implications, and ready-to-use strategic recommendations.
Political factors
State and federal banking policy direction
Federal policy tightening that pushed short-term rates above 5% and post-2023 regional-bank stresses have elevated Fed/FDIC/OCC supervisory scrutiny, raising compliance costs and capital planning for community banks. California’s pro-consumer enforcement, including the CCFPL, increases state-level compliance burdens and litigation risk. Stability aids planning; abrupt pivots compress margins and lending capacity. Sierra Bancorp must track federal and state rulemaking calendars and comment windows.
Central Valley regional priorities
Local government emphasis on agriculture, water infrastructure and housing in the Central Valley—home to roughly 4 million residents and part of California’s agricultural base that supplies about 40% of U.S. fruits, nuts and vegetables—directly shapes Sierra Bank’s credit demand and concentration risk. County incentives and zoning changes can catalyze small-business and construction lending, while budget constraints or political turnover slow projects and dampen pipelines. Active engagement with municipal stakeholders helps tailor loan products to regional development priorities and mitigate policy-driven timing risks.
Public investment and infrastructure funding
Federal programs like NTIA BEAD with $42.45 billion for broadband and the IIJA's roughly $110 billion for roads and bridges, plus sizable state grants for water projects, can drive deposit growth and construction lending for Sierra Bank. Timing of multi-year disbursements requires active liquidity planning and staging of credit lines. Public-private project participation can diversify fee and interest income but raises underwriting and compliance demands. Sierra can target contractors and suppliers as financing partners, offering receivables, equipment loans and pledge accounts to capture project cash flows.
Trade and agricultural policy exposure
Trade tariffs, export programs and federal farm supports materially shape cash flows for San Joaquin Valley agribusiness; California farm cash receipts were about $50 billion in 2023 (CDFA), so policy shifts can quickly affect borrower liquidity and credit metrics.
Adverse tariff changes or cuts to commodity supports raise default risk, while favorable trade deals and export promotion improve margins and repayment capacity.
Political uncertainty on immigration and seasonal farm labor access also drives operational disruption; portfolio monitoring should include scenario analysis tied to policy outcomes.
- Tariffs impact export prices and margins
- Federal farm supports cushion volatility
- Immigration policy affects labor availability
- Implement policy scenario stress-testing
Cannabis and local banking stance
California permits commercial cannabis (legal market ~5.5B USD in 2023 and ~11,000 licensed businesses in 2024), but federal illegality and absence of enacted SAFE Banking reform as of July 2025 keep banking complex. County enforcement intensity and local licensing materially affect deposit opportunities and branch risk. Political momentum toward reform could cut BSA/AML costs; stalemate preserves elevated compliance burdens, so clear risk appetite and board oversight are essential.
- State market size: ~5.5B USD (2023)
- Licensed businesses: ~11,000 (2024)
- Federal reform: not enacted (July 2025)
- Key controls: explicit risk appetite, board oversight, enhanced BSA/AML
CA lenders: higher compliance/capital costs, Central Valley concentration; infra & cannabis opps
Federal/state tightening, post‑2023 regional‑bank scrutiny and CA consumer laws raise compliance/capital costs; Fed rate regime and abrupt pivots compress margins. Central Valley (≈4M population) and CA farm receipts ≈$50B (2023) drive credit concentration risk. Infrastructure funds (BEAD $42.45B; IIJA ~$110B) and cannabis market ~$5.5B (2023) create lending opportunities but higher AML/BSA costs.
| Item | 2023/2024/Jul‑2025 |
|---|---|
| Central Valley pop | ≈4,000,000 |
| CA farm receipts | $50B (2023) |
| BEAD | $42.45B |
| IIJA | ≈$110B |
| Cannabis market | $5.5B (2023); 11,000 licenses (2024) |
What is included in the product
Detailed Word Document
Explores how macro-environmental forces uniquely affect Sierra Bank across Political, Economic, Social, Technological, Environmental and Legal dimensions, with data-backed trends, region-specific examples, forward-looking scenario insights and actionable implications to inform strategy, risk mitigation and investor communications.
Customizable Excel Spreadsheet
A concise, visually segmented PESTLE snapshot of Sierra Bank that’s editable for local context and notes, perfect for slides, meetings, and quick cross‑team alignment on external risks and market positioning.
Economic factors
Interest rate cycle and margin
Net interest margin at Sierra Bank is highly sensitive to the Fed funds rate, which stood at 5.25–5.50% in July 2025, and to deposit betas that historically range roughly 20–60% for community banks. Rapid easing would quickly compress asset yields while a higher-for-longer rate path sustains elevated funding costs and margin pressure. Active balance sheet remixing and hedging are required to stabilize earnings, and local loan pricing must mirror competitive community-banking dynamics.
Agricultural and water-dependent economy
San Joaquin Valley output hinges on crop prices, water availability, and input costs; California supplies about half of US fruits, nuts and vegetables, so regional swings materially affect Sierra Bank portfolio performance. Strong harvests and stable water access improve repayment rates, while droughts or disease raise delinquencies. Diversification across crops and agriservices reduces concentration risk. Stress testing must include commodity price and water-supply scenarios.
Regional employment and population trends
Regional job growth concentrated in logistics (up ~3% YoY in 2024), healthcare (~2% YoY) and construction (~1.5% YoY) has supported retail deposits and consumer lending, per BLS 2024 data. Out-migration and slower household formation (homeownership ~65% in 2024, Census) have damped demand. Wage inflation (average hourly earnings +~4% YoY) raises operating costs and credit stress. Branch placement and product mix must track these local demographic shifts.
Commercial real estate cycle
Central Valley CRE shows varied risk-return: industrial tied to distribution remains resilient with vacancy around 4.0% and cap rates near 5.5% (2024–mid‑2025 market data), while office and older retail face structural headwinds and higher cap rates (~8.0% office, ~6.5% retail). Rising insurance costs (approximately +25% YoY in 2023–24) and cap‑rate expansion pressure collateral values; conservative LTVs (60–65%) and strict tenant analysis mitigate downside.
- industrial: vacancy ~4.0%, cap rate ~5.5%
- office: cap rate ~8.0%, structural decline
- retail: cap rate ~6.5%, older assets at risk
- insurance +25% YoY (2023–24)
- typical conservative LTV 60–65%
Credit quality and small business health
Small enterprises are highly sensitive to input costs, labor and financing; delinquency trends typically lag macro turns so Sierra Bank must monitor payment behavior proactively. SBA 7(a) guarantees (up to 85% for loans ≤150,000 and 75% above, max $5M) can expand lending with risk-sharing. Prudent underwriting and portfolio analytics sustain performance.
- Input costs, labor, financing sensitivity
- Delinquencies lag macro shifts — monitor
- SBA 7(a) guarantees: up to 85%/75%, max $5M
- Underwriting + analytics to sustain asset quality
CA lenders: higher compliance/capital costs, Central Valley concentration; infra & cannabis opps
NIM highly sensitive to Fed funds 5.25–5.50% (Jul 2025) and deposit betas ~20–60%, exposing margins; hedging and repricing needed. California supplies ~50% of US fruits/nuts/veg, so water/commodity swings drive ag delinquencies. Local jobs: logistics +3% YoY (2024); CRE: industrial vac ~4%, cap rates I 5.5%/O 8.0%/R 6.5%.
| Metric | Value |
|---|---|
| Fed funds (Jul 2025) | 5.25–5.50% |
| Deposit beta | 20–60% |
| CA share fruits/nuts/veg | ~50% |
| Logistics growth (2024) | +3% YoY |
| Industrial vacancy | ~4% |
| Cap rates I/O/R | 5.5% / 8.0% / 6.5% |
Preview Before You Purchase
Sierra Bank PESTLE Analysis
The Sierra Bank PESTLE Analysis preview shown here is the exact, fully formatted document you’ll receive after purchase—professionally structured and ready to use. No placeholders or teasers: the content, layout, and analysis visible are the final file you’ll download. What you see is what you’ll own upon checkout.











