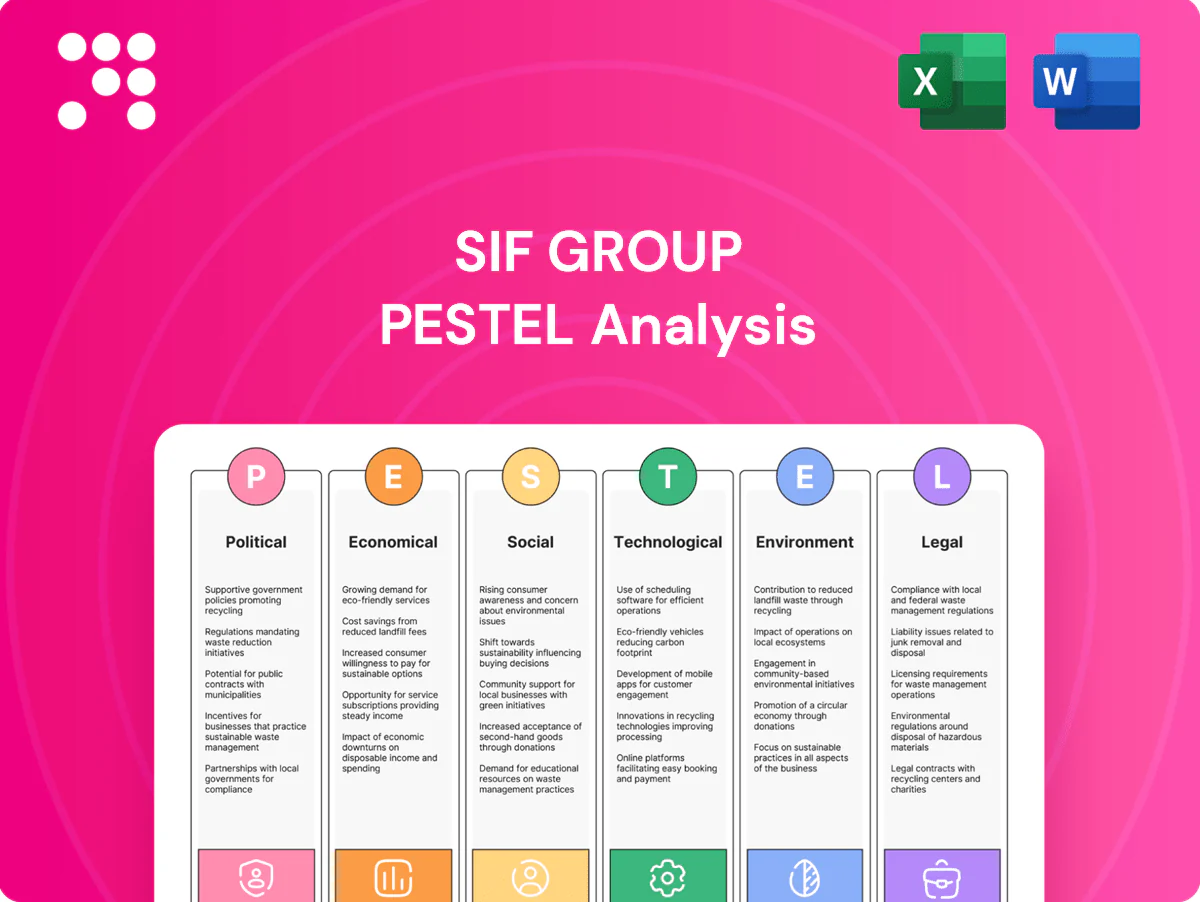
Sif Group PESTLE Analysis

Plan Smarter. Present Sharper. Compete Stronger.
Explore how political, economic, social, technological, legal and environmental forces shape Sif Group’s strategic outlook in our concise PESTLE snapshot—ideal for investors and strategists. Purchase the full analysis to unlock detailed risks, opportunities and actionable recommendations for immediate use.
Political factors

Offshore wind policy and subsidies
National and EU targets—for example UK 50 GW by 2030, Netherlands ~21 GW by 2030 and EU ambitions of ~300 GW by 2050—plus auction rounds, CfDs and rising PPAs have increased visibility for monopile demand and underpinned Sif order pipelines. Changes in subsidy regimes or auction design can accelerate or delay project pipelines, shifting revenues. Policy stability reduces order volatility and supports capacity investments; sudden pauses or renegotiations can trigger factory underutilization.
Permitting and maritime jurisdiction
Lengthy seabed leasing and environmental approvals in the North Sea commonly extend project start dates by 1–4 years, with cross-border coordination adding scheduling uncertainty; 2024 reports cited permitting-driven delays of 18–36 months on several foundation projects. Streamlined permitting can shorten order-conversion lead times by roughly 25–35%, unlocking earlier fabrication. Delays shift fabrication windows and inflate contingency buffers and cost risk. Harmonization among North Sea countries improves predictability.

Local content and industrial strategy
Governments increasingly impose local content rules via instruments like the US Inflation Reduction Act and the EU Critical Raw Materials Act, reshaping site selection, partnerships and capex for Sif. Compliance can secure regional volumes for monopiles but raises manufacturing costs and supply-chain complexity. Strategic alliances and joint ventures help meet policy thresholds while preserving production efficiency; global offshore wind capacity is forecast at ~234 GW by 2030 (GWEC).

Geopolitics and energy security
Geopolitics and energy security drive stronger demand for offshore wind and grid investments, with global offshore wind capacity exceeding 70 GW by 2023 and European decarbonisation targets accelerating projects.
Geopolitical tensions have cut EU pipeline gas from ~40% pre-2022 to ~9% in 2023, which can both divert capital away from oil & gas and temporarily revive fossil projects for supply security.
Sanctions on Russian steel since 2022 have tightened heavy plate sourcing, while policy-driven diversification and industrial resilience measures push procurement toward European manufacturers.
- offshore wind: >70 GW global (2023)
- eu gas from russia: ~40%→~9% (pre-2022 vs 2023)
- sanctions: russian steel restrictions since 2022
- trend: policy favors European manufacturing resilience
Trade policy and tariffs on steel
Trade policy—anti-dumping duties, quotas and the EU Carbon Border Adjustment Mechanism (transitional reporting 2023–2025, full pricing from 2026)—directly raises Sif Group input costs and narrows supplier choice, swinging cost competitiveness versus Asian yards. Predictable rules enable multi-year supply contracts; tariff volatility forces hedging and multi-source procurement.
- Anti-dumping/quotas: restrict suppliers
- CBAM: transitional 2023–25, pricing 2026
- Competitiveness: tariff shifts vs Asia
- Mitigation: hedging + multi-source
Auctions, permitting delays and local-content rules raise capex, margins and timing risk
Policy support (UK 50 GW by 2030, NL ~21 GW by 2030, EU targets) and stable auctions boost Sif order visibility; subsidy or auction shifts alter timing and margins. Permitting commonly delays starts 12–48 months, raising lead-time risk. Local content rules (IRA, EU CRMA) and CBAM (pricing 2026) increase capex and sourcing costs; Russian steel sanctions since 2022 tighten heavy plate supply.
| Factor | Metric/Date | Impact |
|---|---|---|
| UK target | 50 GW by 2030 | order visibility |
| Permitting | 12–48 months | schedule risk |
| CBAM | pricing 2026 | input costs |
What is included in the product
 Detailed Word Document
Explores how Political, Economic, Social, Technological, Environmental and Legal forces specifically impact Sif Group—a leading offshore wind monopile manufacturer—using data-backed trends and region/industry context to highlight risks, opportunities and forward-looking scenarios for executives, investors and strategists.

 Customizable Excel Spreadsheet
A concise, visually segmented PESTLE summary for Sif Group that streamlines external risk assessment and market positioning during meetings or planning sessions. Easily customizable and shareable for quick alignment across teams, consultants, and client-ready reports.
Economic factors

Steel plate price volatility
Monopiles require very thick plate and typically contain 600–1,200 tonnes of steel each, so plate price swings (roughly a 40% range in European HRC/plate prices since the 2021 peak per industry indices) can materially compress margins. Index-linked contracts and pass-through clauses have been used to shift volatility to clients. Strategic inventory buffers and supplier diversification reduce short-term shocks, while early cost-locking on multi-year projects secures margins.
Interest rates and project finance
Higher policy rates (Fed 5.25-5.50% and ECB deposit ~4.00% mid-2025) lift developers' WACC, prompting delayed FIDs and resized turbines as projects reoptimize capital stacks. Slower FID cadence softens near-term order intake for foundations and other balance-sheet-intensive suppliers. If rates ease, auction participation and pipeline growth typically rebound, and financing conditions directly determine factory load factors.

Exchange rates and global sales
Multi-currency revenues and inputs expose Sif Group to FX risk; with EUR/USD around 1.09 in H1 2025 a stronger euro can squeeze export competitiveness while a weaker euro improves pricing power. Natural hedging via euro-priced sales against euro inputs, plus derivatives (forward contracts reported in 2024 financial notes), help stabilise cash flows. Aligning contract currencies with input sourcing reduces mismatch and margin volatility.

Capacity utilization and operating leverage
Large fixed costs in heavy fabrication make capacity utilization critical for Sif; efficient sequencing of can-rolling, welding and coating raises margins and reduces per-unit fixed cost exposure. Lumpy mega-orders create peaks and troughs unless backlog smoothing or multi-year framework agreements ensure steady throughput.
- High fixed-cost base
- Sequencing drives margin
- Mega-order volatility
- Frameworks stabilize output
Supply chain and logistics costs
Heavy-lift transport, port slots and vessel availability remain primary drivers of delivered cost for Sif Group; disruptions in 2024 tightened slot schedules and pushed contingency margins higher. Congestion and fuel-price volatility cascade into project budgets, increasing capex risk and schedule slippage. Near-port manufacturing with deep-water access and installer collaboration mitigates logistics exposure and optimizes marshalling plans.
- 2024: slot shortages increased contingency reserves
- Near-port deep-water yards reduce transshipment steps
- Installer collaboration lowers idle-vessel risk
Auctions, permitting delays and local-content rules raise capex, margins and timing risk
Monopile steel price swings (~40% range since 2021) and 600–1,200t units materially affect margins; index-linked contracts and inventories mitigate. Mid-2025 rates (Fed 5.25–5.50%, ECB ~4.0%) raise WACC, delaying FIDs and weighing on order intake. EUR/USD ~1.09 H1 2025 and 2024 slot shortages increased logistics contingency.
| Metric | Value |
|---|---|
| Monopile steel per unit | 600–1,200 t |
| Steel price swing | ~40% since 2021 |
| Policy rates mid-2025 | Fed 5.25–5.50%, ECB ~4.0% |
| FX H1 2025 | EUR/USD ~1.09 |
| 2024 logistics | slot shortages ↑ contingency |
Preview Before You Purchase
Sif Group PESTLE Analysis
The preview of the Sif Group PESTLE Analysis is the exact document you’ll receive after purchase—fully formatted, professionally structured and ready to use. This is the final version with no placeholders or teasers, delivered exactly as shown. After payment you’ll be able to download this same file instantly.

Plan Smarter. Present Sharper. Compete Stronger.
Explore how political, economic, social, technological, legal and environmental forces shape Sif Group’s strategic outlook in our concise PESTLE snapshot—ideal for investors and strategists. Purchase the full analysis to unlock detailed risks, opportunities and actionable recommendations for immediate use.
Political factors
Offshore wind policy and subsidies
National and EU targets—for example UK 50 GW by 2030, Netherlands ~21 GW by 2030 and EU ambitions of ~300 GW by 2050—plus auction rounds, CfDs and rising PPAs have increased visibility for monopile demand and underpinned Sif order pipelines. Changes in subsidy regimes or auction design can accelerate or delay project pipelines, shifting revenues. Policy stability reduces order volatility and supports capacity investments; sudden pauses or renegotiations can trigger factory underutilization.
Permitting and maritime jurisdiction
Lengthy seabed leasing and environmental approvals in the North Sea commonly extend project start dates by 1–4 years, with cross-border coordination adding scheduling uncertainty; 2024 reports cited permitting-driven delays of 18–36 months on several foundation projects. Streamlined permitting can shorten order-conversion lead times by roughly 25–35%, unlocking earlier fabrication. Delays shift fabrication windows and inflate contingency buffers and cost risk. Harmonization among North Sea countries improves predictability.
Local content and industrial strategy
Governments increasingly impose local content rules via instruments like the US Inflation Reduction Act and the EU Critical Raw Materials Act, reshaping site selection, partnerships and capex for Sif. Compliance can secure regional volumes for monopiles but raises manufacturing costs and supply-chain complexity. Strategic alliances and joint ventures help meet policy thresholds while preserving production efficiency; global offshore wind capacity is forecast at ~234 GW by 2030 (GWEC).
Geopolitics and energy security
Geopolitics and energy security drive stronger demand for offshore wind and grid investments, with global offshore wind capacity exceeding 70 GW by 2023 and European decarbonisation targets accelerating projects.
Geopolitical tensions have cut EU pipeline gas from ~40% pre-2022 to ~9% in 2023, which can both divert capital away from oil & gas and temporarily revive fossil projects for supply security.
Sanctions on Russian steel since 2022 have tightened heavy plate sourcing, while policy-driven diversification and industrial resilience measures push procurement toward European manufacturers.
- offshore wind: >70 GW global (2023)
- eu gas from russia: ~40%→~9% (pre-2022 vs 2023)
- sanctions: russian steel restrictions since 2022
- trend: policy favors European manufacturing resilience
Trade policy and tariffs on steel
Trade policy—anti-dumping duties, quotas and the EU Carbon Border Adjustment Mechanism (transitional reporting 2023–2025, full pricing from 2026)—directly raises Sif Group input costs and narrows supplier choice, swinging cost competitiveness versus Asian yards. Predictable rules enable multi-year supply contracts; tariff volatility forces hedging and multi-source procurement.
- Anti-dumping/quotas: restrict suppliers
- CBAM: transitional 2023–25, pricing 2026
- Competitiveness: tariff shifts vs Asia
- Mitigation: hedging + multi-source
Auctions, permitting delays and local-content rules raise capex, margins and timing risk
Policy support (UK 50 GW by 2030, NL ~21 GW by 2030, EU targets) and stable auctions boost Sif order visibility; subsidy or auction shifts alter timing and margins. Permitting commonly delays starts 12–48 months, raising lead-time risk. Local content rules (IRA, EU CRMA) and CBAM (pricing 2026) increase capex and sourcing costs; Russian steel sanctions since 2022 tighten heavy plate supply.
| Factor | Metric/Date | Impact |
|---|---|---|
| UK target | 50 GW by 2030 | order visibility |
| Permitting | 12–48 months | schedule risk |
| CBAM | pricing 2026 | input costs |
What is included in the product
Detailed Word Document
Explores how Political, Economic, Social, Technological, Environmental and Legal forces specifically impact Sif Group—a leading offshore wind monopile manufacturer—using data-backed trends and region/industry context to highlight risks, opportunities and forward-looking scenarios for executives, investors and strategists.
Customizable Excel Spreadsheet
A concise, visually segmented PESTLE summary for Sif Group that streamlines external risk assessment and market positioning during meetings or planning sessions. Easily customizable and shareable for quick alignment across teams, consultants, and client-ready reports.
Economic factors
Steel plate price volatility
Monopiles require very thick plate and typically contain 600–1,200 tonnes of steel each, so plate price swings (roughly a 40% range in European HRC/plate prices since the 2021 peak per industry indices) can materially compress margins. Index-linked contracts and pass-through clauses have been used to shift volatility to clients. Strategic inventory buffers and supplier diversification reduce short-term shocks, while early cost-locking on multi-year projects secures margins.
Interest rates and project finance
Higher policy rates (Fed 5.25-5.50% and ECB deposit ~4.00% mid-2025) lift developers' WACC, prompting delayed FIDs and resized turbines as projects reoptimize capital stacks. Slower FID cadence softens near-term order intake for foundations and other balance-sheet-intensive suppliers. If rates ease, auction participation and pipeline growth typically rebound, and financing conditions directly determine factory load factors.
Exchange rates and global sales
Multi-currency revenues and inputs expose Sif Group to FX risk; with EUR/USD around 1.09 in H1 2025 a stronger euro can squeeze export competitiveness while a weaker euro improves pricing power. Natural hedging via euro-priced sales against euro inputs, plus derivatives (forward contracts reported in 2024 financial notes), help stabilise cash flows. Aligning contract currencies with input sourcing reduces mismatch and margin volatility.
Capacity utilization and operating leverage
Large fixed costs in heavy fabrication make capacity utilization critical for Sif; efficient sequencing of can-rolling, welding and coating raises margins and reduces per-unit fixed cost exposure. Lumpy mega-orders create peaks and troughs unless backlog smoothing or multi-year framework agreements ensure steady throughput.
- High fixed-cost base
- Sequencing drives margin
- Mega-order volatility
- Frameworks stabilize output
Supply chain and logistics costs
Heavy-lift transport, port slots and vessel availability remain primary drivers of delivered cost for Sif Group; disruptions in 2024 tightened slot schedules and pushed contingency margins higher. Congestion and fuel-price volatility cascade into project budgets, increasing capex risk and schedule slippage. Near-port manufacturing with deep-water access and installer collaboration mitigates logistics exposure and optimizes marshalling plans.
- 2024: slot shortages increased contingency reserves
- Near-port deep-water yards reduce transshipment steps
- Installer collaboration lowers idle-vessel risk
Auctions, permitting delays and local-content rules raise capex, margins and timing risk
Monopile steel price swings (~40% range since 2021) and 600–1,200t units materially affect margins; index-linked contracts and inventories mitigate. Mid-2025 rates (Fed 5.25–5.50%, ECB ~4.0%) raise WACC, delaying FIDs and weighing on order intake. EUR/USD ~1.09 H1 2025 and 2024 slot shortages increased logistics contingency.
| Metric | Value |
|---|---|
| Monopile steel per unit | 600–1,200 t |
| Steel price swing | ~40% since 2021 |
| Policy rates mid-2025 | Fed 5.25–5.50%, ECB ~4.0% |
| FX H1 2025 | EUR/USD ~1.09 |
| 2024 logistics | slot shortages ↑ contingency |
Preview Before You Purchase
Sif Group PESTLE Analysis
The preview of the Sif Group PESTLE Analysis is the exact document you’ll receive after purchase—fully formatted, professionally structured and ready to use. This is the final version with no placeholders or teasers, delivered exactly as shown. After payment you’ll be able to download this same file instantly.
Original: $10.00
-65%$10.00
$3.50Description
Plan Smarter. Present Sharper. Compete Stronger.
Explore how political, economic, social, technological, legal and environmental forces shape Sif Group’s strategic outlook in our concise PESTLE snapshot—ideal for investors and strategists. Purchase the full analysis to unlock detailed risks, opportunities and actionable recommendations for immediate use.
Political factors
Offshore wind policy and subsidies
National and EU targets—for example UK 50 GW by 2030, Netherlands ~21 GW by 2030 and EU ambitions of ~300 GW by 2050—plus auction rounds, CfDs and rising PPAs have increased visibility for monopile demand and underpinned Sif order pipelines. Changes in subsidy regimes or auction design can accelerate or delay project pipelines, shifting revenues. Policy stability reduces order volatility and supports capacity investments; sudden pauses or renegotiations can trigger factory underutilization.
Permitting and maritime jurisdiction
Lengthy seabed leasing and environmental approvals in the North Sea commonly extend project start dates by 1–4 years, with cross-border coordination adding scheduling uncertainty; 2024 reports cited permitting-driven delays of 18–36 months on several foundation projects. Streamlined permitting can shorten order-conversion lead times by roughly 25–35%, unlocking earlier fabrication. Delays shift fabrication windows and inflate contingency buffers and cost risk. Harmonization among North Sea countries improves predictability.
Local content and industrial strategy
Governments increasingly impose local content rules via instruments like the US Inflation Reduction Act and the EU Critical Raw Materials Act, reshaping site selection, partnerships and capex for Sif. Compliance can secure regional volumes for monopiles but raises manufacturing costs and supply-chain complexity. Strategic alliances and joint ventures help meet policy thresholds while preserving production efficiency; global offshore wind capacity is forecast at ~234 GW by 2030 (GWEC).
Geopolitics and energy security
Geopolitics and energy security drive stronger demand for offshore wind and grid investments, with global offshore wind capacity exceeding 70 GW by 2023 and European decarbonisation targets accelerating projects.
Geopolitical tensions have cut EU pipeline gas from ~40% pre-2022 to ~9% in 2023, which can both divert capital away from oil & gas and temporarily revive fossil projects for supply security.
Sanctions on Russian steel since 2022 have tightened heavy plate sourcing, while policy-driven diversification and industrial resilience measures push procurement toward European manufacturers.
- offshore wind: >70 GW global (2023)
- eu gas from russia: ~40%→~9% (pre-2022 vs 2023)
- sanctions: russian steel restrictions since 2022
- trend: policy favors European manufacturing resilience
Trade policy and tariffs on steel
Trade policy—anti-dumping duties, quotas and the EU Carbon Border Adjustment Mechanism (transitional reporting 2023–2025, full pricing from 2026)—directly raises Sif Group input costs and narrows supplier choice, swinging cost competitiveness versus Asian yards. Predictable rules enable multi-year supply contracts; tariff volatility forces hedging and multi-source procurement.
- Anti-dumping/quotas: restrict suppliers
- CBAM: transitional 2023–25, pricing 2026
- Competitiveness: tariff shifts vs Asia
- Mitigation: hedging + multi-source
Auctions, permitting delays and local-content rules raise capex, margins and timing risk
Policy support (UK 50 GW by 2030, NL ~21 GW by 2030, EU targets) and stable auctions boost Sif order visibility; subsidy or auction shifts alter timing and margins. Permitting commonly delays starts 12–48 months, raising lead-time risk. Local content rules (IRA, EU CRMA) and CBAM (pricing 2026) increase capex and sourcing costs; Russian steel sanctions since 2022 tighten heavy plate supply.
| Factor | Metric/Date | Impact |
|---|---|---|
| UK target | 50 GW by 2030 | order visibility |
| Permitting | 12–48 months | schedule risk |
| CBAM | pricing 2026 | input costs |
What is included in the product
Detailed Word Document
Explores how Political, Economic, Social, Technological, Environmental and Legal forces specifically impact Sif Group—a leading offshore wind monopile manufacturer—using data-backed trends and region/industry context to highlight risks, opportunities and forward-looking scenarios for executives, investors and strategists.
Customizable Excel Spreadsheet
A concise, visually segmented PESTLE summary for Sif Group that streamlines external risk assessment and market positioning during meetings or planning sessions. Easily customizable and shareable for quick alignment across teams, consultants, and client-ready reports.
Economic factors
Steel plate price volatility
Monopiles require very thick plate and typically contain 600–1,200 tonnes of steel each, so plate price swings (roughly a 40% range in European HRC/plate prices since the 2021 peak per industry indices) can materially compress margins. Index-linked contracts and pass-through clauses have been used to shift volatility to clients. Strategic inventory buffers and supplier diversification reduce short-term shocks, while early cost-locking on multi-year projects secures margins.
Interest rates and project finance
Higher policy rates (Fed 5.25-5.50% and ECB deposit ~4.00% mid-2025) lift developers' WACC, prompting delayed FIDs and resized turbines as projects reoptimize capital stacks. Slower FID cadence softens near-term order intake for foundations and other balance-sheet-intensive suppliers. If rates ease, auction participation and pipeline growth typically rebound, and financing conditions directly determine factory load factors.
Exchange rates and global sales
Multi-currency revenues and inputs expose Sif Group to FX risk; with EUR/USD around 1.09 in H1 2025 a stronger euro can squeeze export competitiveness while a weaker euro improves pricing power. Natural hedging via euro-priced sales against euro inputs, plus derivatives (forward contracts reported in 2024 financial notes), help stabilise cash flows. Aligning contract currencies with input sourcing reduces mismatch and margin volatility.
Capacity utilization and operating leverage
Large fixed costs in heavy fabrication make capacity utilization critical for Sif; efficient sequencing of can-rolling, welding and coating raises margins and reduces per-unit fixed cost exposure. Lumpy mega-orders create peaks and troughs unless backlog smoothing or multi-year framework agreements ensure steady throughput.
- High fixed-cost base
- Sequencing drives margin
- Mega-order volatility
- Frameworks stabilize output
Supply chain and logistics costs
Heavy-lift transport, port slots and vessel availability remain primary drivers of delivered cost for Sif Group; disruptions in 2024 tightened slot schedules and pushed contingency margins higher. Congestion and fuel-price volatility cascade into project budgets, increasing capex risk and schedule slippage. Near-port manufacturing with deep-water access and installer collaboration mitigates logistics exposure and optimizes marshalling plans.
- 2024: slot shortages increased contingency reserves
- Near-port deep-water yards reduce transshipment steps
- Installer collaboration lowers idle-vessel risk
Auctions, permitting delays and local-content rules raise capex, margins and timing risk
Monopile steel price swings (~40% range since 2021) and 600–1,200t units materially affect margins; index-linked contracts and inventories mitigate. Mid-2025 rates (Fed 5.25–5.50%, ECB ~4.0%) raise WACC, delaying FIDs and weighing on order intake. EUR/USD ~1.09 H1 2025 and 2024 slot shortages increased logistics contingency.
| Metric | Value |
|---|---|
| Monopile steel per unit | 600–1,200 t |
| Steel price swing | ~40% since 2021 |
| Policy rates mid-2025 | Fed 5.25–5.50%, ECB ~4.0% |
| FX H1 2025 | EUR/USD ~1.09 |
| 2024 logistics | slot shortages ↑ contingency |
Preview Before You Purchase
Sif Group PESTLE Analysis
The preview of the Sif Group PESTLE Analysis is the exact document you’ll receive after purchase—fully formatted, professionally structured and ready to use. This is the final version with no placeholders or teasers, delivered exactly as shown. After payment you’ll be able to download this same file instantly.











