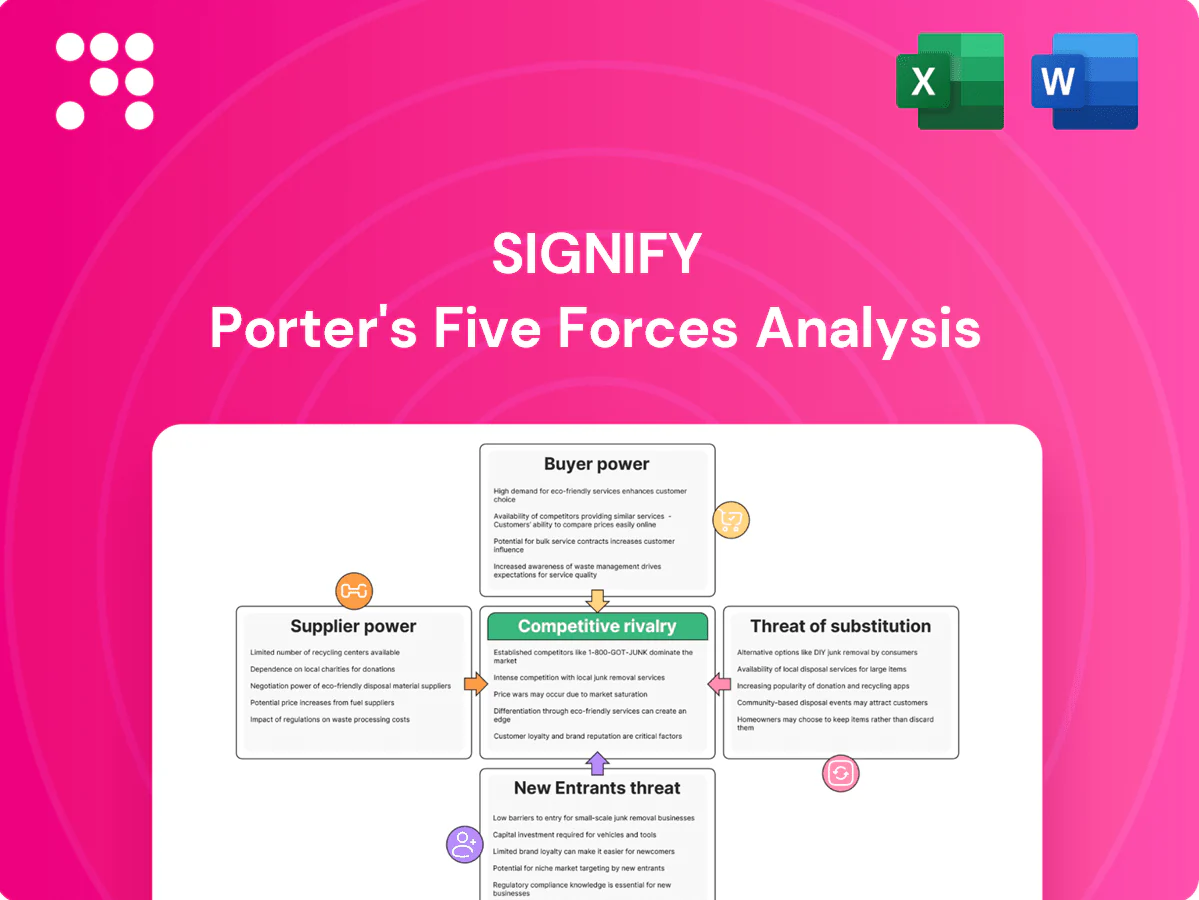
Signify Porter's Five Forces Analysis

A Must-Have Tool for Decision-Makers
Signify faces moderate supplier power, intense rivalry in lighting and smart-home segments, growing buyer expectations, and rising substitute threats from LED and IoT platforms. Regulatory shifts and scale advantages shape industry entry barriers. This snapshot only scratches the surface. Unlock the full Porter's Five Forces Analysis to explore Signify’s competitive dynamics in detail.
Suppliers Bargaining Power

LED chip and driver concentration
Core LED emitters and driver ICs remain concentrated: in 2024 the top global LED chip and driver vendors together controlled roughly 60%–70% of supply, giving them pricing and allocation leverage that can drive input cost volatility for Signify. Shortages historically reroute supply to high-volume buyers or premium segments, squeezing margins. Signify offsets risk with multi-sourcing, long-term contracts and in-house design teams. Rapid tech shifts (efficacy, color tuning, UV-C) can shift bargaining power to innovators.
Specialty optics, phosphors, and materials
Specialty optics, phosphors, thermal interfaces and recyclables are niche inputs with fewer qualified vendors; in 2024 the global specialty phosphors and rare-earth materials market exceeded USD 1 billion, concentrating supply among a handful of firms. Long qualification cycles and certifications raise switching costs, giving select suppliers pricing and lead-time power. Signify mitigates risk via dual-qualification and platforming components to dilute supplier influence.

IoT, cloud, and cybersecurity dependencies
Smart lighting relies on modules, sensors, connectivity stacks and hyperscale cloud services; 2024 connected IoT devices are estimated at about 15.1 billion. Dependence on firmware/IP licensors and hyperscalers (AWS ~33%, Microsoft ~22%, Google ~12% in 2024) shifts economics and roadmap control toward suppliers. Vendor lock-in risks elevate supplier power in software layers while global cybersecurity spend in 2024 reached roughly $188 billion, raising security-dependency costs. Open standards, modular architecture and hybrid cloud options help rebalance.

Logistics, energy, and commodity volatility
Metals, plastics and energy swings materially shift BOM and margins; materials can represent roughly 25–35% of manufacturing cost, while energy spikes drive margin pressure on low-margin lighting products. Freight disruptions and regionalization elevate logistics partners and local suppliers, but Signify’s 2024 global footprint across 70+ countries and 30+ manufacturing/assembly sites reduces single-point exposure at the cost of added supply-chain complexity. Hedging, vendor-managed inventory and multi-sourcing programs temper supplier price power and volatility.
- Metals/plastics: 25–35% of BOM
- Global footprint: 70+ countries, 30+ sites (2024)
- Freight/regionalization: increases logistics supplier leverage
- Mitigants: hedging, VMI, nearshoring, multi-sourcing
Sustainability and compliance requirements
Sustainability and compliance requirements—eco-design, EPR, RoHS/REACH and stringent ESG targets—shrink Signify’s eligible supplier pool by enforcing material, chemical and end‑of‑life standards. Audited traceability and use of circular materials let compliant vendors command premium bargaining power. Signify’s leadership in sustainability raises dependency on top-tier suppliers, while long‑term collaborations align incentives and reduce risk premia.
- Eco-design narrows inputs
- EPR/RoHS/REACH demand audited traceability
- Circular materials increase vendor leverage
- Long-term ties lower supply risk
Supplier power medium-high: chip concentration, cloud lock-in, material BOM pressure
Supplier power is medium-high: LED chip/driver concentration (60–70% in 2024) and specialty phosphors (>USD 1bn market) raise input leverage; software/cloud reliance (15.1bn IoT devices; AWS 33%, MS 22%, Google 12% in 2024) and materials (25–35% BOM) add switch costs; Signify mitigates via multi-sourcing, platforming, long contracts and 70+ country footprint (30+ sites).
| Factor | 2024 data | Impact |
|---|---|---|
| LED chips | 60–70% supply | Pricing power |
| Phosphors | >USD 1bn market | High switch cost |
| Cloud/IoT | 15.1bn; AWS33/MS22/G12 | Vendor lock-in |
| Materials | 25–35% BOM | Margin sensitivity |
What is included in the product
 Detailed Word Document
Concise Porter's Five Forces analysis of Signify identifying competitive rivalry, buyer and supplier power, threat of new entrants and substitutes, and regulatory pressures, with actionable insights on pricing, margins, and strategic defenses to protect market share.

 Customizable Excel Spreadsheet
A concise one-sheet Porter's Five Forces for Signify highlighting supplier and buyer power, entry barriers, substitutes and competitive rivalry—ideal for rapid strategic decisions and slide-ready summaries to relieve analysis bottlenecks.
Customers Bargaining Power

Large tenders and procurement scale
Municipalities, corporates and large real estate portfolios procure lighting via competitive RFPs and framework agreements, with public procurement representing about 12% of OECD GDP in 2024, amplifying volume-based price pressure and service demands. Framework and performance-based contracts further raise buyer leverage by tying payments to outcomes. Signify mitigates this through turnkey delivery, integrated IoT platforms and performance guarantees tied to energy savings and uptime.
Price transparency and LED commoditization
Visible benchmarks for LED components and fixtures intensify price negotiations as buyers can compare SKUs and switch brands quickly, compressing margins in commodity segments. In 2024 many LEDs exceed 150 lm/W and lifetimes of 25,000–50,000 hours, so efficacy, warranty and service become key differentiators. Signify leverages quality and reliability data, TCO models (showing up to ~50% energy savings vs legacy lighting) and warranties up to 5 years to defend value.

Switching costs via connected ecosystems
Once Interact or other platforms are deployed, integration and training create meaningful switching costs: implementations typically span months and tie operations to Signify workflows. APIs, analytics and SLAs embed Signify deeper into facilities management, reducing buyer power over time in smart systems. As of 2024 Signify reported hundreds of enterprise Interact deployments, though open integrations preserve leverage for sophisticated buyers.

Channel intermediaries and specifiers
Distributors, ESCOs and lighting designers materially shape Signify’s pricing and brand selection by controlling project pipelines and end-customer access; channel partners can account for 30–50% of commercial project wins and negotiate rebates of roughly 2–8% in 2024. Signify’s broad portfolio and brand equity supported preferred placement in 2024 tenders and inventory programs, sustaining margin resilience.
- Channel reach: distributors/ESCOs drive 30–50% of projects
- Incentives: typical rebates/co-marketing 2–8% (2024)
- Advantage: Signify’s 2024 global scale and brand equity secure preferred placement
TCO and sustainability-driven negotiations
Buyers now prioritize demonstrable energy savings, lower maintenance and carbon cuts; lighting accounts for roughly 15% of global electricity use (IEA) and LEDs can cut energy use by up to 80% and maintenance needs by up to 70%, shifting negotiations to TCO and ESG outcomes. Proven lifecycle savings moderate upfront price pressure, while performance contracts and guarantees strengthen Signify’s leverage in bids.
- Energy savings: up to 80%
- Maintenance reduction: up to 70%
- Lighting share of electricity: ~15% (IEA)
- Performance contracts: increase buyer confidence
Public procurement (~12% OECD GDP) and >150 lm/W LEDs shift focus to TCO
Large public and corporate buyers (public procurement ~12% of OECD GDP in 2024) drive volume pricing and outcome-based contracts, pressuring margins. Visible LED benchmarks (many >150 lm/W, 25k–50k hrs in 2024) shift focus to TCO, warranties (up to 5 yrs) and energy/maintenance savings. Channels (30–50% project influence) negotiate 2–8% rebates, while Interact deployments raise switching costs.
| Metric | 2024 Value |
|---|---|
| Public procurement | ~12% OECD GDP |
| LED efficacy | >150 lm/W |
| Channel influence | 30–50% |
| Typical rebates | 2–8% |
| Energy savings | up to 80% |
Preview Before You Purchase
Signify Porter's Five Forces Analysis
This preview shows the exact Signify Porter's Five Forces analysis you'll receive immediately after purchase—no placeholders or mockups. It is the full, professionally formatted document, ready for download and use the moment you buy. What you see is what you get.

A Must-Have Tool for Decision-Makers
Signify faces moderate supplier power, intense rivalry in lighting and smart-home segments, growing buyer expectations, and rising substitute threats from LED and IoT platforms. Regulatory shifts and scale advantages shape industry entry barriers. This snapshot only scratches the surface. Unlock the full Porter's Five Forces Analysis to explore Signify’s competitive dynamics in detail.
Suppliers Bargaining Power
LED chip and driver concentration
Core LED emitters and driver ICs remain concentrated: in 2024 the top global LED chip and driver vendors together controlled roughly 60%–70% of supply, giving them pricing and allocation leverage that can drive input cost volatility for Signify. Shortages historically reroute supply to high-volume buyers or premium segments, squeezing margins. Signify offsets risk with multi-sourcing, long-term contracts and in-house design teams. Rapid tech shifts (efficacy, color tuning, UV-C) can shift bargaining power to innovators.
Specialty optics, phosphors, and materials
Specialty optics, phosphors, thermal interfaces and recyclables are niche inputs with fewer qualified vendors; in 2024 the global specialty phosphors and rare-earth materials market exceeded USD 1 billion, concentrating supply among a handful of firms. Long qualification cycles and certifications raise switching costs, giving select suppliers pricing and lead-time power. Signify mitigates risk via dual-qualification and platforming components to dilute supplier influence.
IoT, cloud, and cybersecurity dependencies
Smart lighting relies on modules, sensors, connectivity stacks and hyperscale cloud services; 2024 connected IoT devices are estimated at about 15.1 billion. Dependence on firmware/IP licensors and hyperscalers (AWS ~33%, Microsoft ~22%, Google ~12% in 2024) shifts economics and roadmap control toward suppliers. Vendor lock-in risks elevate supplier power in software layers while global cybersecurity spend in 2024 reached roughly $188 billion, raising security-dependency costs. Open standards, modular architecture and hybrid cloud options help rebalance.
Logistics, energy, and commodity volatility
Metals, plastics and energy swings materially shift BOM and margins; materials can represent roughly 25–35% of manufacturing cost, while energy spikes drive margin pressure on low-margin lighting products. Freight disruptions and regionalization elevate logistics partners and local suppliers, but Signify’s 2024 global footprint across 70+ countries and 30+ manufacturing/assembly sites reduces single-point exposure at the cost of added supply-chain complexity. Hedging, vendor-managed inventory and multi-sourcing programs temper supplier price power and volatility.
- Metals/plastics: 25–35% of BOM
- Global footprint: 70+ countries, 30+ sites (2024)
- Freight/regionalization: increases logistics supplier leverage
- Mitigants: hedging, VMI, nearshoring, multi-sourcing
Sustainability and compliance requirements
Sustainability and compliance requirements—eco-design, EPR, RoHS/REACH and stringent ESG targets—shrink Signify’s eligible supplier pool by enforcing material, chemical and end‑of‑life standards. Audited traceability and use of circular materials let compliant vendors command premium bargaining power. Signify’s leadership in sustainability raises dependency on top-tier suppliers, while long‑term collaborations align incentives and reduce risk premia.
- Eco-design narrows inputs
- EPR/RoHS/REACH demand audited traceability
- Circular materials increase vendor leverage
- Long-term ties lower supply risk
Supplier power medium-high: chip concentration, cloud lock-in, material BOM pressure
Supplier power is medium-high: LED chip/driver concentration (60–70% in 2024) and specialty phosphors (>USD 1bn market) raise input leverage; software/cloud reliance (15.1bn IoT devices; AWS 33%, MS 22%, Google 12% in 2024) and materials (25–35% BOM) add switch costs; Signify mitigates via multi-sourcing, platforming, long contracts and 70+ country footprint (30+ sites).
| Factor | 2024 data | Impact |
|---|---|---|
| LED chips | 60–70% supply | Pricing power |
| Phosphors | >USD 1bn market | High switch cost |
| Cloud/IoT | 15.1bn; AWS33/MS22/G12 | Vendor lock-in |
| Materials | 25–35% BOM | Margin sensitivity |
What is included in the product
Detailed Word Document
Concise Porter's Five Forces analysis of Signify identifying competitive rivalry, buyer and supplier power, threat of new entrants and substitutes, and regulatory pressures, with actionable insights on pricing, margins, and strategic defenses to protect market share.
Customizable Excel Spreadsheet
A concise one-sheet Porter's Five Forces for Signify highlighting supplier and buyer power, entry barriers, substitutes and competitive rivalry—ideal for rapid strategic decisions and slide-ready summaries to relieve analysis bottlenecks.
Customers Bargaining Power
Large tenders and procurement scale
Municipalities, corporates and large real estate portfolios procure lighting via competitive RFPs and framework agreements, with public procurement representing about 12% of OECD GDP in 2024, amplifying volume-based price pressure and service demands. Framework and performance-based contracts further raise buyer leverage by tying payments to outcomes. Signify mitigates this through turnkey delivery, integrated IoT platforms and performance guarantees tied to energy savings and uptime.
Price transparency and LED commoditization
Visible benchmarks for LED components and fixtures intensify price negotiations as buyers can compare SKUs and switch brands quickly, compressing margins in commodity segments. In 2024 many LEDs exceed 150 lm/W and lifetimes of 25,000–50,000 hours, so efficacy, warranty and service become key differentiators. Signify leverages quality and reliability data, TCO models (showing up to ~50% energy savings vs legacy lighting) and warranties up to 5 years to defend value.
Switching costs via connected ecosystems
Once Interact or other platforms are deployed, integration and training create meaningful switching costs: implementations typically span months and tie operations to Signify workflows. APIs, analytics and SLAs embed Signify deeper into facilities management, reducing buyer power over time in smart systems. As of 2024 Signify reported hundreds of enterprise Interact deployments, though open integrations preserve leverage for sophisticated buyers.
Channel intermediaries and specifiers
Distributors, ESCOs and lighting designers materially shape Signify’s pricing and brand selection by controlling project pipelines and end-customer access; channel partners can account for 30–50% of commercial project wins and negotiate rebates of roughly 2–8% in 2024. Signify’s broad portfolio and brand equity supported preferred placement in 2024 tenders and inventory programs, sustaining margin resilience.
- Channel reach: distributors/ESCOs drive 30–50% of projects
- Incentives: typical rebates/co-marketing 2–8% (2024)
- Advantage: Signify’s 2024 global scale and brand equity secure preferred placement
TCO and sustainability-driven negotiations
Buyers now prioritize demonstrable energy savings, lower maintenance and carbon cuts; lighting accounts for roughly 15% of global electricity use (IEA) and LEDs can cut energy use by up to 80% and maintenance needs by up to 70%, shifting negotiations to TCO and ESG outcomes. Proven lifecycle savings moderate upfront price pressure, while performance contracts and guarantees strengthen Signify’s leverage in bids.
- Energy savings: up to 80%
- Maintenance reduction: up to 70%
- Lighting share of electricity: ~15% (IEA)
- Performance contracts: increase buyer confidence
Public procurement (~12% OECD GDP) and >150 lm/W LEDs shift focus to TCO
Large public and corporate buyers (public procurement ~12% of OECD GDP in 2024) drive volume pricing and outcome-based contracts, pressuring margins. Visible LED benchmarks (many >150 lm/W, 25k–50k hrs in 2024) shift focus to TCO, warranties (up to 5 yrs) and energy/maintenance savings. Channels (30–50% project influence) negotiate 2–8% rebates, while Interact deployments raise switching costs.
| Metric | 2024 Value |
|---|---|
| Public procurement | ~12% OECD GDP |
| LED efficacy | >150 lm/W |
| Channel influence | 30–50% |
| Typical rebates | 2–8% |
| Energy savings | up to 80% |
Preview Before You Purchase
Signify Porter's Five Forces Analysis
This preview shows the exact Signify Porter's Five Forces analysis you'll receive immediately after purchase—no placeholders or mockups. It is the full, professionally formatted document, ready for download and use the moment you buy. What you see is what you get.
Original: $10.00
-65%$10.00
$3.50Description
A Must-Have Tool for Decision-Makers
Signify faces moderate supplier power, intense rivalry in lighting and smart-home segments, growing buyer expectations, and rising substitute threats from LED and IoT platforms. Regulatory shifts and scale advantages shape industry entry barriers. This snapshot only scratches the surface. Unlock the full Porter's Five Forces Analysis to explore Signify’s competitive dynamics in detail.
Suppliers Bargaining Power
LED chip and driver concentration
Core LED emitters and driver ICs remain concentrated: in 2024 the top global LED chip and driver vendors together controlled roughly 60%–70% of supply, giving them pricing and allocation leverage that can drive input cost volatility for Signify. Shortages historically reroute supply to high-volume buyers or premium segments, squeezing margins. Signify offsets risk with multi-sourcing, long-term contracts and in-house design teams. Rapid tech shifts (efficacy, color tuning, UV-C) can shift bargaining power to innovators.
Specialty optics, phosphors, and materials
Specialty optics, phosphors, thermal interfaces and recyclables are niche inputs with fewer qualified vendors; in 2024 the global specialty phosphors and rare-earth materials market exceeded USD 1 billion, concentrating supply among a handful of firms. Long qualification cycles and certifications raise switching costs, giving select suppliers pricing and lead-time power. Signify mitigates risk via dual-qualification and platforming components to dilute supplier influence.
IoT, cloud, and cybersecurity dependencies
Smart lighting relies on modules, sensors, connectivity stacks and hyperscale cloud services; 2024 connected IoT devices are estimated at about 15.1 billion. Dependence on firmware/IP licensors and hyperscalers (AWS ~33%, Microsoft ~22%, Google ~12% in 2024) shifts economics and roadmap control toward suppliers. Vendor lock-in risks elevate supplier power in software layers while global cybersecurity spend in 2024 reached roughly $188 billion, raising security-dependency costs. Open standards, modular architecture and hybrid cloud options help rebalance.
Logistics, energy, and commodity volatility
Metals, plastics and energy swings materially shift BOM and margins; materials can represent roughly 25–35% of manufacturing cost, while energy spikes drive margin pressure on low-margin lighting products. Freight disruptions and regionalization elevate logistics partners and local suppliers, but Signify’s 2024 global footprint across 70+ countries and 30+ manufacturing/assembly sites reduces single-point exposure at the cost of added supply-chain complexity. Hedging, vendor-managed inventory and multi-sourcing programs temper supplier price power and volatility.
- Metals/plastics: 25–35% of BOM
- Global footprint: 70+ countries, 30+ sites (2024)
- Freight/regionalization: increases logistics supplier leverage
- Mitigants: hedging, VMI, nearshoring, multi-sourcing
Sustainability and compliance requirements
Sustainability and compliance requirements—eco-design, EPR, RoHS/REACH and stringent ESG targets—shrink Signify’s eligible supplier pool by enforcing material, chemical and end‑of‑life standards. Audited traceability and use of circular materials let compliant vendors command premium bargaining power. Signify’s leadership in sustainability raises dependency on top-tier suppliers, while long‑term collaborations align incentives and reduce risk premia.
- Eco-design narrows inputs
- EPR/RoHS/REACH demand audited traceability
- Circular materials increase vendor leverage
- Long-term ties lower supply risk
Supplier power medium-high: chip concentration, cloud lock-in, material BOM pressure
Supplier power is medium-high: LED chip/driver concentration (60–70% in 2024) and specialty phosphors (>USD 1bn market) raise input leverage; software/cloud reliance (15.1bn IoT devices; AWS 33%, MS 22%, Google 12% in 2024) and materials (25–35% BOM) add switch costs; Signify mitigates via multi-sourcing, platforming, long contracts and 70+ country footprint (30+ sites).
| Factor | 2024 data | Impact |
|---|---|---|
| LED chips | 60–70% supply | Pricing power |
| Phosphors | >USD 1bn market | High switch cost |
| Cloud/IoT | 15.1bn; AWS33/MS22/G12 | Vendor lock-in |
| Materials | 25–35% BOM | Margin sensitivity |
What is included in the product
Detailed Word Document
Concise Porter's Five Forces analysis of Signify identifying competitive rivalry, buyer and supplier power, threat of new entrants and substitutes, and regulatory pressures, with actionable insights on pricing, margins, and strategic defenses to protect market share.
Customizable Excel Spreadsheet
A concise one-sheet Porter's Five Forces for Signify highlighting supplier and buyer power, entry barriers, substitutes and competitive rivalry—ideal for rapid strategic decisions and slide-ready summaries to relieve analysis bottlenecks.
Customers Bargaining Power
Large tenders and procurement scale
Municipalities, corporates and large real estate portfolios procure lighting via competitive RFPs and framework agreements, with public procurement representing about 12% of OECD GDP in 2024, amplifying volume-based price pressure and service demands. Framework and performance-based contracts further raise buyer leverage by tying payments to outcomes. Signify mitigates this through turnkey delivery, integrated IoT platforms and performance guarantees tied to energy savings and uptime.
Price transparency and LED commoditization
Visible benchmarks for LED components and fixtures intensify price negotiations as buyers can compare SKUs and switch brands quickly, compressing margins in commodity segments. In 2024 many LEDs exceed 150 lm/W and lifetimes of 25,000–50,000 hours, so efficacy, warranty and service become key differentiators. Signify leverages quality and reliability data, TCO models (showing up to ~50% energy savings vs legacy lighting) and warranties up to 5 years to defend value.
Switching costs via connected ecosystems
Once Interact or other platforms are deployed, integration and training create meaningful switching costs: implementations typically span months and tie operations to Signify workflows. APIs, analytics and SLAs embed Signify deeper into facilities management, reducing buyer power over time in smart systems. As of 2024 Signify reported hundreds of enterprise Interact deployments, though open integrations preserve leverage for sophisticated buyers.
Channel intermediaries and specifiers
Distributors, ESCOs and lighting designers materially shape Signify’s pricing and brand selection by controlling project pipelines and end-customer access; channel partners can account for 30–50% of commercial project wins and negotiate rebates of roughly 2–8% in 2024. Signify’s broad portfolio and brand equity supported preferred placement in 2024 tenders and inventory programs, sustaining margin resilience.
- Channel reach: distributors/ESCOs drive 30–50% of projects
- Incentives: typical rebates/co-marketing 2–8% (2024)
- Advantage: Signify’s 2024 global scale and brand equity secure preferred placement
TCO and sustainability-driven negotiations
Buyers now prioritize demonstrable energy savings, lower maintenance and carbon cuts; lighting accounts for roughly 15% of global electricity use (IEA) and LEDs can cut energy use by up to 80% and maintenance needs by up to 70%, shifting negotiations to TCO and ESG outcomes. Proven lifecycle savings moderate upfront price pressure, while performance contracts and guarantees strengthen Signify’s leverage in bids.
- Energy savings: up to 80%
- Maintenance reduction: up to 70%
- Lighting share of electricity: ~15% (IEA)
- Performance contracts: increase buyer confidence
Public procurement (~12% OECD GDP) and >150 lm/W LEDs shift focus to TCO
Large public and corporate buyers (public procurement ~12% of OECD GDP in 2024) drive volume pricing and outcome-based contracts, pressuring margins. Visible LED benchmarks (many >150 lm/W, 25k–50k hrs in 2024) shift focus to TCO, warranties (up to 5 yrs) and energy/maintenance savings. Channels (30–50% project influence) negotiate 2–8% rebates, while Interact deployments raise switching costs.
| Metric | 2024 Value |
|---|---|
| Public procurement | ~12% OECD GDP |
| LED efficacy | >150 lm/W |
| Channel influence | 30–50% |
| Typical rebates | 2–8% |
| Energy savings | up to 80% |
Preview Before You Purchase
Signify Porter's Five Forces Analysis
This preview shows the exact Signify Porter's Five Forces analysis you'll receive immediately after purchase—no placeholders or mockups. It is the full, professionally formatted document, ready for download and use the moment you buy. What you see is what you get.











