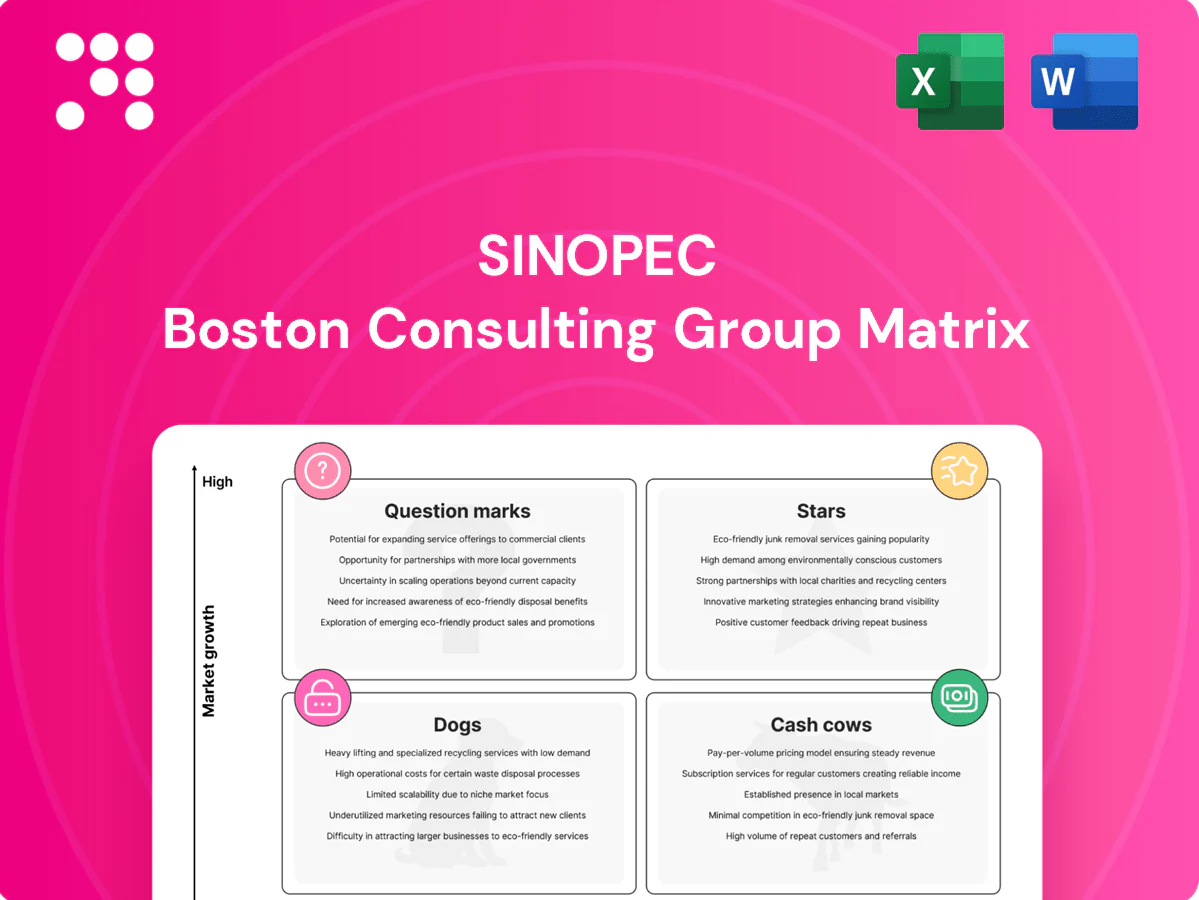
Sinopec Boston Consulting Group Matrix

Visual. Strategic. Downloadable.
Sinopec’s BCG Matrix preview shows where key products and business lines sit — from high-growth Stars to low-return Dogs — and hints at where management should focus. Want the full picture? Purchase the complete BCG Matrix for quadrant-by-quadrant placements, data-backed recommendations, and a ready-to-use strategic plan. You’ll get a detailed Word report plus a high-level Excel summary to present or act on immediately. Buy now and skip the guesswork.
Stars

LNG & natural gas trading
China’s gas demand continues rising—Sinopec’s LNG terminal portfolio and trading position target scale amid double-digit market growth and rising imports; in 2024 Sinopec was among the top national importers with roughly 20% market share in LNG trading. High growth, supportive policy and import dependence make this a star candidate, but securing scale needs heavy terminal capex and long‑term offtakes; keep investing to lock share before growth moderates.
Specialty petrochemicals (EVA, POE, ABS)
Specialty petrochemicals (EVA, POE, ABS) sit as a Question Mark in Sinopec’s BCG view: 2024 demand from solar, advanced packaging and EV components is expanding rapidly, creating near-term cash burn for capacity and grade upgrades. Sinopec’s integrated refining–petchems assets and advantaged feedstock positions enable scalable debottlenecking and higher‑spec grades. If share gains materialize, these investments can convert into durable margins and leadership.

Hydrogen supply & refueling
Hydrogen is still early but accelerating across industrial users and heavy mobility, with fleets and steelmaking pilots expanding in 2024. Sinopec’s large fuel retail network (over 30,000 service sites) and access to refinery hydrogen give it a clear first‑mover edge. Capital intensity is high, but strategic positioning and offtake-linked hubs reduce commercial risk. Prioritize building hubs where demand is visible and scalable.

Battery materials & chemical intermediates
New-energy value chains are growing double-digit, creating scope for Sinopec to move from bulk chemicals into higher-margin battery precursors and chemical intermediates; early wins will require steady promotion and joint customer codevelopment to validate specs.
- Focus: shift from base chemicals to precursors
- Go-to-market: customer codevelopment
- Defense: long-term contracts + tight quality specs
Retail convenience ecosystem (beyond fuel)
Forecourts are evolving into retail convenience ecosystems adding payments, last‑mile pick‑up and food services; Sinopec, with ≈31,000 stations, sees footfall translate to growing non‑fuel sales—China convenience retail grew double digits into 2024 and convenience gross margins (20–30%) far outpace fuel margins (4–6%).
- Traffic present: ~31,000 stations
- Margin gap: convenience 20–30% vs fuel 4–6%
- Needs: tech, partners, brand
- Upside: can outgrow fuel as profit engine
Prioritize terminals & hubs - LNG 20%; forecourts 31,000
Stars: LNG trading/terminals (≈20% national LNG trading share in 2024) targets fast market growth and import dependence; forecourts (≈31,000 stations) drive high-margin convenience retail (20–30% vs fuel 4–6%); prioritize terminal capex, hub buildouts and customer co‑development to lock share while growth stays high.
| Segment | 2024 metric | Key note |
|---|---|---|
| LNG | ~20% trading share | Scale via terminals & long‑term offtakes |
| Forecourts | ≈31,000 stations | Convenience margin 20–30% |
What is included in the product
 Detailed Word Document
Comprehensive BCG Matrix analysis of Sinopec's units, with strategic moves—invest, hold, divest—plus market trend context.

 Customizable Excel Spreadsheet
One-page Sinopec BCG Matrix placing each business unit in quadrants to spot underperformers and free up capital.
Cash Cows

Refining & fuels marketing (China)
Refining & fuels marketing (China) is a cash cow for Sinopec, with massive scale — approximately 390 million tonnes crude throughput in 2024 — and an entrenched retail and distribution network serving a stable demand base. Mature domestic market implies modest volume growth but strong free cash flow generation, supporting dividends and capex. Low incremental promo spend shifts focus to yield optimization and logistics efficiency; milking these efficiencies funds strategic growth bets.
Service-station network (fuel sales)
Service-station network (fuel sales) holds high market share for Sinopec, operating over 31,000 stations (2024) with predictable throughput and stable retail volumes. Margins benefit from scale and vertical supply integration with refining and logistics, supporting steady cash generation. Growth is low but cash is reliable; focus on optimizing pricing, product mix and opex — avoid capex overspend.

Base petrochemicals (ethylene, PTA, PP/PE)
Core ethylene, PTA and PP/PE units run at scale with Sinopec achieving industry-leading cost positions; China ethylene demand grew about 2.1% in 2024, and domestic cracker operating rates remained around mid-80s%, so assets generate strong cash in favorable cycles. Market growth has cooled versus the 2010s, so capex is mainly maintenance and selective upgrades (priority spend under Sinopec’s 2024 investment plan). Cash is redeployed into higher-margin adjacencies—specialty chemicals and downstream polymers—to lift group margins when spreads rebound.

Lubricants & industrial oils
Lubricants & industrial oils sit as a mature, defensible cash cow for Sinopec, backed by a national brand and extensive dealer network that sustains steady margin and free cash flow; marketing spend is modest while SKU rationalization raises per-unit margin and lowers inventory carrying costs.
- Market position: national scale distribution
- Profitability: stable cash generation
- Cost control: contained marketing, SKU optimization
- Strategy: harvest cash, selectively premiumize
Refining byproducts & aromatics
Integrated yields in refining byproducts and aromatics underpin steady cash flows for Sinopec, supported by its position as Asia’s largest refiner; demand remains stable across packaging and textiles rather than in hyper-growth segments, producing dependable margins. Tightening energy intensity and process efficiency is the primary lever to widen the margin spread.
Refining & fuels cash engine — ~390 Mt, 31,000+ stations, steady free cash
Refining & fuels marketing is Sinopec’s largest cash cow—~390 Mt crude throughput in 2024—driving strong free cash flow for dividends and capex. Service-station network (31,000+ stations in 2024) and lubricants deliver stable retail margins; growth is low but cash is reliable. Core petrochemical units (ethylene demand +2.1% in 2024; cracker OR ~mid-80s%) generate cyclical cash, redeployed to specialties.
| Metric | 2024 |
|---|---|
| Crude throughput | ~390 Mt |
| Service stations | 31,000+ |
| China ethylene demand | +2.1% |
| Cracker operating rate | mid-80s% |
| Strategy | Harvest cash; selective upgrade |
Preview = Final Product
Sinopec BCG Matrix
The file you're previewing is the exact Sinopec BCG Matrix report you'll receive after purchase. It analyzes business units and product lines with clear market-share and growth positioning—no placeholders, no watermarks. The document is fully formatted and ready for presentation or editing. Purchase delivers the same file instantly to your inbox. Use it straight away for strategic planning or investor briefings.

Visual. Strategic. Downloadable.
Sinopec’s BCG Matrix preview shows where key products and business lines sit — from high-growth Stars to low-return Dogs — and hints at where management should focus. Want the full picture? Purchase the complete BCG Matrix for quadrant-by-quadrant placements, data-backed recommendations, and a ready-to-use strategic plan. You’ll get a detailed Word report plus a high-level Excel summary to present or act on immediately. Buy now and skip the guesswork.
Stars
LNG & natural gas trading
China’s gas demand continues rising—Sinopec’s LNG terminal portfolio and trading position target scale amid double-digit market growth and rising imports; in 2024 Sinopec was among the top national importers with roughly 20% market share in LNG trading. High growth, supportive policy and import dependence make this a star candidate, but securing scale needs heavy terminal capex and long‑term offtakes; keep investing to lock share before growth moderates.
Specialty petrochemicals (EVA, POE, ABS)
Specialty petrochemicals (EVA, POE, ABS) sit as a Question Mark in Sinopec’s BCG view: 2024 demand from solar, advanced packaging and EV components is expanding rapidly, creating near-term cash burn for capacity and grade upgrades. Sinopec’s integrated refining–petchems assets and advantaged feedstock positions enable scalable debottlenecking and higher‑spec grades. If share gains materialize, these investments can convert into durable margins and leadership.
Hydrogen supply & refueling
Hydrogen is still early but accelerating across industrial users and heavy mobility, with fleets and steelmaking pilots expanding in 2024. Sinopec’s large fuel retail network (over 30,000 service sites) and access to refinery hydrogen give it a clear first‑mover edge. Capital intensity is high, but strategic positioning and offtake-linked hubs reduce commercial risk. Prioritize building hubs where demand is visible and scalable.
Battery materials & chemical intermediates
New-energy value chains are growing double-digit, creating scope for Sinopec to move from bulk chemicals into higher-margin battery precursors and chemical intermediates; early wins will require steady promotion and joint customer codevelopment to validate specs.
- Focus: shift from base chemicals to precursors
- Go-to-market: customer codevelopment
- Defense: long-term contracts + tight quality specs
Retail convenience ecosystem (beyond fuel)
Forecourts are evolving into retail convenience ecosystems adding payments, last‑mile pick‑up and food services; Sinopec, with ≈31,000 stations, sees footfall translate to growing non‑fuel sales—China convenience retail grew double digits into 2024 and convenience gross margins (20–30%) far outpace fuel margins (4–6%).
- Traffic present: ~31,000 stations
- Margin gap: convenience 20–30% vs fuel 4–6%
- Needs: tech, partners, brand
- Upside: can outgrow fuel as profit engine
Prioritize terminals & hubs - LNG 20%; forecourts 31,000
Stars: LNG trading/terminals (≈20% national LNG trading share in 2024) targets fast market growth and import dependence; forecourts (≈31,000 stations) drive high-margin convenience retail (20–30% vs fuel 4–6%); prioritize terminal capex, hub buildouts and customer co‑development to lock share while growth stays high.
| Segment | 2024 metric | Key note |
|---|---|---|
| LNG | ~20% trading share | Scale via terminals & long‑term offtakes |
| Forecourts | ≈31,000 stations | Convenience margin 20–30% |
What is included in the product
Detailed Word Document
Comprehensive BCG Matrix analysis of Sinopec's units, with strategic moves—invest, hold, divest—plus market trend context.
Customizable Excel Spreadsheet
One-page Sinopec BCG Matrix placing each business unit in quadrants to spot underperformers and free up capital.
Cash Cows
Refining & fuels marketing (China)
Refining & fuels marketing (China) is a cash cow for Sinopec, with massive scale — approximately 390 million tonnes crude throughput in 2024 — and an entrenched retail and distribution network serving a stable demand base. Mature domestic market implies modest volume growth but strong free cash flow generation, supporting dividends and capex. Low incremental promo spend shifts focus to yield optimization and logistics efficiency; milking these efficiencies funds strategic growth bets.
Service-station network (fuel sales)
Service-station network (fuel sales) holds high market share for Sinopec, operating over 31,000 stations (2024) with predictable throughput and stable retail volumes. Margins benefit from scale and vertical supply integration with refining and logistics, supporting steady cash generation. Growth is low but cash is reliable; focus on optimizing pricing, product mix and opex — avoid capex overspend.
Base petrochemicals (ethylene, PTA, PP/PE)
Core ethylene, PTA and PP/PE units run at scale with Sinopec achieving industry-leading cost positions; China ethylene demand grew about 2.1% in 2024, and domestic cracker operating rates remained around mid-80s%, so assets generate strong cash in favorable cycles. Market growth has cooled versus the 2010s, so capex is mainly maintenance and selective upgrades (priority spend under Sinopec’s 2024 investment plan). Cash is redeployed into higher-margin adjacencies—specialty chemicals and downstream polymers—to lift group margins when spreads rebound.
Lubricants & industrial oils
Lubricants & industrial oils sit as a mature, defensible cash cow for Sinopec, backed by a national brand and extensive dealer network that sustains steady margin and free cash flow; marketing spend is modest while SKU rationalization raises per-unit margin and lowers inventory carrying costs.
- Market position: national scale distribution
- Profitability: stable cash generation
- Cost control: contained marketing, SKU optimization
- Strategy: harvest cash, selectively premiumize
Refining byproducts & aromatics
Integrated yields in refining byproducts and aromatics underpin steady cash flows for Sinopec, supported by its position as Asia’s largest refiner; demand remains stable across packaging and textiles rather than in hyper-growth segments, producing dependable margins. Tightening energy intensity and process efficiency is the primary lever to widen the margin spread.
Refining & fuels cash engine — ~390 Mt, 31,000+ stations, steady free cash
Refining & fuels marketing is Sinopec’s largest cash cow—~390 Mt crude throughput in 2024—driving strong free cash flow for dividends and capex. Service-station network (31,000+ stations in 2024) and lubricants deliver stable retail margins; growth is low but cash is reliable. Core petrochemical units (ethylene demand +2.1% in 2024; cracker OR ~mid-80s%) generate cyclical cash, redeployed to specialties.
| Metric | 2024 |
|---|---|
| Crude throughput | ~390 Mt |
| Service stations | 31,000+ |
| China ethylene demand | +2.1% |
| Cracker operating rate | mid-80s% |
| Strategy | Harvest cash; selective upgrade |
Preview = Final Product
Sinopec BCG Matrix
The file you're previewing is the exact Sinopec BCG Matrix report you'll receive after purchase. It analyzes business units and product lines with clear market-share and growth positioning—no placeholders, no watermarks. The document is fully formatted and ready for presentation or editing. Purchase delivers the same file instantly to your inbox. Use it straight away for strategic planning or investor briefings.
Original: $10.00
-65%$10.00
$3.50Description
Visual. Strategic. Downloadable.
Sinopec’s BCG Matrix preview shows where key products and business lines sit — from high-growth Stars to low-return Dogs — and hints at where management should focus. Want the full picture? Purchase the complete BCG Matrix for quadrant-by-quadrant placements, data-backed recommendations, and a ready-to-use strategic plan. You’ll get a detailed Word report plus a high-level Excel summary to present or act on immediately. Buy now and skip the guesswork.
Stars
LNG & natural gas trading
China’s gas demand continues rising—Sinopec’s LNG terminal portfolio and trading position target scale amid double-digit market growth and rising imports; in 2024 Sinopec was among the top national importers with roughly 20% market share in LNG trading. High growth, supportive policy and import dependence make this a star candidate, but securing scale needs heavy terminal capex and long‑term offtakes; keep investing to lock share before growth moderates.
Specialty petrochemicals (EVA, POE, ABS)
Specialty petrochemicals (EVA, POE, ABS) sit as a Question Mark in Sinopec’s BCG view: 2024 demand from solar, advanced packaging and EV components is expanding rapidly, creating near-term cash burn for capacity and grade upgrades. Sinopec’s integrated refining–petchems assets and advantaged feedstock positions enable scalable debottlenecking and higher‑spec grades. If share gains materialize, these investments can convert into durable margins and leadership.
Hydrogen supply & refueling
Hydrogen is still early but accelerating across industrial users and heavy mobility, with fleets and steelmaking pilots expanding in 2024. Sinopec’s large fuel retail network (over 30,000 service sites) and access to refinery hydrogen give it a clear first‑mover edge. Capital intensity is high, but strategic positioning and offtake-linked hubs reduce commercial risk. Prioritize building hubs where demand is visible and scalable.
Battery materials & chemical intermediates
New-energy value chains are growing double-digit, creating scope for Sinopec to move from bulk chemicals into higher-margin battery precursors and chemical intermediates; early wins will require steady promotion and joint customer codevelopment to validate specs.
- Focus: shift from base chemicals to precursors
- Go-to-market: customer codevelopment
- Defense: long-term contracts + tight quality specs
Retail convenience ecosystem (beyond fuel)
Forecourts are evolving into retail convenience ecosystems adding payments, last‑mile pick‑up and food services; Sinopec, with ≈31,000 stations, sees footfall translate to growing non‑fuel sales—China convenience retail grew double digits into 2024 and convenience gross margins (20–30%) far outpace fuel margins (4–6%).
- Traffic present: ~31,000 stations
- Margin gap: convenience 20–30% vs fuel 4–6%
- Needs: tech, partners, brand
- Upside: can outgrow fuel as profit engine
Prioritize terminals & hubs - LNG 20%; forecourts 31,000
Stars: LNG trading/terminals (≈20% national LNG trading share in 2024) targets fast market growth and import dependence; forecourts (≈31,000 stations) drive high-margin convenience retail (20–30% vs fuel 4–6%); prioritize terminal capex, hub buildouts and customer co‑development to lock share while growth stays high.
| Segment | 2024 metric | Key note |
|---|---|---|
| LNG | ~20% trading share | Scale via terminals & long‑term offtakes |
| Forecourts | ≈31,000 stations | Convenience margin 20–30% |
What is included in the product
Detailed Word Document
Comprehensive BCG Matrix analysis of Sinopec's units, with strategic moves—invest, hold, divest—plus market trend context.
Customizable Excel Spreadsheet
One-page Sinopec BCG Matrix placing each business unit in quadrants to spot underperformers and free up capital.
Cash Cows
Refining & fuels marketing (China)
Refining & fuels marketing (China) is a cash cow for Sinopec, with massive scale — approximately 390 million tonnes crude throughput in 2024 — and an entrenched retail and distribution network serving a stable demand base. Mature domestic market implies modest volume growth but strong free cash flow generation, supporting dividends and capex. Low incremental promo spend shifts focus to yield optimization and logistics efficiency; milking these efficiencies funds strategic growth bets.
Service-station network (fuel sales)
Service-station network (fuel sales) holds high market share for Sinopec, operating over 31,000 stations (2024) with predictable throughput and stable retail volumes. Margins benefit from scale and vertical supply integration with refining and logistics, supporting steady cash generation. Growth is low but cash is reliable; focus on optimizing pricing, product mix and opex — avoid capex overspend.
Base petrochemicals (ethylene, PTA, PP/PE)
Core ethylene, PTA and PP/PE units run at scale with Sinopec achieving industry-leading cost positions; China ethylene demand grew about 2.1% in 2024, and domestic cracker operating rates remained around mid-80s%, so assets generate strong cash in favorable cycles. Market growth has cooled versus the 2010s, so capex is mainly maintenance and selective upgrades (priority spend under Sinopec’s 2024 investment plan). Cash is redeployed into higher-margin adjacencies—specialty chemicals and downstream polymers—to lift group margins when spreads rebound.
Lubricants & industrial oils
Lubricants & industrial oils sit as a mature, defensible cash cow for Sinopec, backed by a national brand and extensive dealer network that sustains steady margin and free cash flow; marketing spend is modest while SKU rationalization raises per-unit margin and lowers inventory carrying costs.
- Market position: national scale distribution
- Profitability: stable cash generation
- Cost control: contained marketing, SKU optimization
- Strategy: harvest cash, selectively premiumize
Refining byproducts & aromatics
Integrated yields in refining byproducts and aromatics underpin steady cash flows for Sinopec, supported by its position as Asia’s largest refiner; demand remains stable across packaging and textiles rather than in hyper-growth segments, producing dependable margins. Tightening energy intensity and process efficiency is the primary lever to widen the margin spread.
Refining & fuels cash engine — ~390 Mt, 31,000+ stations, steady free cash
Refining & fuels marketing is Sinopec’s largest cash cow—~390 Mt crude throughput in 2024—driving strong free cash flow for dividends and capex. Service-station network (31,000+ stations in 2024) and lubricants deliver stable retail margins; growth is low but cash is reliable. Core petrochemical units (ethylene demand +2.1% in 2024; cracker OR ~mid-80s%) generate cyclical cash, redeployed to specialties.
| Metric | 2024 |
|---|---|
| Crude throughput | ~390 Mt |
| Service stations | 31,000+ |
| China ethylene demand | +2.1% |
| Cracker operating rate | mid-80s% |
| Strategy | Harvest cash; selective upgrade |
Preview = Final Product
Sinopec BCG Matrix
The file you're previewing is the exact Sinopec BCG Matrix report you'll receive after purchase. It analyzes business units and product lines with clear market-share and growth positioning—no placeholders, no watermarks. The document is fully formatted and ready for presentation or editing. Purchase delivers the same file instantly to your inbox. Use it straight away for strategic planning or investor briefings.











