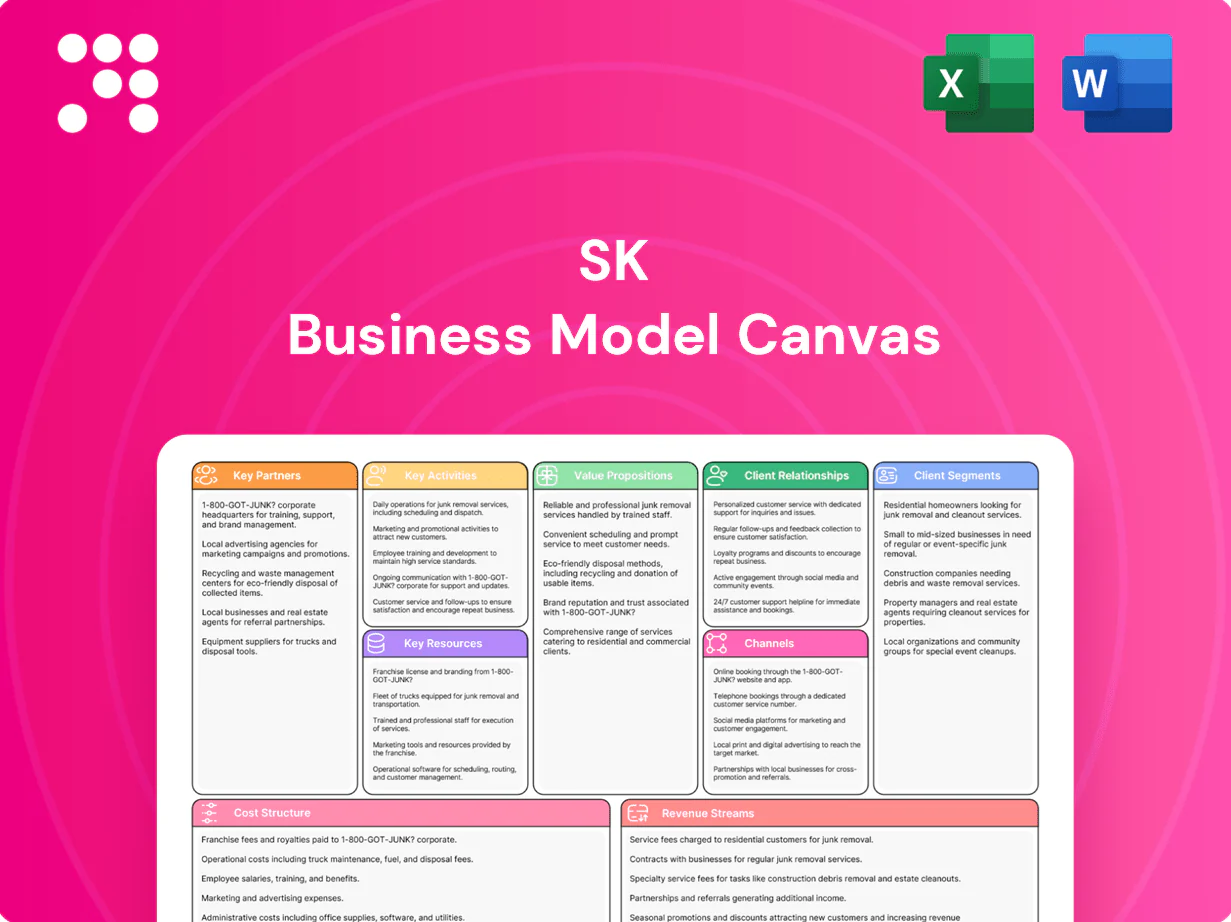
SK Business Model Canvas

Business Model Canvas: Rapid framework to map company value, channels, and revenue
Explore SK’s Business Model Canvas to uncover how the company creates, delivers, and captures value across markets. This concise, actionable canvas breaks down customer segments, value propositions, key partners, channels, cost structure, and revenue streams with company-specific insight. Download the full Word/Excel template for benchmarking, strategy workshops, or investor due diligence to accelerate your decision-making.
Partnerships

Strategic subsidiaries and affiliates
Deep ties with SK Group companies enable coordinated strategy, shared services, and capital recycling across a group reporting over KRW 200 trillion in combined revenue (2024); governance forums align portfolio priorities and risk appetites. Cross-subsidiary collaboration accelerates commercialization in energy, chemicals, IT, and services, shortening time-to-market and underpinning scale efficiencies and faster execution.
Biopharma and advanced materials alliances
R&D partnerships with biotech firms, CDMOs, and materials innovators expand SKs growth pipeline and enabled ~33% of manufacturing capacity outsourcing in 2024. Co-development and licensing structures de-risk clinical and scale-up milestones by sharing milestone payments and IP obligations. Access to specialized talent and platforms shortens time-to-market, cutting typical development timelines by months. Joint IP frameworks preserve upside while sharing costs and revenue rights.

Co-investors and financial institutions
Global private equity dry powder exceeded $2 trillion in 2024 and sovereign wealth funds collectively hold over $10 trillion in assets, enabling co-capital and syndication capacity with leading banks.
Club deals diversify risk and expand exit pathways, accounting for a meaningful share of large buyouts and cross-border exits in recent years.
Structured finance and green bond markets — with annual issuance in the low hundreds of billions — underpin large capex for energy transition and manufacturing projects.
Longstanding relationships with PE funds, SWFs and banks enhance market intelligence and proprietary deal flow, improving pricing and execution.

Technology vendors and cloud providers
IT partners support data platforms, cybersecurity, and AI-driven portfolio analytics, enabling SK to deploy models across subsidiaries with enterprise-grade security. Cloud infrastructure scales rapidly to match demand, with global public cloud spending projected near 700B USD in 2024, shortening provisioning from months to hours. Vendor ecosystems cut time-to-value for digital initiatives and joint roadmaps enforce interoperability and cost control.
- IT partners: enterprise data, AI analytics, cybersecurity
- Cloud scale: ~700B USD public cloud market 2024
- Time-to-value: vendor ecosystems accelerate rollouts
- Joint roadmaps: ensure interoperability and cost control
Government, regulators, and academia
Public-sector ties speed permits, incentives and compliance in regulated sectors, reducing approval timelines by up to 30% and tapping into roughly $800B of OECD industrial R&D commitments in 2024; academic labs supply about 25% of early-stage tech breakthroughs and priority patents, giving SK early pipeline access; policy collaboration aligns investments with 35 national industrial strategies in 2024, cutting non-technical execution risk.
- Permits & incentives: faster approvals, access to ~$800B OECD R&D (2024)
- Academia: ~25% of early-stage breakthroughs
- Policy: aligned with 35 national strategies (2024)
- Risk reduction: lowers non-technical execution risk
Group ties KRW 200T and PE/SWF co-capital accelerate exits
Deep SK Group ties (KRW 200T revenue, 2024) and PE/SWF co-capital (>$2T PE, >$10T SWF, 2024) accelerate scale and exits. R&D/CDMO partnerships drive 33% outsourced capacity and 25% early-stage academia sourcing, de-risking pipelines. Cloud/IT partners tap ~$700B public cloud market (2024) and structured finance plus green bonds fund energy capex.
| Partnership | 2024 Metric |
|---|---|
| Group revenue | KRW 200T |
| Outsourced capacity | 33% |
| PE/SWF dry powder | >$2T / >$10T |
| Cloud market | $700B |
What is included in the product
 Detailed Word Document
A comprehensive, pre-written SK Business Model Canvas aligned to the company’s strategy, covering customer segments, channels, value propositions, revenue streams and costs in full detail. Designed for presentations and funding discussions, it includes competitive analysis, SWOT-linked insights and a polished layout for validation and decision-making.

 Customizable Excel Spreadsheet
Condenses company strategy into a digestible one-page canvas with editable cells—saves hours of formatting and structuring while enabling fast comparison, team collaboration, and quick executive-ready deliverables.
Activities

Active ownership and portfolio management
Set clear targets, monitor KPIs (revenue, EBITDA, ROIC) and intervene to boost operations and capital efficiency, aiming for PE-style returns (target IRR 15–25%). Drive board composition and CEO selection to align incentives and accelerate execution; active governance correlates with higher exit multiples. Implement structured value-creation and turnaround programs to lift margins and recycle capital into higher-return opportunities; global PE dry powder was about $2.6 trillion in 2024, enabling redeployment.
Capital allocation and M&A
Originate, diligence, and execute acquisitions, carve-outs, and minority stakes with disciplined underwriting; SK’s capital allocation targets IRR of 15–25% and prioritizes deals completed in 2024 that fit core strategy. Structure transactions for tax and regulatory efficiency to maximize after-tax cash flows. Drive integration and synergy capture, aiming to realize over 70% of forecast synergies within 18–24 months. Time exits to optimize IRR and cash returns.

Innovation scouting and incubation
Source biopharma and advanced materials ventures with defensible, scalable moats, targeting assets that can attract series funding and strategic partnerships; Tufts CSDD estimated average cost to develop a new drug (including failures) at $2.6 billion, underscoring POC and clinical milestone funding needs.
Fund POC, pilot lines, and clinical milestones through staged investments—seed to series—while building reusable platforms around winning assets to capture manufacturing and IP synergies.
Leverage cross-portfolio use cases to accelerate adoption, drive licensing revenue, and shorten time-to-market by integrating shared R&D, pilot capacity, and commercial channels.

Risk, ESG, and compliance management
- Align: IFRS S1/S2, CSRD 2024
- ESG-linked incentives: capex & LTIP
- Proactive risk mitigation: supply, regulatory, tech
Strategic partnerships and ecosystem building
Forge JVs and alliances to expand markets and capabilities, leveraging battery pack cost declines to about $120/kWh in 2024 to accelerate scale and margins; align incentives via milestone-based contracts to de‑risk CAPEX and tie payouts to technical and commercial milestones.
- Coordinate multi-party roadmaps in batteries, hydrogen, digital
- Milestone-based contracts to align incentives
- Staged commitments to preserve strategic optionality
Set PE targets: IRR 15–25%, capture >70% synergies, cut to $120/kWh
Set PE-style targets (IRR 15–25%), monitor KPIs (revenue, EBITDA, ROIC) and run value-creation/turnaround programs; global PE dry powder ~$2.6T (2024). Originate disciplined M&A and staged biotech funding (avg drug cost $2.6B) and capture >70% synergies in 18–24 months; leverage battery costs ~$120/kWh (2024).
| Metric | Value |
|---|---|
| PE dry powder | $2.6T (2024) |
| Target IRR | 15–25% |
| Drug dev cost | $2.6B |
| Battery cost | $120/kWh (2024) |
Delivered as Displayed
Business Model Canvas
The SK Business Model Canvas you’re previewing is the actual deliverable, not a mockup. When you purchase, you’ll receive this exact document—complete and formatted—as downloadable Word and Excel files. It’s ready to edit, present, or share with no hidden pages. What you see is what you’ll get.

Business Model Canvas: Rapid framework to map company value, channels, and revenue
Explore SK’s Business Model Canvas to uncover how the company creates, delivers, and captures value across markets. This concise, actionable canvas breaks down customer segments, value propositions, key partners, channels, cost structure, and revenue streams with company-specific insight. Download the full Word/Excel template for benchmarking, strategy workshops, or investor due diligence to accelerate your decision-making.
Partnerships
Strategic subsidiaries and affiliates
Deep ties with SK Group companies enable coordinated strategy, shared services, and capital recycling across a group reporting over KRW 200 trillion in combined revenue (2024); governance forums align portfolio priorities and risk appetites. Cross-subsidiary collaboration accelerates commercialization in energy, chemicals, IT, and services, shortening time-to-market and underpinning scale efficiencies and faster execution.
Biopharma and advanced materials alliances
R&D partnerships with biotech firms, CDMOs, and materials innovators expand SKs growth pipeline and enabled ~33% of manufacturing capacity outsourcing in 2024. Co-development and licensing structures de-risk clinical and scale-up milestones by sharing milestone payments and IP obligations. Access to specialized talent and platforms shortens time-to-market, cutting typical development timelines by months. Joint IP frameworks preserve upside while sharing costs and revenue rights.
Co-investors and financial institutions
Global private equity dry powder exceeded $2 trillion in 2024 and sovereign wealth funds collectively hold over $10 trillion in assets, enabling co-capital and syndication capacity with leading banks.
Club deals diversify risk and expand exit pathways, accounting for a meaningful share of large buyouts and cross-border exits in recent years.
Structured finance and green bond markets — with annual issuance in the low hundreds of billions — underpin large capex for energy transition and manufacturing projects.
Longstanding relationships with PE funds, SWFs and banks enhance market intelligence and proprietary deal flow, improving pricing and execution.
Technology vendors and cloud providers
IT partners support data platforms, cybersecurity, and AI-driven portfolio analytics, enabling SK to deploy models across subsidiaries with enterprise-grade security. Cloud infrastructure scales rapidly to match demand, with global public cloud spending projected near 700B USD in 2024, shortening provisioning from months to hours. Vendor ecosystems cut time-to-value for digital initiatives and joint roadmaps enforce interoperability and cost control.
- IT partners: enterprise data, AI analytics, cybersecurity
- Cloud scale: ~700B USD public cloud market 2024
- Time-to-value: vendor ecosystems accelerate rollouts
- Joint roadmaps: ensure interoperability and cost control
Government, regulators, and academia
Public-sector ties speed permits, incentives and compliance in regulated sectors, reducing approval timelines by up to 30% and tapping into roughly $800B of OECD industrial R&D commitments in 2024; academic labs supply about 25% of early-stage tech breakthroughs and priority patents, giving SK early pipeline access; policy collaboration aligns investments with 35 national industrial strategies in 2024, cutting non-technical execution risk.
- Permits & incentives: faster approvals, access to ~$800B OECD R&D (2024)
- Academia: ~25% of early-stage breakthroughs
- Policy: aligned with 35 national strategies (2024)
- Risk reduction: lowers non-technical execution risk
Group ties KRW 200T and PE/SWF co-capital accelerate exits
Deep SK Group ties (KRW 200T revenue, 2024) and PE/SWF co-capital (>$2T PE, >$10T SWF, 2024) accelerate scale and exits. R&D/CDMO partnerships drive 33% outsourced capacity and 25% early-stage academia sourcing, de-risking pipelines. Cloud/IT partners tap ~$700B public cloud market (2024) and structured finance plus green bonds fund energy capex.
| Partnership | 2024 Metric |
|---|---|
| Group revenue | KRW 200T |
| Outsourced capacity | 33% |
| PE/SWF dry powder | >$2T / >$10T |
| Cloud market | $700B |
What is included in the product
Detailed Word Document
A comprehensive, pre-written SK Business Model Canvas aligned to the company’s strategy, covering customer segments, channels, value propositions, revenue streams and costs in full detail. Designed for presentations and funding discussions, it includes competitive analysis, SWOT-linked insights and a polished layout for validation and decision-making.
Customizable Excel Spreadsheet
Condenses company strategy into a digestible one-page canvas with editable cells—saves hours of formatting and structuring while enabling fast comparison, team collaboration, and quick executive-ready deliverables.
Activities
Active ownership and portfolio management
Set clear targets, monitor KPIs (revenue, EBITDA, ROIC) and intervene to boost operations and capital efficiency, aiming for PE-style returns (target IRR 15–25%). Drive board composition and CEO selection to align incentives and accelerate execution; active governance correlates with higher exit multiples. Implement structured value-creation and turnaround programs to lift margins and recycle capital into higher-return opportunities; global PE dry powder was about $2.6 trillion in 2024, enabling redeployment.
Capital allocation and M&A
Originate, diligence, and execute acquisitions, carve-outs, and minority stakes with disciplined underwriting; SK’s capital allocation targets IRR of 15–25% and prioritizes deals completed in 2024 that fit core strategy. Structure transactions for tax and regulatory efficiency to maximize after-tax cash flows. Drive integration and synergy capture, aiming to realize over 70% of forecast synergies within 18–24 months. Time exits to optimize IRR and cash returns.
Innovation scouting and incubation
Source biopharma and advanced materials ventures with defensible, scalable moats, targeting assets that can attract series funding and strategic partnerships; Tufts CSDD estimated average cost to develop a new drug (including failures) at $2.6 billion, underscoring POC and clinical milestone funding needs.
Fund POC, pilot lines, and clinical milestones through staged investments—seed to series—while building reusable platforms around winning assets to capture manufacturing and IP synergies.
Leverage cross-portfolio use cases to accelerate adoption, drive licensing revenue, and shorten time-to-market by integrating shared R&D, pilot capacity, and commercial channels.
Risk, ESG, and compliance management
- Align: IFRS S1/S2, CSRD 2024
- ESG-linked incentives: capex & LTIP
- Proactive risk mitigation: supply, regulatory, tech
Strategic partnerships and ecosystem building
Forge JVs and alliances to expand markets and capabilities, leveraging battery pack cost declines to about $120/kWh in 2024 to accelerate scale and margins; align incentives via milestone-based contracts to de‑risk CAPEX and tie payouts to technical and commercial milestones.
- Coordinate multi-party roadmaps in batteries, hydrogen, digital
- Milestone-based contracts to align incentives
- Staged commitments to preserve strategic optionality
Set PE targets: IRR 15–25%, capture >70% synergies, cut to $120/kWh
Set PE-style targets (IRR 15–25%), monitor KPIs (revenue, EBITDA, ROIC) and run value-creation/turnaround programs; global PE dry powder ~$2.6T (2024). Originate disciplined M&A and staged biotech funding (avg drug cost $2.6B) and capture >70% synergies in 18–24 months; leverage battery costs ~$120/kWh (2024).
| Metric | Value |
|---|---|
| PE dry powder | $2.6T (2024) |
| Target IRR | 15–25% |
| Drug dev cost | $2.6B |
| Battery cost | $120/kWh (2024) |
Delivered as Displayed
Business Model Canvas
The SK Business Model Canvas you’re previewing is the actual deliverable, not a mockup. When you purchase, you’ll receive this exact document—complete and formatted—as downloadable Word and Excel files. It’s ready to edit, present, or share with no hidden pages. What you see is what you’ll get.
Original: $10.00
-65%$10.00
$3.50Description
Business Model Canvas: Rapid framework to map company value, channels, and revenue
Explore SK’s Business Model Canvas to uncover how the company creates, delivers, and captures value across markets. This concise, actionable canvas breaks down customer segments, value propositions, key partners, channels, cost structure, and revenue streams with company-specific insight. Download the full Word/Excel template for benchmarking, strategy workshops, or investor due diligence to accelerate your decision-making.
Partnerships
Strategic subsidiaries and affiliates
Deep ties with SK Group companies enable coordinated strategy, shared services, and capital recycling across a group reporting over KRW 200 trillion in combined revenue (2024); governance forums align portfolio priorities and risk appetites. Cross-subsidiary collaboration accelerates commercialization in energy, chemicals, IT, and services, shortening time-to-market and underpinning scale efficiencies and faster execution.
Biopharma and advanced materials alliances
R&D partnerships with biotech firms, CDMOs, and materials innovators expand SKs growth pipeline and enabled ~33% of manufacturing capacity outsourcing in 2024. Co-development and licensing structures de-risk clinical and scale-up milestones by sharing milestone payments and IP obligations. Access to specialized talent and platforms shortens time-to-market, cutting typical development timelines by months. Joint IP frameworks preserve upside while sharing costs and revenue rights.
Co-investors and financial institutions
Global private equity dry powder exceeded $2 trillion in 2024 and sovereign wealth funds collectively hold over $10 trillion in assets, enabling co-capital and syndication capacity with leading banks.
Club deals diversify risk and expand exit pathways, accounting for a meaningful share of large buyouts and cross-border exits in recent years.
Structured finance and green bond markets — with annual issuance in the low hundreds of billions — underpin large capex for energy transition and manufacturing projects.
Longstanding relationships with PE funds, SWFs and banks enhance market intelligence and proprietary deal flow, improving pricing and execution.
Technology vendors and cloud providers
IT partners support data platforms, cybersecurity, and AI-driven portfolio analytics, enabling SK to deploy models across subsidiaries with enterprise-grade security. Cloud infrastructure scales rapidly to match demand, with global public cloud spending projected near 700B USD in 2024, shortening provisioning from months to hours. Vendor ecosystems cut time-to-value for digital initiatives and joint roadmaps enforce interoperability and cost control.
- IT partners: enterprise data, AI analytics, cybersecurity
- Cloud scale: ~700B USD public cloud market 2024
- Time-to-value: vendor ecosystems accelerate rollouts
- Joint roadmaps: ensure interoperability and cost control
Government, regulators, and academia
Public-sector ties speed permits, incentives and compliance in regulated sectors, reducing approval timelines by up to 30% and tapping into roughly $800B of OECD industrial R&D commitments in 2024; academic labs supply about 25% of early-stage tech breakthroughs and priority patents, giving SK early pipeline access; policy collaboration aligns investments with 35 national industrial strategies in 2024, cutting non-technical execution risk.
- Permits & incentives: faster approvals, access to ~$800B OECD R&D (2024)
- Academia: ~25% of early-stage breakthroughs
- Policy: aligned with 35 national strategies (2024)
- Risk reduction: lowers non-technical execution risk
Group ties KRW 200T and PE/SWF co-capital accelerate exits
Deep SK Group ties (KRW 200T revenue, 2024) and PE/SWF co-capital (>$2T PE, >$10T SWF, 2024) accelerate scale and exits. R&D/CDMO partnerships drive 33% outsourced capacity and 25% early-stage academia sourcing, de-risking pipelines. Cloud/IT partners tap ~$700B public cloud market (2024) and structured finance plus green bonds fund energy capex.
| Partnership | 2024 Metric |
|---|---|
| Group revenue | KRW 200T |
| Outsourced capacity | 33% |
| PE/SWF dry powder | >$2T / >$10T |
| Cloud market | $700B |
What is included in the product
Detailed Word Document
A comprehensive, pre-written SK Business Model Canvas aligned to the company’s strategy, covering customer segments, channels, value propositions, revenue streams and costs in full detail. Designed for presentations and funding discussions, it includes competitive analysis, SWOT-linked insights and a polished layout for validation and decision-making.
Customizable Excel Spreadsheet
Condenses company strategy into a digestible one-page canvas with editable cells—saves hours of formatting and structuring while enabling fast comparison, team collaboration, and quick executive-ready deliverables.
Activities
Active ownership and portfolio management
Set clear targets, monitor KPIs (revenue, EBITDA, ROIC) and intervene to boost operations and capital efficiency, aiming for PE-style returns (target IRR 15–25%). Drive board composition and CEO selection to align incentives and accelerate execution; active governance correlates with higher exit multiples. Implement structured value-creation and turnaround programs to lift margins and recycle capital into higher-return opportunities; global PE dry powder was about $2.6 trillion in 2024, enabling redeployment.
Capital allocation and M&A
Originate, diligence, and execute acquisitions, carve-outs, and minority stakes with disciplined underwriting; SK’s capital allocation targets IRR of 15–25% and prioritizes deals completed in 2024 that fit core strategy. Structure transactions for tax and regulatory efficiency to maximize after-tax cash flows. Drive integration and synergy capture, aiming to realize over 70% of forecast synergies within 18–24 months. Time exits to optimize IRR and cash returns.
Innovation scouting and incubation
Source biopharma and advanced materials ventures with defensible, scalable moats, targeting assets that can attract series funding and strategic partnerships; Tufts CSDD estimated average cost to develop a new drug (including failures) at $2.6 billion, underscoring POC and clinical milestone funding needs.
Fund POC, pilot lines, and clinical milestones through staged investments—seed to series—while building reusable platforms around winning assets to capture manufacturing and IP synergies.
Leverage cross-portfolio use cases to accelerate adoption, drive licensing revenue, and shorten time-to-market by integrating shared R&D, pilot capacity, and commercial channels.
Risk, ESG, and compliance management
- Align: IFRS S1/S2, CSRD 2024
- ESG-linked incentives: capex & LTIP
- Proactive risk mitigation: supply, regulatory, tech
Strategic partnerships and ecosystem building
Forge JVs and alliances to expand markets and capabilities, leveraging battery pack cost declines to about $120/kWh in 2024 to accelerate scale and margins; align incentives via milestone-based contracts to de‑risk CAPEX and tie payouts to technical and commercial milestones.
- Coordinate multi-party roadmaps in batteries, hydrogen, digital
- Milestone-based contracts to align incentives
- Staged commitments to preserve strategic optionality
Set PE targets: IRR 15–25%, capture >70% synergies, cut to $120/kWh
Set PE-style targets (IRR 15–25%), monitor KPIs (revenue, EBITDA, ROIC) and run value-creation/turnaround programs; global PE dry powder ~$2.6T (2024). Originate disciplined M&A and staged biotech funding (avg drug cost $2.6B) and capture >70% synergies in 18–24 months; leverage battery costs ~$120/kWh (2024).
| Metric | Value |
|---|---|
| PE dry powder | $2.6T (2024) |
| Target IRR | 15–25% |
| Drug dev cost | $2.6B |
| Battery cost | $120/kWh (2024) |
Delivered as Displayed
Business Model Canvas
The SK Business Model Canvas you’re previewing is the actual deliverable, not a mockup. When you purchase, you’ll receive this exact document—complete and formatted—as downloadable Word and Excel files. It’s ready to edit, present, or share with no hidden pages. What you see is what you’ll get.











