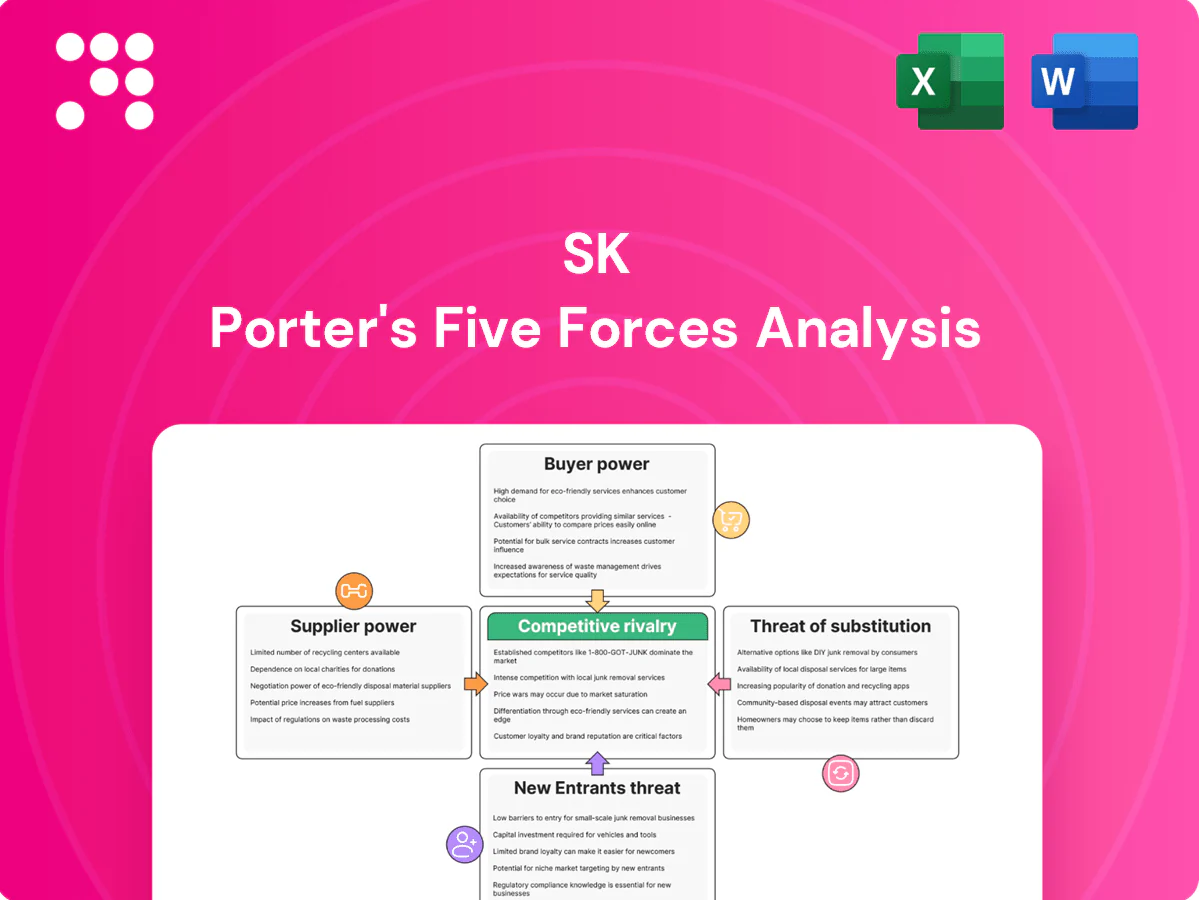
SK Porter's Five Forces Analysis

From Overview to Strategy Blueprint
SK’s Porter's Five Forces snapshot highlights competitive intensity, supplier and buyer power, threat of substitutes, and barriers to entry—key inputs for strategic decisions. This brief overview surfaces risks and opportunities but omits force-by-force ratings and visuals. Unlock the full Porter's Five Forces Analysis to get a consultant-grade, data-driven breakdown tailored to SK and actionable for investors and strategists.
Suppliers Bargaining Power

Commodity feedstock concentration
Energy and chemicals arms depend on crude, naphtha and specialty gases sourced from a concentrated supplier base, giving suppliers outsized pricing leverage and amplifying pass-through to margins. OPEC+ policies and geopolitical shocks remain key swing factors, with OPEC+ accounting for roughly 45% of global crude production in 2024, tightening availability during cuts. Long-term offtake contracts and hedging materially reduce short-term volatility but cannot eliminate price shocks. Vertical feedstock ties within SK Group mitigate some exposure, yet external procurement still represents a material residual risk to margins.
Critical minerals and advanced materials
Critical-minerals suppliers wield high leverage: batteries and semiconductors rely on lithium, nickel, cobalt and specialty precursors from few qualified sources (DRC ~70% of cobalt, Australia ~60% of lithium mine output in 2023–24), while ESG rules and export controls raise effective switching costs. Multi-sourcing and recycling (recycling <5% of lithium supply in 2024) reduce risk but scale slowly; supplier qualification often takes 12–24 months, keeping incumbents dominant.

Biopharma inputs and CDMOs
APIs, biologics inputs and limited specialized CDMO capacity face strict GMP/regulatory gatekeeping, concentrating supplier power; the global CDMO market was estimated at about $87 billion in 2024, underpinning supplier leverage. Scale CDMOs and single-use tech vendors command pricing power through scarce capacity and proprietary platforms. Lengthy tech-transfer and validation cycles extend buyer dependence and time-to-market risk. Strategic partnerships can exchange lower price for guaranteed capacity and faster speed-to-clinic.

Equipment and IP licensors
- Concentration: handful of OEMs dominate
- IP lock-in: ASML >90% EUV share
- Lead times: typically 6–24 months
- Aftermarket: recurring service/upgrade fees
- Countermeasures: consortium buying, in-house R&D
Human capital and capital providers
Specialist talent in materials, biotech, and digital remains scarce, driving pay premiums above 20% in 2024 and raising retention costs; higher compensation compresses SK’s margins. Rising rates (US fed funds ~5.25–5.50% in 2024) shift bargaining power to lenders and investors for new projects. SK’s brand and ecosystem ease attraction of talent and capital, but competition is intense; equity partnerships de-risk growth while diluting ownership.
- Talent premium: >20% (2024)
- Interest rates: fed funds 5.25–5.50% (2024)
- Equity partners: de-risk vs dilution
Suppliers leverage oil, cobalt, lithium, EUV and CDMO to raise costs; firms use vertical ties
Suppliers hold high leverage across energy (OPEC+ ~45% of crude, 2024), critical minerals (DRC ~70% cobalt, Australia ~60% lithium, recycling <5% lithium, 2024) and chip/biotech equipment (ASML >90% EUV; CDMO market ~$87B, 2024), raising prices and switching costs; SK mitigates via vertical ties, long-term offtakes, hedges and partnerships.
| Category | Key stat (2024) |
|---|---|
| Crude | OPEC+ ~45% |
| Cobalt | DRC ~70% |
| Lithium | Australia ~60%; recycling <5% |
| EUV | ASML >90% |
| CDMO | $87B |
What is included in the product
 Detailed Word Document
Concise Porter's Five Forces analysis for SK that uncovers competitive drivers, buyer and supplier power, threat of substitutes and entrants, and strategic levers protecting or exposing SK’s market position, with actionable insights for investors and strategists.

 Customizable Excel Spreadsheet
Clear, one-sheet SK Porter's Five Forces summary that quickly highlights competitive pressures and strategic levers. Customize scores, swap in your data, and export charts for decks—no macros required, perfect for fast decisions and stakeholder alignment.
Customers Bargaining Power

Large B2B customers and OEMs
Petrochemical buyers, battery OEMs and electronics manufacturers purchase at scale and exert strong price pressure, often negotiating discounts and contractual terms tied to feedstock costs; Brent crude averaged about 86 USD/bbl in 2023, underpinning many indexation formulas. Qualification regimes give buyers switching power once viable alternatives exist, while framework contracts temper spot volatility but embed indexation clauses. Service-level penalties and volume rebates further tilt commercial terms toward large buyers, concentrating bargaining power.
Price transparency and commoditization
Energy and base chemicals trade on benchmark prices (eg Brent averaged about $86/bl in 2024), enabling easy price comparison and global arbitrage across regions and suppliers. Buyers routinely shift volumes to lowest-cost sources, pressuring premiums. True differentiation requires tighter specs, reliability and verified sustainability credentials (eg certified low-carbon feedstocks). Margin capture remains cyclical, widening in tight markets and compressing in oversupply.

Healthcare payers and partners
In biopharma, healthcare payers and licensing partners drive hard bargains on evidence and pricing, and reimbursement risk can erode deal value—often reducing projected NPV by 20–50% unless clinical differentiation is clear. Co-development deals routinely split economics and control, with typical royalty ranges of 10–30% and material governance sharing. Rare-disease or platform assets restore leverage; several gene therapies in market exceed $1M per patient, enabling stronger payer negotiation positions.

Enterprise IT and service clients
Enterprise IT buyers drive competitive RFPs and favor multi-vendor strategies, with Flexera 2024 reporting 92% of organizations using multi-cloud, increasing bargaining leverage. Cloud-native architectures lower switching costs, but outcome-based pricing and strict SLAs shift delivery and financial risk onto suppliers. Deep integration requirements and data residency needs can materially increase client stickiness.
- Multi-vendor RFPs: high
- Flexera 2024: 92% multi-cloud
- Switching costs: reduced by cloud-native
- Outcome-based pricing/SLAs: transfer risk
- Data residency/integration: increases stickiness
ESG and certification demands
Buyers increasingly demand low-carbon, traceable inputs, raising supplier compliance costs; failure to meet standards can exclude suppliers from tenders, especially after the EU Corporate Sustainability Reporting Directive expanded scope in 2024. Meeting verified ESG thresholds enables premium pricing and market access, while certification cycles, typically 1–3 years, create regular renegotiation points.
Buyers' leverage rises as Brent averaged $86/bl in 2024
Large industrial buyers exert strong price leverage via indexed contracts and volume rebates; Brent averaged $86/bl in 2024, anchoring feedstock indexation. Enterprise buyers (Flexera 2024: 92% multi-cloud) lower switching costs and increase negotiation power. CSRD 2024 and ESG demands shift compliance costs to suppliers and create certification-based market access premiums.
| Metric | 2024 |
|---|---|
| Brent | $86/bl |
| Multi-cloud | 92% |
| Biopharma royalty range | 10–30% |
Full Version Awaits
SK Porter's Five Forces Analysis
This preview is the exact SK Porter's Five Forces Analysis document you’ll receive immediately after purchase—no placeholders or mockups. It’s fully formatted and ready to use, containing a detailed evaluation of competitive rivalry, supplier and buyer power, threats of substitutes and new entrants, and actionable insights for strategy and valuation.

From Overview to Strategy Blueprint
SK’s Porter's Five Forces snapshot highlights competitive intensity, supplier and buyer power, threat of substitutes, and barriers to entry—key inputs for strategic decisions. This brief overview surfaces risks and opportunities but omits force-by-force ratings and visuals. Unlock the full Porter's Five Forces Analysis to get a consultant-grade, data-driven breakdown tailored to SK and actionable for investors and strategists.
Suppliers Bargaining Power
Commodity feedstock concentration
Energy and chemicals arms depend on crude, naphtha and specialty gases sourced from a concentrated supplier base, giving suppliers outsized pricing leverage and amplifying pass-through to margins. OPEC+ policies and geopolitical shocks remain key swing factors, with OPEC+ accounting for roughly 45% of global crude production in 2024, tightening availability during cuts. Long-term offtake contracts and hedging materially reduce short-term volatility but cannot eliminate price shocks. Vertical feedstock ties within SK Group mitigate some exposure, yet external procurement still represents a material residual risk to margins.
Critical minerals and advanced materials
Critical-minerals suppliers wield high leverage: batteries and semiconductors rely on lithium, nickel, cobalt and specialty precursors from few qualified sources (DRC ~70% of cobalt, Australia ~60% of lithium mine output in 2023–24), while ESG rules and export controls raise effective switching costs. Multi-sourcing and recycling (recycling <5% of lithium supply in 2024) reduce risk but scale slowly; supplier qualification often takes 12–24 months, keeping incumbents dominant.
Biopharma inputs and CDMOs
APIs, biologics inputs and limited specialized CDMO capacity face strict GMP/regulatory gatekeeping, concentrating supplier power; the global CDMO market was estimated at about $87 billion in 2024, underpinning supplier leverage. Scale CDMOs and single-use tech vendors command pricing power through scarce capacity and proprietary platforms. Lengthy tech-transfer and validation cycles extend buyer dependence and time-to-market risk. Strategic partnerships can exchange lower price for guaranteed capacity and faster speed-to-clinic.
Equipment and IP licensors
- Concentration: handful of OEMs dominate
- IP lock-in: ASML >90% EUV share
- Lead times: typically 6–24 months
- Aftermarket: recurring service/upgrade fees
- Countermeasures: consortium buying, in-house R&D
Human capital and capital providers
Specialist talent in materials, biotech, and digital remains scarce, driving pay premiums above 20% in 2024 and raising retention costs; higher compensation compresses SK’s margins. Rising rates (US fed funds ~5.25–5.50% in 2024) shift bargaining power to lenders and investors for new projects. SK’s brand and ecosystem ease attraction of talent and capital, but competition is intense; equity partnerships de-risk growth while diluting ownership.
- Talent premium: >20% (2024)
- Interest rates: fed funds 5.25–5.50% (2024)
- Equity partners: de-risk vs dilution
Suppliers leverage oil, cobalt, lithium, EUV and CDMO to raise costs; firms use vertical ties
Suppliers hold high leverage across energy (OPEC+ ~45% of crude, 2024), critical minerals (DRC ~70% cobalt, Australia ~60% lithium, recycling <5% lithium, 2024) and chip/biotech equipment (ASML >90% EUV; CDMO market ~$87B, 2024), raising prices and switching costs; SK mitigates via vertical ties, long-term offtakes, hedges and partnerships.
| Category | Key stat (2024) |
|---|---|
| Crude | OPEC+ ~45% |
| Cobalt | DRC ~70% |
| Lithium | Australia ~60%; recycling <5% |
| EUV | ASML >90% |
| CDMO | $87B |
What is included in the product
Detailed Word Document
Concise Porter's Five Forces analysis for SK that uncovers competitive drivers, buyer and supplier power, threat of substitutes and entrants, and strategic levers protecting or exposing SK’s market position, with actionable insights for investors and strategists.
Customizable Excel Spreadsheet
Clear, one-sheet SK Porter's Five Forces summary that quickly highlights competitive pressures and strategic levers. Customize scores, swap in your data, and export charts for decks—no macros required, perfect for fast decisions and stakeholder alignment.
Customers Bargaining Power
Large B2B customers and OEMs
Petrochemical buyers, battery OEMs and electronics manufacturers purchase at scale and exert strong price pressure, often negotiating discounts and contractual terms tied to feedstock costs; Brent crude averaged about 86 USD/bbl in 2023, underpinning many indexation formulas. Qualification regimes give buyers switching power once viable alternatives exist, while framework contracts temper spot volatility but embed indexation clauses. Service-level penalties and volume rebates further tilt commercial terms toward large buyers, concentrating bargaining power.
Price transparency and commoditization
Energy and base chemicals trade on benchmark prices (eg Brent averaged about $86/bl in 2024), enabling easy price comparison and global arbitrage across regions and suppliers. Buyers routinely shift volumes to lowest-cost sources, pressuring premiums. True differentiation requires tighter specs, reliability and verified sustainability credentials (eg certified low-carbon feedstocks). Margin capture remains cyclical, widening in tight markets and compressing in oversupply.
Healthcare payers and partners
In biopharma, healthcare payers and licensing partners drive hard bargains on evidence and pricing, and reimbursement risk can erode deal value—often reducing projected NPV by 20–50% unless clinical differentiation is clear. Co-development deals routinely split economics and control, with typical royalty ranges of 10–30% and material governance sharing. Rare-disease or platform assets restore leverage; several gene therapies in market exceed $1M per patient, enabling stronger payer negotiation positions.
Enterprise IT and service clients
Enterprise IT buyers drive competitive RFPs and favor multi-vendor strategies, with Flexera 2024 reporting 92% of organizations using multi-cloud, increasing bargaining leverage. Cloud-native architectures lower switching costs, but outcome-based pricing and strict SLAs shift delivery and financial risk onto suppliers. Deep integration requirements and data residency needs can materially increase client stickiness.
- Multi-vendor RFPs: high
- Flexera 2024: 92% multi-cloud
- Switching costs: reduced by cloud-native
- Outcome-based pricing/SLAs: transfer risk
- Data residency/integration: increases stickiness
ESG and certification demands
Buyers increasingly demand low-carbon, traceable inputs, raising supplier compliance costs; failure to meet standards can exclude suppliers from tenders, especially after the EU Corporate Sustainability Reporting Directive expanded scope in 2024. Meeting verified ESG thresholds enables premium pricing and market access, while certification cycles, typically 1–3 years, create regular renegotiation points.
Buyers' leverage rises as Brent averaged $86/bl in 2024
Large industrial buyers exert strong price leverage via indexed contracts and volume rebates; Brent averaged $86/bl in 2024, anchoring feedstock indexation. Enterprise buyers (Flexera 2024: 92% multi-cloud) lower switching costs and increase negotiation power. CSRD 2024 and ESG demands shift compliance costs to suppliers and create certification-based market access premiums.
| Metric | 2024 |
|---|---|
| Brent | $86/bl |
| Multi-cloud | 92% |
| Biopharma royalty range | 10–30% |
Full Version Awaits
SK Porter's Five Forces Analysis
This preview is the exact SK Porter's Five Forces Analysis document you’ll receive immediately after purchase—no placeholders or mockups. It’s fully formatted and ready to use, containing a detailed evaluation of competitive rivalry, supplier and buyer power, threats of substitutes and new entrants, and actionable insights for strategy and valuation.
Description
From Overview to Strategy Blueprint
SK’s Porter's Five Forces snapshot highlights competitive intensity, supplier and buyer power, threat of substitutes, and barriers to entry—key inputs for strategic decisions. This brief overview surfaces risks and opportunities but omits force-by-force ratings and visuals. Unlock the full Porter's Five Forces Analysis to get a consultant-grade, data-driven breakdown tailored to SK and actionable for investors and strategists.
Suppliers Bargaining Power
Commodity feedstock concentration
Energy and chemicals arms depend on crude, naphtha and specialty gases sourced from a concentrated supplier base, giving suppliers outsized pricing leverage and amplifying pass-through to margins. OPEC+ policies and geopolitical shocks remain key swing factors, with OPEC+ accounting for roughly 45% of global crude production in 2024, tightening availability during cuts. Long-term offtake contracts and hedging materially reduce short-term volatility but cannot eliminate price shocks. Vertical feedstock ties within SK Group mitigate some exposure, yet external procurement still represents a material residual risk to margins.
Critical minerals and advanced materials
Critical-minerals suppliers wield high leverage: batteries and semiconductors rely on lithium, nickel, cobalt and specialty precursors from few qualified sources (DRC ~70% of cobalt, Australia ~60% of lithium mine output in 2023–24), while ESG rules and export controls raise effective switching costs. Multi-sourcing and recycling (recycling <5% of lithium supply in 2024) reduce risk but scale slowly; supplier qualification often takes 12–24 months, keeping incumbents dominant.
Biopharma inputs and CDMOs
APIs, biologics inputs and limited specialized CDMO capacity face strict GMP/regulatory gatekeeping, concentrating supplier power; the global CDMO market was estimated at about $87 billion in 2024, underpinning supplier leverage. Scale CDMOs and single-use tech vendors command pricing power through scarce capacity and proprietary platforms. Lengthy tech-transfer and validation cycles extend buyer dependence and time-to-market risk. Strategic partnerships can exchange lower price for guaranteed capacity and faster speed-to-clinic.
Equipment and IP licensors
- Concentration: handful of OEMs dominate
- IP lock-in: ASML >90% EUV share
- Lead times: typically 6–24 months
- Aftermarket: recurring service/upgrade fees
- Countermeasures: consortium buying, in-house R&D
Human capital and capital providers
Specialist talent in materials, biotech, and digital remains scarce, driving pay premiums above 20% in 2024 and raising retention costs; higher compensation compresses SK’s margins. Rising rates (US fed funds ~5.25–5.50% in 2024) shift bargaining power to lenders and investors for new projects. SK’s brand and ecosystem ease attraction of talent and capital, but competition is intense; equity partnerships de-risk growth while diluting ownership.
- Talent premium: >20% (2024)
- Interest rates: fed funds 5.25–5.50% (2024)
- Equity partners: de-risk vs dilution
Suppliers leverage oil, cobalt, lithium, EUV and CDMO to raise costs; firms use vertical ties
Suppliers hold high leverage across energy (OPEC+ ~45% of crude, 2024), critical minerals (DRC ~70% cobalt, Australia ~60% lithium, recycling <5% lithium, 2024) and chip/biotech equipment (ASML >90% EUV; CDMO market ~$87B, 2024), raising prices and switching costs; SK mitigates via vertical ties, long-term offtakes, hedges and partnerships.
| Category | Key stat (2024) |
|---|---|
| Crude | OPEC+ ~45% |
| Cobalt | DRC ~70% |
| Lithium | Australia ~60%; recycling <5% |
| EUV | ASML >90% |
| CDMO | $87B |
What is included in the product
Detailed Word Document
Concise Porter's Five Forces analysis for SK that uncovers competitive drivers, buyer and supplier power, threat of substitutes and entrants, and strategic levers protecting or exposing SK’s market position, with actionable insights for investors and strategists.
Customizable Excel Spreadsheet
Clear, one-sheet SK Porter's Five Forces summary that quickly highlights competitive pressures and strategic levers. Customize scores, swap in your data, and export charts for decks—no macros required, perfect for fast decisions and stakeholder alignment.
Customers Bargaining Power
Large B2B customers and OEMs
Petrochemical buyers, battery OEMs and electronics manufacturers purchase at scale and exert strong price pressure, often negotiating discounts and contractual terms tied to feedstock costs; Brent crude averaged about 86 USD/bbl in 2023, underpinning many indexation formulas. Qualification regimes give buyers switching power once viable alternatives exist, while framework contracts temper spot volatility but embed indexation clauses. Service-level penalties and volume rebates further tilt commercial terms toward large buyers, concentrating bargaining power.
Price transparency and commoditization
Energy and base chemicals trade on benchmark prices (eg Brent averaged about $86/bl in 2024), enabling easy price comparison and global arbitrage across regions and suppliers. Buyers routinely shift volumes to lowest-cost sources, pressuring premiums. True differentiation requires tighter specs, reliability and verified sustainability credentials (eg certified low-carbon feedstocks). Margin capture remains cyclical, widening in tight markets and compressing in oversupply.
Healthcare payers and partners
In biopharma, healthcare payers and licensing partners drive hard bargains on evidence and pricing, and reimbursement risk can erode deal value—often reducing projected NPV by 20–50% unless clinical differentiation is clear. Co-development deals routinely split economics and control, with typical royalty ranges of 10–30% and material governance sharing. Rare-disease or platform assets restore leverage; several gene therapies in market exceed $1M per patient, enabling stronger payer negotiation positions.
Enterprise IT and service clients
Enterprise IT buyers drive competitive RFPs and favor multi-vendor strategies, with Flexera 2024 reporting 92% of organizations using multi-cloud, increasing bargaining leverage. Cloud-native architectures lower switching costs, but outcome-based pricing and strict SLAs shift delivery and financial risk onto suppliers. Deep integration requirements and data residency needs can materially increase client stickiness.
- Multi-vendor RFPs: high
- Flexera 2024: 92% multi-cloud
- Switching costs: reduced by cloud-native
- Outcome-based pricing/SLAs: transfer risk
- Data residency/integration: increases stickiness
ESG and certification demands
Buyers increasingly demand low-carbon, traceable inputs, raising supplier compliance costs; failure to meet standards can exclude suppliers from tenders, especially after the EU Corporate Sustainability Reporting Directive expanded scope in 2024. Meeting verified ESG thresholds enables premium pricing and market access, while certification cycles, typically 1–3 years, create regular renegotiation points.
Buyers' leverage rises as Brent averaged $86/bl in 2024
Large industrial buyers exert strong price leverage via indexed contracts and volume rebates; Brent averaged $86/bl in 2024, anchoring feedstock indexation. Enterprise buyers (Flexera 2024: 92% multi-cloud) lower switching costs and increase negotiation power. CSRD 2024 and ESG demands shift compliance costs to suppliers and create certification-based market access premiums.
| Metric | 2024 |
|---|---|
| Brent | $86/bl |
| Multi-cloud | 92% |
| Biopharma royalty range | 10–30% |
Full Version Awaits
SK Porter's Five Forces Analysis
This preview is the exact SK Porter's Five Forces Analysis document you’ll receive immediately after purchase—no placeholders or mockups. It’s fully formatted and ready to use, containing a detailed evaluation of competitive rivalry, supplier and buyer power, threats of substitutes and new entrants, and actionable insights for strategy and valuation.











