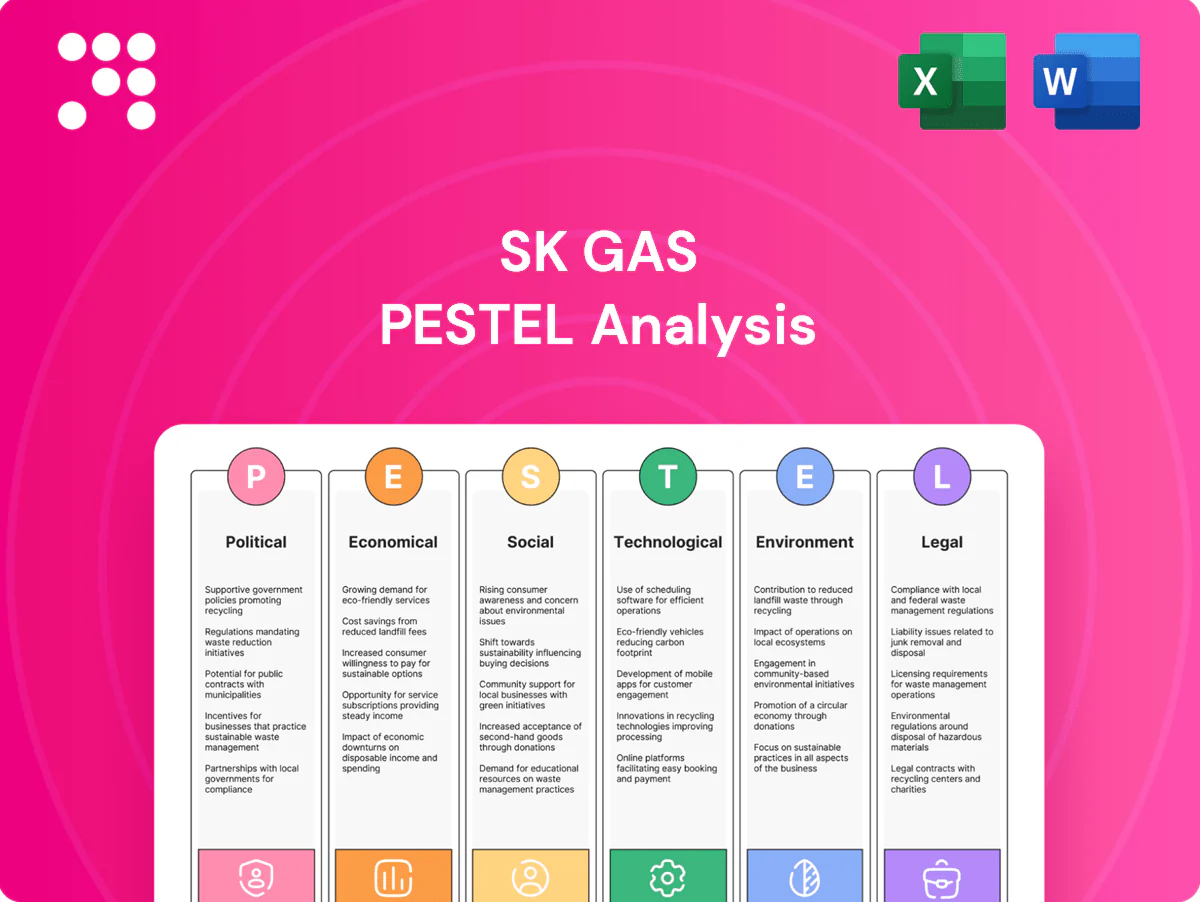
SK Gas PESTLE Analysis

Make Smarter Strategic Decisions with a Complete PESTEL View
Discover how political shifts, economic trends, social dynamics, technological advances, legal changes, and environmental pressures are shaping SK Gas’s strategic path. This concise PESTLE snapshot highlights risks and opportunities for investors and planners. Use it to inform decisions and de-risk strategies—purchase the full, editable analysis for the complete, actionable intelligence.
Political factors

Energy security and import dependence
South Korea imports nearly 100% of LPG and over 95% of its LNG, making SK Gas highly sensitive to supplier diplomacy and chokepoints on shipping routes; spot LNG prices surged in 2022–23, illustrating disruption risk. Government energy security measures include strategic stockpiles and diversification, while the 2040 hydrogen roadmap targets 6.2 Mt/yr production, pushing incentives for hydrogen and ammonia as hedges.
Government decarbonization agenda
South Korea's net-zero by 2050 pledge and 2030 NDC (40% GHG reduction from BAU) shift policy from coal to gas and low-carbon fuels, boosting SK Gas as a transitional gas provider. The company benefits from support for gas-fired assets but faces pressure to scale hydrogen and ammonia investments as hydrogen policy expands. Changing administrations can recalibrate targets and subsidies, so stable alignment with national plans is critical for capital allocation.

Industrial policy and subsidies
Seoul promotes hydrogen, fuel cells and clean ammonia via grants and tax credits, aligning with South Korea’s national target of 6.2 million hydrogen vehicles by 2040 and expanded hydrogen roadmaps through 2025. SK Gas can access pilot and infrastructure funding from national and municipal programs, but competitive allocation demands strong partnerships and local-content commitments. Any tapering or policy re-prioritization would slow project pipelines and capital deployment.

Regulatory influence of state-owned entities
Coordination with KEPCO and state utilities governs plant dispatch and market pricing, affecting SK Gas merchant gas-fired and hydrogen co-firing economics. Public procurement increasingly favors low-carbon fuels, raising demand for certified hydrogen; South Korea's Hydrogen Economy Roadmap targets 6.2 million tonnes H2 by 2040. Political oversight of offtake contracts can tighten or loosen revenue visibility for new projects.
- Grid/operator influence: KEPCO central to dispatch
- Procurement: tilting toward low-carbon fuels
- Roadmap: 6.2M t H2 by 2040
- Risk: political oversight alters offtake certainty
Trade policies and carbon border measures
Carbon border adjustments such as the EU CBAM and foreign fuel standards reshape import economics and export access; with EU ETS carbon prices around €80–100/t in 2024–25, SK Gas faces material cost exposure. Ammonia and hydrogen trade corridors hinge on bilateral agreements (e.g., Australia, Middle East) and tariff shifts on equipment/feedstocks can move project CAPEX several percent; diplomatic engagement is essential to lock multi‑year offtakes.
- CBAM/EU ETS: ~€80–100/t (2024–25)
- Trade corridors: bilateral pacts required
- Tariff risk: affects CAPEX/OPEX
- Diplomacy: secures long-term contracts
Import risk: >95% LNG and ~100% LPG; ETS €80–100/t
SK Gas faces high exposure from ~100% LPG and >95% LNG import dependence, with 2022–23 spot LNG shocks highlighting supply-chain risk. Net-zero 2050 and 2030 NDC (40% GHG cut) plus the hydrogen roadmap (6.2 Mt H2 by 2040) favor gas-to-hydrogen transition and subsidy access. EU ETS ~€80–100/t (2024–25), CBAM and KEPCO dispatch control create cost and revenue-policy risks.
| Indicator | 2024–25 Value | Political Impact |
|---|---|---|
| LNG import dependency | >95% | High supply risk |
| LPG import dependency | ~100% | High vulnerability |
| H2 roadmap | 6.2 Mt by 2040 | Incentivizes H2 investment |
| EU ETS / CBAM | €80–100/t | Cost pressure on fuels |
| Grid/dispatch | KEPCO central | Affects revenues |
What is included in the product
 Detailed Word Document
Explores how Political, Economic, Social, Technological, Environmental, and Legal forces uniquely impact SK Gas, with data-backed trends and region-specific regulatory context to identify risks and opportunities; designed for executives, investors, and strategists seeking forward-looking insights for scenario planning, funding readiness, and competitive positioning.

 Customizable Excel Spreadsheet
A concise, visually segmented PESTLE summary of SK Gas designed for quick insertion into presentations or strategy packs, editable for regional/business context and easily shared across teams to streamline risk discussions and market-positioning decisions.
Economic factors

Commodity price volatility
Asian LNG spot (JKM) surged near US$70/MMBtu in 2022 then eased to roughly US$20–30/MMBtu in 2023 and about US$15/MMBtu in mid‑2024 (Platts/IEA), creating wide margin swings for SK Gas across import, storage and distribution; hedging and long‑term contracts are therefore essential. Volatility shifts gas‑fired plant dispatch economics vs coal/renewables and price cycles dictate timing of investments in hydrogen and other alternatives.
Domestic demand dynamics
Residential and industrial LPG demand in South Korea reached about 5.6 million tonnes in 2023, directly affecting SK Gas throughput and storage utilization. Electrification and efficiency gains have pressured domestic LPG volumes, while petrochemical feedstock demand — up roughly 2–3% in 2024 — helps offset losses. Peak power market periods elevate gas-fired plants as balancing assets, with LNG/gas generation around 24% of electricity mix in 2024. Economic cycles across Korea and Asia transmit demand volatility into end markets and margins.

Capital intensity and financing costs
Power generation, terminals and hydrogen/ammonia infrastructure require very large capex, typically in the hundreds of millions to several billion USD per project. Interest rates and credit spreads (policy rates in major markets ~3–5% in 2024–25) materially affect project IRR and bankability. Access to green finance (which can cut WACC by roughly 10–50 bps) improves economics for low‑carbon builds. Robust offtake contracts (PPAs, tolling) raise debt sizing to 60–80% LTV and reduce financing cost.

Currency and shipping costs
USD-denominated LPG and LNG purchases expose SK Gas to FX risk as KRW traded around 1,300 per USD in 2024, amplifying cost volatility versus KRW revenue streams; freight rates and Suez/Panama canal fees directly raise delivered costs and can swing margins. Supply-chain bottlenecks in 2023–24 tightened spreads; active hedging and logistics optimization are essential to sustain profitability.
- FX exposure: USD/KRW ~1,300 (2024)
- Higher freight/canal fees increase delivered cost
- Bottlenecks compress spreads
- Hedging + logistics management protect margins
Competition and market liberalization
Market openness in gas and power in South Korea increases spot-price exposure and pressures SK Gas’s pricing power and customer retention as retail competition expands.
New entrants in hydrogen and ammonia, aligned with Korea’s hydrogen roadmap targeting 6.2 million tonnes by 2040, raise rivalry for feedstock and project opportunities.
Vertical integration into petrochemicals supports margin resilience while SK Gas’s scale and network assets (terminals, distribution) remain structural competitive advantages.
- Market openness: higher spot exposure
- Hydrogen/ammonia: competition rising (Korea target 6.2 Mt by 2040)
- Integration: petrochemicals = margin buffer
- Scale: terminals & networks = barrier to entry
Import risk: >95% LNG and ~100% LPG; ETS €80–100/t
Volatile JKM (≈US$15/MMBtu mid‑2024) and USD/KRW ≈1,300 (2024) drive margin swings and FX risk for SK Gas; hedging and long‑term contracts are essential. Domestic LPG demand ~5.6 Mt (2023) and LNG in power ≈24% (2024) keep throughput resilient while electrification pressures volumes. Project capex runs hundreds of millions–several billion USD; policy rates ~3–5% (2024–25) affect bankability and IRR.
| Metric | Value |
|---|---|
| JKM (mid‑2024) | ≈US$15/MMBtu |
| LPG demand (KR) | ≈5.6 Mt (2023) |
| LNG share in power | ≈24% (2024) |
| USD/KRW | ≈1,300 (2024) |
| Policy rates | ≈3–5% (2024–25) |
Preview Before You Purchase
SK Gas PESTLE Analysis
The preview shown here is the exact SK Gas PESTLE analysis document you'll receive after purchase—fully formatted and ready to use. The content, structure, and professional layout visible are identical to the downloadable file with no placeholders or surprises. After payment you'll instantly be able to download this finished report for immediate use.

Make Smarter Strategic Decisions with a Complete PESTEL View
Discover how political shifts, economic trends, social dynamics, technological advances, legal changes, and environmental pressures are shaping SK Gas’s strategic path. This concise PESTLE snapshot highlights risks and opportunities for investors and planners. Use it to inform decisions and de-risk strategies—purchase the full, editable analysis for the complete, actionable intelligence.
Political factors
Energy security and import dependence
South Korea imports nearly 100% of LPG and over 95% of its LNG, making SK Gas highly sensitive to supplier diplomacy and chokepoints on shipping routes; spot LNG prices surged in 2022–23, illustrating disruption risk. Government energy security measures include strategic stockpiles and diversification, while the 2040 hydrogen roadmap targets 6.2 Mt/yr production, pushing incentives for hydrogen and ammonia as hedges.
Government decarbonization agenda
South Korea's net-zero by 2050 pledge and 2030 NDC (40% GHG reduction from BAU) shift policy from coal to gas and low-carbon fuels, boosting SK Gas as a transitional gas provider. The company benefits from support for gas-fired assets but faces pressure to scale hydrogen and ammonia investments as hydrogen policy expands. Changing administrations can recalibrate targets and subsidies, so stable alignment with national plans is critical for capital allocation.
Industrial policy and subsidies
Seoul promotes hydrogen, fuel cells and clean ammonia via grants and tax credits, aligning with South Korea’s national target of 6.2 million hydrogen vehicles by 2040 and expanded hydrogen roadmaps through 2025. SK Gas can access pilot and infrastructure funding from national and municipal programs, but competitive allocation demands strong partnerships and local-content commitments. Any tapering or policy re-prioritization would slow project pipelines and capital deployment.
Regulatory influence of state-owned entities
Coordination with KEPCO and state utilities governs plant dispatch and market pricing, affecting SK Gas merchant gas-fired and hydrogen co-firing economics. Public procurement increasingly favors low-carbon fuels, raising demand for certified hydrogen; South Korea's Hydrogen Economy Roadmap targets 6.2 million tonnes H2 by 2040. Political oversight of offtake contracts can tighten or loosen revenue visibility for new projects.
- Grid/operator influence: KEPCO central to dispatch
- Procurement: tilting toward low-carbon fuels
- Roadmap: 6.2M t H2 by 2040
- Risk: political oversight alters offtake certainty
Trade policies and carbon border measures
Carbon border adjustments such as the EU CBAM and foreign fuel standards reshape import economics and export access; with EU ETS carbon prices around €80–100/t in 2024–25, SK Gas faces material cost exposure. Ammonia and hydrogen trade corridors hinge on bilateral agreements (e.g., Australia, Middle East) and tariff shifts on equipment/feedstocks can move project CAPEX several percent; diplomatic engagement is essential to lock multi‑year offtakes.
- CBAM/EU ETS: ~€80–100/t (2024–25)
- Trade corridors: bilateral pacts required
- Tariff risk: affects CAPEX/OPEX
- Diplomacy: secures long-term contracts
Import risk: >95% LNG and ~100% LPG; ETS €80–100/t
SK Gas faces high exposure from ~100% LPG and >95% LNG import dependence, with 2022–23 spot LNG shocks highlighting supply-chain risk. Net-zero 2050 and 2030 NDC (40% GHG cut) plus the hydrogen roadmap (6.2 Mt H2 by 2040) favor gas-to-hydrogen transition and subsidy access. EU ETS ~€80–100/t (2024–25), CBAM and KEPCO dispatch control create cost and revenue-policy risks.
| Indicator | 2024–25 Value | Political Impact |
|---|---|---|
| LNG import dependency | >95% | High supply risk |
| LPG import dependency | ~100% | High vulnerability |
| H2 roadmap | 6.2 Mt by 2040 | Incentivizes H2 investment |
| EU ETS / CBAM | €80–100/t | Cost pressure on fuels |
| Grid/dispatch | KEPCO central | Affects revenues |
What is included in the product
Detailed Word Document
Explores how Political, Economic, Social, Technological, Environmental, and Legal forces uniquely impact SK Gas, with data-backed trends and region-specific regulatory context to identify risks and opportunities; designed for executives, investors, and strategists seeking forward-looking insights for scenario planning, funding readiness, and competitive positioning.
Customizable Excel Spreadsheet
A concise, visually segmented PESTLE summary of SK Gas designed for quick insertion into presentations or strategy packs, editable for regional/business context and easily shared across teams to streamline risk discussions and market-positioning decisions.
Economic factors
Commodity price volatility
Asian LNG spot (JKM) surged near US$70/MMBtu in 2022 then eased to roughly US$20–30/MMBtu in 2023 and about US$15/MMBtu in mid‑2024 (Platts/IEA), creating wide margin swings for SK Gas across import, storage and distribution; hedging and long‑term contracts are therefore essential. Volatility shifts gas‑fired plant dispatch economics vs coal/renewables and price cycles dictate timing of investments in hydrogen and other alternatives.
Domestic demand dynamics
Residential and industrial LPG demand in South Korea reached about 5.6 million tonnes in 2023, directly affecting SK Gas throughput and storage utilization. Electrification and efficiency gains have pressured domestic LPG volumes, while petrochemical feedstock demand — up roughly 2–3% in 2024 — helps offset losses. Peak power market periods elevate gas-fired plants as balancing assets, with LNG/gas generation around 24% of electricity mix in 2024. Economic cycles across Korea and Asia transmit demand volatility into end markets and margins.
Capital intensity and financing costs
Power generation, terminals and hydrogen/ammonia infrastructure require very large capex, typically in the hundreds of millions to several billion USD per project. Interest rates and credit spreads (policy rates in major markets ~3–5% in 2024–25) materially affect project IRR and bankability. Access to green finance (which can cut WACC by roughly 10–50 bps) improves economics for low‑carbon builds. Robust offtake contracts (PPAs, tolling) raise debt sizing to 60–80% LTV and reduce financing cost.
Currency and shipping costs
USD-denominated LPG and LNG purchases expose SK Gas to FX risk as KRW traded around 1,300 per USD in 2024, amplifying cost volatility versus KRW revenue streams; freight rates and Suez/Panama canal fees directly raise delivered costs and can swing margins. Supply-chain bottlenecks in 2023–24 tightened spreads; active hedging and logistics optimization are essential to sustain profitability.
- FX exposure: USD/KRW ~1,300 (2024)
- Higher freight/canal fees increase delivered cost
- Bottlenecks compress spreads
- Hedging + logistics management protect margins
Competition and market liberalization
Market openness in gas and power in South Korea increases spot-price exposure and pressures SK Gas’s pricing power and customer retention as retail competition expands.
New entrants in hydrogen and ammonia, aligned with Korea’s hydrogen roadmap targeting 6.2 million tonnes by 2040, raise rivalry for feedstock and project opportunities.
Vertical integration into petrochemicals supports margin resilience while SK Gas’s scale and network assets (terminals, distribution) remain structural competitive advantages.
- Market openness: higher spot exposure
- Hydrogen/ammonia: competition rising (Korea target 6.2 Mt by 2040)
- Integration: petrochemicals = margin buffer
- Scale: terminals & networks = barrier to entry
Import risk: >95% LNG and ~100% LPG; ETS €80–100/t
Volatile JKM (≈US$15/MMBtu mid‑2024) and USD/KRW ≈1,300 (2024) drive margin swings and FX risk for SK Gas; hedging and long‑term contracts are essential. Domestic LPG demand ~5.6 Mt (2023) and LNG in power ≈24% (2024) keep throughput resilient while electrification pressures volumes. Project capex runs hundreds of millions–several billion USD; policy rates ~3–5% (2024–25) affect bankability and IRR.
| Metric | Value |
|---|---|
| JKM (mid‑2024) | ≈US$15/MMBtu |
| LPG demand (KR) | ≈5.6 Mt (2023) |
| LNG share in power | ≈24% (2024) |
| USD/KRW | ≈1,300 (2024) |
| Policy rates | ≈3–5% (2024–25) |
Preview Before You Purchase
SK Gas PESTLE Analysis
The preview shown here is the exact SK Gas PESTLE analysis document you'll receive after purchase—fully formatted and ready to use. The content, structure, and professional layout visible are identical to the downloadable file with no placeholders or surprises. After payment you'll instantly be able to download this finished report for immediate use.
Description
Make Smarter Strategic Decisions with a Complete PESTEL View
Discover how political shifts, economic trends, social dynamics, technological advances, legal changes, and environmental pressures are shaping SK Gas’s strategic path. This concise PESTLE snapshot highlights risks and opportunities for investors and planners. Use it to inform decisions and de-risk strategies—purchase the full, editable analysis for the complete, actionable intelligence.
Political factors
Energy security and import dependence
South Korea imports nearly 100% of LPG and over 95% of its LNG, making SK Gas highly sensitive to supplier diplomacy and chokepoints on shipping routes; spot LNG prices surged in 2022–23, illustrating disruption risk. Government energy security measures include strategic stockpiles and diversification, while the 2040 hydrogen roadmap targets 6.2 Mt/yr production, pushing incentives for hydrogen and ammonia as hedges.
Government decarbonization agenda
South Korea's net-zero by 2050 pledge and 2030 NDC (40% GHG reduction from BAU) shift policy from coal to gas and low-carbon fuels, boosting SK Gas as a transitional gas provider. The company benefits from support for gas-fired assets but faces pressure to scale hydrogen and ammonia investments as hydrogen policy expands. Changing administrations can recalibrate targets and subsidies, so stable alignment with national plans is critical for capital allocation.
Industrial policy and subsidies
Seoul promotes hydrogen, fuel cells and clean ammonia via grants and tax credits, aligning with South Korea’s national target of 6.2 million hydrogen vehicles by 2040 and expanded hydrogen roadmaps through 2025. SK Gas can access pilot and infrastructure funding from national and municipal programs, but competitive allocation demands strong partnerships and local-content commitments. Any tapering or policy re-prioritization would slow project pipelines and capital deployment.
Regulatory influence of state-owned entities
Coordination with KEPCO and state utilities governs plant dispatch and market pricing, affecting SK Gas merchant gas-fired and hydrogen co-firing economics. Public procurement increasingly favors low-carbon fuels, raising demand for certified hydrogen; South Korea's Hydrogen Economy Roadmap targets 6.2 million tonnes H2 by 2040. Political oversight of offtake contracts can tighten or loosen revenue visibility for new projects.
- Grid/operator influence: KEPCO central to dispatch
- Procurement: tilting toward low-carbon fuels
- Roadmap: 6.2M t H2 by 2040
- Risk: political oversight alters offtake certainty
Trade policies and carbon border measures
Carbon border adjustments such as the EU CBAM and foreign fuel standards reshape import economics and export access; with EU ETS carbon prices around €80–100/t in 2024–25, SK Gas faces material cost exposure. Ammonia and hydrogen trade corridors hinge on bilateral agreements (e.g., Australia, Middle East) and tariff shifts on equipment/feedstocks can move project CAPEX several percent; diplomatic engagement is essential to lock multi‑year offtakes.
- CBAM/EU ETS: ~€80–100/t (2024–25)
- Trade corridors: bilateral pacts required
- Tariff risk: affects CAPEX/OPEX
- Diplomacy: secures long-term contracts
Import risk: >95% LNG and ~100% LPG; ETS €80–100/t
SK Gas faces high exposure from ~100% LPG and >95% LNG import dependence, with 2022–23 spot LNG shocks highlighting supply-chain risk. Net-zero 2050 and 2030 NDC (40% GHG cut) plus the hydrogen roadmap (6.2 Mt H2 by 2040) favor gas-to-hydrogen transition and subsidy access. EU ETS ~€80–100/t (2024–25), CBAM and KEPCO dispatch control create cost and revenue-policy risks.
| Indicator | 2024–25 Value | Political Impact |
|---|---|---|
| LNG import dependency | >95% | High supply risk |
| LPG import dependency | ~100% | High vulnerability |
| H2 roadmap | 6.2 Mt by 2040 | Incentivizes H2 investment |
| EU ETS / CBAM | €80–100/t | Cost pressure on fuels |
| Grid/dispatch | KEPCO central | Affects revenues |
What is included in the product
Detailed Word Document
Explores how Political, Economic, Social, Technological, Environmental, and Legal forces uniquely impact SK Gas, with data-backed trends and region-specific regulatory context to identify risks and opportunities; designed for executives, investors, and strategists seeking forward-looking insights for scenario planning, funding readiness, and competitive positioning.
Customizable Excel Spreadsheet
A concise, visually segmented PESTLE summary of SK Gas designed for quick insertion into presentations or strategy packs, editable for regional/business context and easily shared across teams to streamline risk discussions and market-positioning decisions.
Economic factors
Commodity price volatility
Asian LNG spot (JKM) surged near US$70/MMBtu in 2022 then eased to roughly US$20–30/MMBtu in 2023 and about US$15/MMBtu in mid‑2024 (Platts/IEA), creating wide margin swings for SK Gas across import, storage and distribution; hedging and long‑term contracts are therefore essential. Volatility shifts gas‑fired plant dispatch economics vs coal/renewables and price cycles dictate timing of investments in hydrogen and other alternatives.
Domestic demand dynamics
Residential and industrial LPG demand in South Korea reached about 5.6 million tonnes in 2023, directly affecting SK Gas throughput and storage utilization. Electrification and efficiency gains have pressured domestic LPG volumes, while petrochemical feedstock demand — up roughly 2–3% in 2024 — helps offset losses. Peak power market periods elevate gas-fired plants as balancing assets, with LNG/gas generation around 24% of electricity mix in 2024. Economic cycles across Korea and Asia transmit demand volatility into end markets and margins.
Capital intensity and financing costs
Power generation, terminals and hydrogen/ammonia infrastructure require very large capex, typically in the hundreds of millions to several billion USD per project. Interest rates and credit spreads (policy rates in major markets ~3–5% in 2024–25) materially affect project IRR and bankability. Access to green finance (which can cut WACC by roughly 10–50 bps) improves economics for low‑carbon builds. Robust offtake contracts (PPAs, tolling) raise debt sizing to 60–80% LTV and reduce financing cost.
Currency and shipping costs
USD-denominated LPG and LNG purchases expose SK Gas to FX risk as KRW traded around 1,300 per USD in 2024, amplifying cost volatility versus KRW revenue streams; freight rates and Suez/Panama canal fees directly raise delivered costs and can swing margins. Supply-chain bottlenecks in 2023–24 tightened spreads; active hedging and logistics optimization are essential to sustain profitability.
- FX exposure: USD/KRW ~1,300 (2024)
- Higher freight/canal fees increase delivered cost
- Bottlenecks compress spreads
- Hedging + logistics management protect margins
Competition and market liberalization
Market openness in gas and power in South Korea increases spot-price exposure and pressures SK Gas’s pricing power and customer retention as retail competition expands.
New entrants in hydrogen and ammonia, aligned with Korea’s hydrogen roadmap targeting 6.2 million tonnes by 2040, raise rivalry for feedstock and project opportunities.
Vertical integration into petrochemicals supports margin resilience while SK Gas’s scale and network assets (terminals, distribution) remain structural competitive advantages.
- Market openness: higher spot exposure
- Hydrogen/ammonia: competition rising (Korea target 6.2 Mt by 2040)
- Integration: petrochemicals = margin buffer
- Scale: terminals & networks = barrier to entry
Import risk: >95% LNG and ~100% LPG; ETS €80–100/t
Volatile JKM (≈US$15/MMBtu mid‑2024) and USD/KRW ≈1,300 (2024) drive margin swings and FX risk for SK Gas; hedging and long‑term contracts are essential. Domestic LPG demand ~5.6 Mt (2023) and LNG in power ≈24% (2024) keep throughput resilient while electrification pressures volumes. Project capex runs hundreds of millions–several billion USD; policy rates ~3–5% (2024–25) affect bankability and IRR.
| Metric | Value |
|---|---|
| JKM (mid‑2024) | ≈US$15/MMBtu |
| LPG demand (KR) | ≈5.6 Mt (2023) |
| LNG share in power | ≈24% (2024) |
| USD/KRW | ≈1,300 (2024) |
| Policy rates | ≈3–5% (2024–25) |
Preview Before You Purchase
SK Gas PESTLE Analysis
The preview shown here is the exact SK Gas PESTLE analysis document you'll receive after purchase—fully formatted and ready to use. The content, structure, and professional layout visible are identical to the downloadable file with no placeholders or surprises. After payment you'll instantly be able to download this finished report for immediate use.











