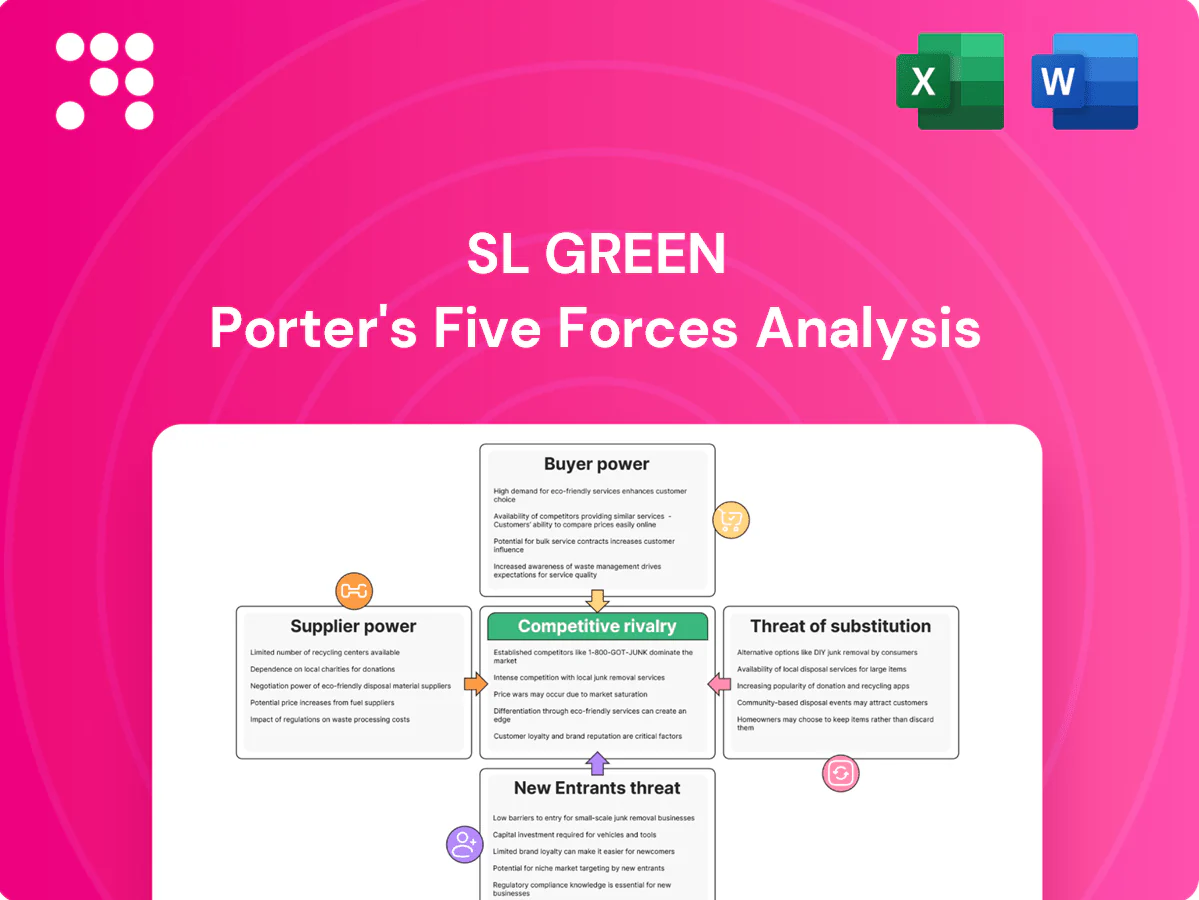
SL Green Porter's Five Forces Analysis

A Must-Have Tool for Decision-Makers
SL Green’s Porter's Five Forces snapshot highlights concentrated tenant bargaining in NYC office markets, moderate supplier power, elevated rivalry from mixed-use landlords, low threat of substitutes for prime office space, and barriers that temper new entrants; this brief hints at strategic risks and upside. Unlock the full Porter's Five Forces Analysis for force-by-force ratings, visuals, and actionable recommendations.
Suppliers Bargaining Power

Concentrated contractors and unions
Concentrated construction firms, specialty trades and strong building-trades unions in NYC give suppliers price and timeline leverage, with union density in construction around 70% in 2024. Labor contracts and prevailing-wage rules raise fixed costs and constrain flexibility, squeezing redevelopment margins. Work stoppages or delays can materially push back leasing readiness. SL Green uses multi-vendor panels and long-term partners but remains exposed to citywide wage dynamics.
Utility and infrastructure dependence
Power, water, steam and telecom in Manhattan are supplied by dominant incumbents—Con Edison for electricity/steam and a small set of carriers (Verizon, Charter/Spectrum) for telecom—keeping switching costs high and baseline supplier power elevated. NYC Local Law 97 emissions limits (phases effective from 2024) and electrification/retrofit requirements can compress margins during upgrades and trigger higher utility capacity or redundancy spend to meet Class A tenant reliability. SL Green mitigates via bulk and portfolio agreements, but supplier leverage remains materially high.

Capital providers and lenders
Debt and equity capital are critical inputs for SL Green acquisitions and redevelopments, making lenders de facto suppliers; with the federal funds rate near 5.25% in mid-2024 and roughly $1.4 trillion of US CRE loans maturing in 2024–25, tighter credit pushed wider spreads and tougher covenants, strengthening lender bargaining power. Refinancing risk alters asset strategy and disposition timing, while relationship banking and diversified funding channels partially offset this leverage.

Technology and building systems vendors
Technology and building-systems vendors (elevators, HVAC, access control, smart-building platforms) are dominated by four OEMs—Otis, KONE, Schindler and Thyssenkrupp—which together hold roughly 70% market share, creating supplier leverage. Proprietary systems and 25–30 year replacement cycles produce lock-in and higher lifecycle costs, while integration demands for ESG reporting and tenant-experience apps further concentrate vendor choice. SL Green mitigates this by negotiating portfolio-wide service contracts to capture scale and price efficiencies.
- Major OEM concentration ~70%
- Modernization cycle 25–30 years
- Portfolio-wide contracts reduce unit service costs
Regulators and permitting authorities
Zoning boards, Landmarks, DOB and environmental agencies function as gatekeepers for SL Green redevelopment, with permitting timelines often adding 6–18 months and significant cost uncertainty. Local Law 97, set at $268/metric-ton CO2e in 2024, plus ESG mandates, drives incremental capex; proactive compliance planning and stakeholder engagement can smooth approvals but cannot eliminate regulatory risk.
- Gatekeepers: zoning, Landmarks, DOB, env agencies
- Timelines: 6–18 months adds cost/uncertainty
- LL97: $268/ton CO2e (2024) increases capex
- Mitigation: proactive planning ≠ risk elimination
High supplier concentration, unionized labor and utilities squeeze margins and raise capex risk
High supplier concentration (construction unions ~70% in 2024; OEMs ~70%) and utility incumbents (Con Edison, Verizon/Charter) raise costs and switching barriers. Labor contracts, LL97 ($268/ton CO2e, 2024) and higher rates (fed funds ~5.25% mid-2024) compress margins and raise capex/refi risk. SL Green uses portfolio contracts, multi-vendor panels and relationship lending to mitigate exposure.
| Supplier | Concentration | Key metric | Mitigation |
|---|---|---|---|
| Labor/unions | High | 70% density (2024) | Multi-vendor |
| Utilities | Local monopolies | LL97 $268/t | Bulk agreements |
| Capital | Fragmented but tight | $1.4T CRE maturing (24–25) | diverse funding |
What is included in the product
 Detailed Word Document
Tailored Porter’s Five Forces analysis for SL Green that uncovers key drivers of competition, buyer and supplier power, entry barriers, substitutes, and disruptive threats; delivers detailed, strategic commentary on pricing influence and market positioning to inform investor, executive, and academic use.

 Customizable Excel Spreadsheet
A concise, one-sheet Porter’s Five Forces for SL Green that highlights landlord-tenant, leasing, and development pressures—ready to drop into presentations and updated instantly as market data or scenarios evolve.
Customers Bargaining Power

Large anchor tenants negotiate hard
Large anchor tenants—financial, law, and tech firms—leverage scale to secure deep concessions on term length, tenant improvement allowances, free rent and flexibility clauses, often negotiating multiyear caps and bespoke exit options. Their commitments lower lease-up risk for SL Green but compress landlord economics through higher upfront TI and rent abatements; with Manhattan office vacancy still elevated in 2024 (~16%), competition for marquee names further increases tenant bargaining power.
High vacancy elevates tenant leverage
Manhattan office availability remained above 15% in 2024, giving tenants expanding options. Landlords increasingly compete on lower rents, larger TI allowances and upgraded amenities to fill space. Renewal talks commonly trigger rent step-downs or richer packages as tenants play landlords against each other to improve terms.

Hybrid work reduces space demand
Right-sizing footprints and hybrid work have pushed Manhattan office vacancy to roughly 18% in 2024 with about 25 million sq ft of sublease, weakening landlords pricing power. Tenants demand shorter terms and expansion/contraction clauses, reducing lease certainty. Demand concentrates in newer amenitized assets, pressuring older stock. SL Green must invest in upgrades and ESG/amenity programs to defend rents and occupancy.

Broker intermediation intensifies price transparency
Global brokerage firms (CBRE, JLL, Colliers) aggregate transaction data and negotiate at scale, driving comparables that sharpen tenant expectations on concessions and lease terms in 2024.
Off-market offers get rapidly benchmarked by advisors against aggregated comps, compressing spreads and accelerating decision cycles across SL Green assets.
- brokers aggregate billions in CRE transactions annually
- comparable transparency raises concession demands
- off-market deals face immediate internal benchmarking
- result: tighter spreads, faster decisions
Credit quality and counterparty risk
Tenant credit directly shapes lease economics and financing: strong-credit tenants like major financial and tech firms command longer, tenant-favorable structures, while weaker credits force SL Green to seek guarantees or larger deposits, tightening underwriting. With Manhattan office vacancy near 20% in 2024, portfolio curation is a balance between maximizing occupancy and limiting counterparty risk.
- Tenant credit → lease terms, financing
- Strong credits dictate structure
- Weak credits need guarantees/deposits
- 2024 NYC vacancy ≈ 20%
Anchor tenants extract concessions as Manhattan vacancy ≈18–20%
Large anchor tenants and brokers wield strong leverage in 2024, extracting longer concessions, higher TI and flexible terms as Manhattan vacancy (~18–20%) and ~25M sq ft of sublease boost tenant options; renewal negotiations frequently trade rent reductions for upgraded amenities, forcing SL Green to invest in asset upgrades and ESG features to defend rents.
| Metric | 2024 |
|---|---|
| Manhattan vacancy | ≈18–20% |
| Sublease supply | ≈25M sq ft |
| Tenant leverage | High (anchor-led) |
Same Document Delivered
SL Green Porter's Five Forces Analysis
This preview is the exact SL Green Porter’s Five Forces analysis you’ll receive—no mockups, no placeholders. The document shown is professionally written and fully formatted, ready for immediate download the moment you complete your purchase. What you see here is precisely what you’ll get.

A Must-Have Tool for Decision-Makers
SL Green’s Porter's Five Forces snapshot highlights concentrated tenant bargaining in NYC office markets, moderate supplier power, elevated rivalry from mixed-use landlords, low threat of substitutes for prime office space, and barriers that temper new entrants; this brief hints at strategic risks and upside. Unlock the full Porter's Five Forces Analysis for force-by-force ratings, visuals, and actionable recommendations.
Suppliers Bargaining Power
Concentrated contractors and unions
Concentrated construction firms, specialty trades and strong building-trades unions in NYC give suppliers price and timeline leverage, with union density in construction around 70% in 2024. Labor contracts and prevailing-wage rules raise fixed costs and constrain flexibility, squeezing redevelopment margins. Work stoppages or delays can materially push back leasing readiness. SL Green uses multi-vendor panels and long-term partners but remains exposed to citywide wage dynamics.
Utility and infrastructure dependence
Power, water, steam and telecom in Manhattan are supplied by dominant incumbents—Con Edison for electricity/steam and a small set of carriers (Verizon, Charter/Spectrum) for telecom—keeping switching costs high and baseline supplier power elevated. NYC Local Law 97 emissions limits (phases effective from 2024) and electrification/retrofit requirements can compress margins during upgrades and trigger higher utility capacity or redundancy spend to meet Class A tenant reliability. SL Green mitigates via bulk and portfolio agreements, but supplier leverage remains materially high.
Capital providers and lenders
Debt and equity capital are critical inputs for SL Green acquisitions and redevelopments, making lenders de facto suppliers; with the federal funds rate near 5.25% in mid-2024 and roughly $1.4 trillion of US CRE loans maturing in 2024–25, tighter credit pushed wider spreads and tougher covenants, strengthening lender bargaining power. Refinancing risk alters asset strategy and disposition timing, while relationship banking and diversified funding channels partially offset this leverage.
Technology and building systems vendors
Technology and building-systems vendors (elevators, HVAC, access control, smart-building platforms) are dominated by four OEMs—Otis, KONE, Schindler and Thyssenkrupp—which together hold roughly 70% market share, creating supplier leverage. Proprietary systems and 25–30 year replacement cycles produce lock-in and higher lifecycle costs, while integration demands for ESG reporting and tenant-experience apps further concentrate vendor choice. SL Green mitigates this by negotiating portfolio-wide service contracts to capture scale and price efficiencies.
- Major OEM concentration ~70%
- Modernization cycle 25–30 years
- Portfolio-wide contracts reduce unit service costs
Regulators and permitting authorities
Zoning boards, Landmarks, DOB and environmental agencies function as gatekeepers for SL Green redevelopment, with permitting timelines often adding 6–18 months and significant cost uncertainty. Local Law 97, set at $268/metric-ton CO2e in 2024, plus ESG mandates, drives incremental capex; proactive compliance planning and stakeholder engagement can smooth approvals but cannot eliminate regulatory risk.
- Gatekeepers: zoning, Landmarks, DOB, env agencies
- Timelines: 6–18 months adds cost/uncertainty
- LL97: $268/ton CO2e (2024) increases capex
- Mitigation: proactive planning ≠ risk elimination
High supplier concentration, unionized labor and utilities squeeze margins and raise capex risk
High supplier concentration (construction unions ~70% in 2024; OEMs ~70%) and utility incumbents (Con Edison, Verizon/Charter) raise costs and switching barriers. Labor contracts, LL97 ($268/ton CO2e, 2024) and higher rates (fed funds ~5.25% mid-2024) compress margins and raise capex/refi risk. SL Green uses portfolio contracts, multi-vendor panels and relationship lending to mitigate exposure.
| Supplier | Concentration | Key metric | Mitigation |
|---|---|---|---|
| Labor/unions | High | 70% density (2024) | Multi-vendor |
| Utilities | Local monopolies | LL97 $268/t | Bulk agreements |
| Capital | Fragmented but tight | $1.4T CRE maturing (24–25) | diverse funding |
What is included in the product
Detailed Word Document
Tailored Porter’s Five Forces analysis for SL Green that uncovers key drivers of competition, buyer and supplier power, entry barriers, substitutes, and disruptive threats; delivers detailed, strategic commentary on pricing influence and market positioning to inform investor, executive, and academic use.
Customizable Excel Spreadsheet
A concise, one-sheet Porter’s Five Forces for SL Green that highlights landlord-tenant, leasing, and development pressures—ready to drop into presentations and updated instantly as market data or scenarios evolve.
Customers Bargaining Power
Large anchor tenants negotiate hard
Large anchor tenants—financial, law, and tech firms—leverage scale to secure deep concessions on term length, tenant improvement allowances, free rent and flexibility clauses, often negotiating multiyear caps and bespoke exit options. Their commitments lower lease-up risk for SL Green but compress landlord economics through higher upfront TI and rent abatements; with Manhattan office vacancy still elevated in 2024 (~16%), competition for marquee names further increases tenant bargaining power.
High vacancy elevates tenant leverage
Manhattan office availability remained above 15% in 2024, giving tenants expanding options. Landlords increasingly compete on lower rents, larger TI allowances and upgraded amenities to fill space. Renewal talks commonly trigger rent step-downs or richer packages as tenants play landlords against each other to improve terms.
Hybrid work reduces space demand
Right-sizing footprints and hybrid work have pushed Manhattan office vacancy to roughly 18% in 2024 with about 25 million sq ft of sublease, weakening landlords pricing power. Tenants demand shorter terms and expansion/contraction clauses, reducing lease certainty. Demand concentrates in newer amenitized assets, pressuring older stock. SL Green must invest in upgrades and ESG/amenity programs to defend rents and occupancy.
Broker intermediation intensifies price transparency
Global brokerage firms (CBRE, JLL, Colliers) aggregate transaction data and negotiate at scale, driving comparables that sharpen tenant expectations on concessions and lease terms in 2024.
Off-market offers get rapidly benchmarked by advisors against aggregated comps, compressing spreads and accelerating decision cycles across SL Green assets.
- brokers aggregate billions in CRE transactions annually
- comparable transparency raises concession demands
- off-market deals face immediate internal benchmarking
- result: tighter spreads, faster decisions
Credit quality and counterparty risk
Tenant credit directly shapes lease economics and financing: strong-credit tenants like major financial and tech firms command longer, tenant-favorable structures, while weaker credits force SL Green to seek guarantees or larger deposits, tightening underwriting. With Manhattan office vacancy near 20% in 2024, portfolio curation is a balance between maximizing occupancy and limiting counterparty risk.
- Tenant credit → lease terms, financing
- Strong credits dictate structure
- Weak credits need guarantees/deposits
- 2024 NYC vacancy ≈ 20%
Anchor tenants extract concessions as Manhattan vacancy ≈18–20%
Large anchor tenants and brokers wield strong leverage in 2024, extracting longer concessions, higher TI and flexible terms as Manhattan vacancy (~18–20%) and ~25M sq ft of sublease boost tenant options; renewal negotiations frequently trade rent reductions for upgraded amenities, forcing SL Green to invest in asset upgrades and ESG features to defend rents.
| Metric | 2024 |
|---|---|
| Manhattan vacancy | ≈18–20% |
| Sublease supply | ≈25M sq ft |
| Tenant leverage | High (anchor-led) |
Same Document Delivered
SL Green Porter's Five Forces Analysis
This preview is the exact SL Green Porter’s Five Forces analysis you’ll receive—no mockups, no placeholders. The document shown is professionally written and fully formatted, ready for immediate download the moment you complete your purchase. What you see here is precisely what you’ll get.
Original: $10.00
-65%$10.00
$3.50Description
A Must-Have Tool for Decision-Makers
SL Green’s Porter's Five Forces snapshot highlights concentrated tenant bargaining in NYC office markets, moderate supplier power, elevated rivalry from mixed-use landlords, low threat of substitutes for prime office space, and barriers that temper new entrants; this brief hints at strategic risks and upside. Unlock the full Porter's Five Forces Analysis for force-by-force ratings, visuals, and actionable recommendations.
Suppliers Bargaining Power
Concentrated contractors and unions
Concentrated construction firms, specialty trades and strong building-trades unions in NYC give suppliers price and timeline leverage, with union density in construction around 70% in 2024. Labor contracts and prevailing-wage rules raise fixed costs and constrain flexibility, squeezing redevelopment margins. Work stoppages or delays can materially push back leasing readiness. SL Green uses multi-vendor panels and long-term partners but remains exposed to citywide wage dynamics.
Utility and infrastructure dependence
Power, water, steam and telecom in Manhattan are supplied by dominant incumbents—Con Edison for electricity/steam and a small set of carriers (Verizon, Charter/Spectrum) for telecom—keeping switching costs high and baseline supplier power elevated. NYC Local Law 97 emissions limits (phases effective from 2024) and electrification/retrofit requirements can compress margins during upgrades and trigger higher utility capacity or redundancy spend to meet Class A tenant reliability. SL Green mitigates via bulk and portfolio agreements, but supplier leverage remains materially high.
Capital providers and lenders
Debt and equity capital are critical inputs for SL Green acquisitions and redevelopments, making lenders de facto suppliers; with the federal funds rate near 5.25% in mid-2024 and roughly $1.4 trillion of US CRE loans maturing in 2024–25, tighter credit pushed wider spreads and tougher covenants, strengthening lender bargaining power. Refinancing risk alters asset strategy and disposition timing, while relationship banking and diversified funding channels partially offset this leverage.
Technology and building systems vendors
Technology and building-systems vendors (elevators, HVAC, access control, smart-building platforms) are dominated by four OEMs—Otis, KONE, Schindler and Thyssenkrupp—which together hold roughly 70% market share, creating supplier leverage. Proprietary systems and 25–30 year replacement cycles produce lock-in and higher lifecycle costs, while integration demands for ESG reporting and tenant-experience apps further concentrate vendor choice. SL Green mitigates this by negotiating portfolio-wide service contracts to capture scale and price efficiencies.
- Major OEM concentration ~70%
- Modernization cycle 25–30 years
- Portfolio-wide contracts reduce unit service costs
Regulators and permitting authorities
Zoning boards, Landmarks, DOB and environmental agencies function as gatekeepers for SL Green redevelopment, with permitting timelines often adding 6–18 months and significant cost uncertainty. Local Law 97, set at $268/metric-ton CO2e in 2024, plus ESG mandates, drives incremental capex; proactive compliance planning and stakeholder engagement can smooth approvals but cannot eliminate regulatory risk.
- Gatekeepers: zoning, Landmarks, DOB, env agencies
- Timelines: 6–18 months adds cost/uncertainty
- LL97: $268/ton CO2e (2024) increases capex
- Mitigation: proactive planning ≠ risk elimination
High supplier concentration, unionized labor and utilities squeeze margins and raise capex risk
High supplier concentration (construction unions ~70% in 2024; OEMs ~70%) and utility incumbents (Con Edison, Verizon/Charter) raise costs and switching barriers. Labor contracts, LL97 ($268/ton CO2e, 2024) and higher rates (fed funds ~5.25% mid-2024) compress margins and raise capex/refi risk. SL Green uses portfolio contracts, multi-vendor panels and relationship lending to mitigate exposure.
| Supplier | Concentration | Key metric | Mitigation |
|---|---|---|---|
| Labor/unions | High | 70% density (2024) | Multi-vendor |
| Utilities | Local monopolies | LL97 $268/t | Bulk agreements |
| Capital | Fragmented but tight | $1.4T CRE maturing (24–25) | diverse funding |
What is included in the product
Detailed Word Document
Tailored Porter’s Five Forces analysis for SL Green that uncovers key drivers of competition, buyer and supplier power, entry barriers, substitutes, and disruptive threats; delivers detailed, strategic commentary on pricing influence and market positioning to inform investor, executive, and academic use.
Customizable Excel Spreadsheet
A concise, one-sheet Porter’s Five Forces for SL Green that highlights landlord-tenant, leasing, and development pressures—ready to drop into presentations and updated instantly as market data or scenarios evolve.
Customers Bargaining Power
Large anchor tenants negotiate hard
Large anchor tenants—financial, law, and tech firms—leverage scale to secure deep concessions on term length, tenant improvement allowances, free rent and flexibility clauses, often negotiating multiyear caps and bespoke exit options. Their commitments lower lease-up risk for SL Green but compress landlord economics through higher upfront TI and rent abatements; with Manhattan office vacancy still elevated in 2024 (~16%), competition for marquee names further increases tenant bargaining power.
High vacancy elevates tenant leverage
Manhattan office availability remained above 15% in 2024, giving tenants expanding options. Landlords increasingly compete on lower rents, larger TI allowances and upgraded amenities to fill space. Renewal talks commonly trigger rent step-downs or richer packages as tenants play landlords against each other to improve terms.
Hybrid work reduces space demand
Right-sizing footprints and hybrid work have pushed Manhattan office vacancy to roughly 18% in 2024 with about 25 million sq ft of sublease, weakening landlords pricing power. Tenants demand shorter terms and expansion/contraction clauses, reducing lease certainty. Demand concentrates in newer amenitized assets, pressuring older stock. SL Green must invest in upgrades and ESG/amenity programs to defend rents and occupancy.
Broker intermediation intensifies price transparency
Global brokerage firms (CBRE, JLL, Colliers) aggregate transaction data and negotiate at scale, driving comparables that sharpen tenant expectations on concessions and lease terms in 2024.
Off-market offers get rapidly benchmarked by advisors against aggregated comps, compressing spreads and accelerating decision cycles across SL Green assets.
- brokers aggregate billions in CRE transactions annually
- comparable transparency raises concession demands
- off-market deals face immediate internal benchmarking
- result: tighter spreads, faster decisions
Credit quality and counterparty risk
Tenant credit directly shapes lease economics and financing: strong-credit tenants like major financial and tech firms command longer, tenant-favorable structures, while weaker credits force SL Green to seek guarantees or larger deposits, tightening underwriting. With Manhattan office vacancy near 20% in 2024, portfolio curation is a balance between maximizing occupancy and limiting counterparty risk.
- Tenant credit → lease terms, financing
- Strong credits dictate structure
- Weak credits need guarantees/deposits
- 2024 NYC vacancy ≈ 20%
Anchor tenants extract concessions as Manhattan vacancy ≈18–20%
Large anchor tenants and brokers wield strong leverage in 2024, extracting longer concessions, higher TI and flexible terms as Manhattan vacancy (~18–20%) and ~25M sq ft of sublease boost tenant options; renewal negotiations frequently trade rent reductions for upgraded amenities, forcing SL Green to invest in asset upgrades and ESG features to defend rents.
| Metric | 2024 |
|---|---|
| Manhattan vacancy | ≈18–20% |
| Sublease supply | ≈25M sq ft |
| Tenant leverage | High (anchor-led) |
Same Document Delivered
SL Green Porter's Five Forces Analysis
This preview is the exact SL Green Porter’s Five Forces analysis you’ll receive—no mockups, no placeholders. The document shown is professionally written and fully formatted, ready for immediate download the moment you complete your purchase. What you see here is precisely what you’ll get.











