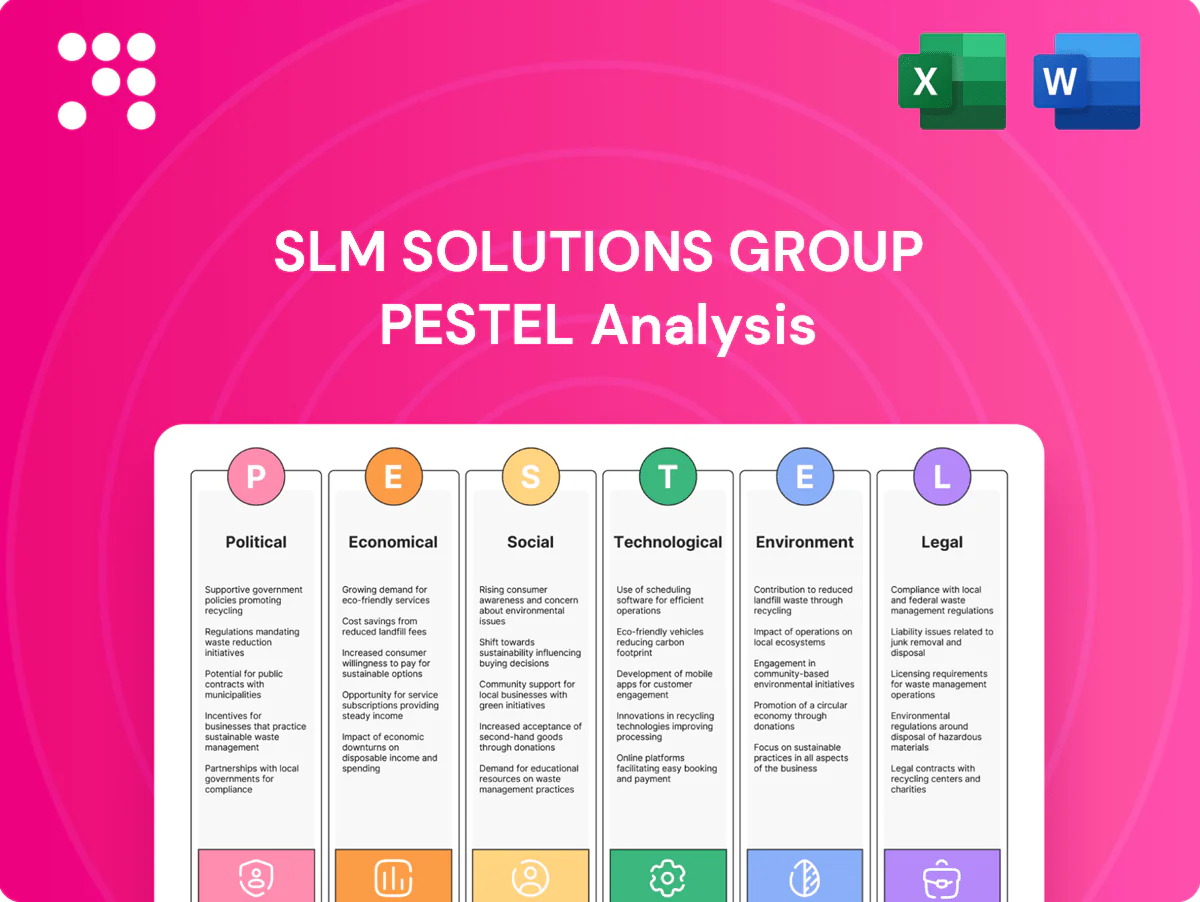
SLM Solutions Group PESTLE Analysis

Make Smarter Strategic Decisions with a Complete PESTEL View
Unlock strategic clarity with our PESTLE Analysis of SLM Solutions Group—three expert-level insights into how political shifts, economic cycles, and tech disruption will shape growth and risk; ideal for investors and strategists. This concise briefing highlights immediate threats and opportunities you can act on. Purchase the full report to access the complete, ready-to-use analysis and data tables now.
Political factors

Industrial policy & subsidies
Governments support advanced manufacturing with grants and tax credits, directly boosting SLM’s sales pipeline and shaping localization decisions; US CHIPS Act ($52bn) and similar EU measures increase demand for metal AM in strategic supply chains. EU and US reshoring pushes prioritize aerospace and defense, accelerating qualified part adoption. Accessing incentives improves customer ROI and often shortens purchase decisions. Policy shifts could redirect funds away from AM, slowing project pipelines.
Export controls & defense ties
Metal AM for aerospace/defense triggers US ITAR and EAR and EU Dual-Use Regulation (EU) 2021/821, constraining SLM Solutions (headquartered in Lübeck) shipments, software updates and remote support. Licensing delays commonly stretch sales cycles by weeks to months and hamper service responsiveness. Robust compliance strengthens trust with defense primes but raises administrative overhead. Geopolitical tensions can abruptly close key markets.

Trade tariffs & supply chains
Tariffs on metals, optics and electronics directly raise SLM Solutions Group’s bill of materials and pricing—e.g., US Section 232 steel tariffs remain at 25%, increasing input cost pressure for metal‑based AM systems. Cross‑border shipping of metal powders and spare parts faces customs complexity and IATA/IMDG hazardous‑goods rules that add delay and cost. Localization of assembly or service centers reduces tariff exposure and lead times. Trade disputes can abruptly disrupt procurement of critical components and spares.

Public procurement dynamics
National labs and universities buy AM systems through competitive tenders that set strict feature and price thresholds; Horizon Europe’s €95.5bn R&D frame (2021–27) and large national programs shape specs and demand. Long public budget cycles (often 6–18 months) and fiscal constraints time procurements; demonstrated domestic value add and local supply chains are key differentiators. Shifts in research funding toward green tech redirect demand to specific materials and applications.
- Procurement: competitive tenders drive specs
- Timing: 6–18 month cycles; fiscal constraints
- Edge: domestic value add, local supply
- Funding shifts: steer materials/applications
Sanctions & market access
Sanctions regimes (EU, US, UK) since 2022 restrict dual‑use machine exports and can block sales to listed regions or entities; SLM must screen customers and end‑uses to avoid heavy fines. Rapid list changes through 2024–2025 require agile compliance and legal review; lost markets must be offset by deeper penetration in permitted geographies.
- Screening: mandatory against EU/US/UK lists
- Agility: frequent list updates in 2024–2025
- Mitigation: shift focus to approved markets
US $52bn CHIPS, EU €95.5bn speed AM; US 25% steel tariffs and sanctions lengthen sales
Government incentives (US CHIPS $52bn; EU Horizon €95.5bn) boost demand and shorten buying cycles for metal AM, while reshoring prioritizes aerospace/defense. Export controls (ITAR/EAR, EU Dual‑Use Reg 2021/821) and 2024–2025 sanctions force strict screening, lengthening sales cycles. Tariffs (US steel 25%) and hazardous‑goods rules raise BOM and logistics costs, driving localization.
| Issue | Key data |
|---|---|
| Incentives | US CHIPS $52bn; Horizon €95.5bn |
| Tariffs | US steel 25% |
| Compliance | ITAR/EAR; Dual‑Use 2021/821; 2024–25 sanctions |
| Procurement | Public cycles 6–18 months |
What is included in the product
 Detailed Word Document
Provides a concise PESTLE analysis of SLM Solutions Group, examining Political, Economic, Social, Technological, Environmental and Legal drivers with data‑backed trends and sector-specific examples to identify risks and opportunities; tailored for executives and investors with forward‑looking insights for strategy and funding readiness.

 Customizable Excel Spreadsheet
A concise, visually segmented PESTLE summary of SLM Solutions Group that can be dropped into presentations, edited with region- or business-specific notes, and easily shared across teams to streamline external risk discussions and strategic planning.
Economic factors

Capital spending cycles
SLM metal AM systems are high‑ticket CapEx tied to aerospace, automotive and medical cycles, where the global metal AM equipment market reached about $5.2bn in 2024 and OEM orders cluster with sectoral investment waves. Macroeconomic slowdowns commonly delay orders and stretch payback periods beyond three years, reducing near‑term revenue visibility. Leasing and subscription offerings, now capturing roughly 15–20% of new deployments in 2024, can smooth demand. Backlogs and preorders improve visibility but remain sensitive to tightening credit and customer capex freezes.
Powder & parts economics
Material costs and powder reuse are key drivers of cost per part: typical reuse rates run 60–80%, and improving yield to >85% can cut material cost per part roughly 20–40%.
SLM’s multi‑laser machines and process efficiency boost throughput—quad‑laser systems have been shown to double to triple effective build rates versus single‑laser setups—lowering unit labor and overhead per part.
Qualifying more alloys, notably Ti and Ni superalloys, opens higher‑margin aerospace and medical segments, while volatility in nickel, titanium and aluminum markets (notable price swings 2022–24) continues to affect adoption timing and customer TCO calculations.

Energy prices & OPEX
LPBF is energy‑intensive—commercial machines draw roughly 10–50 kW, so industrial electricity prices (2024 EU industrial avg ~€0.14–0.22/kWh; US industrial avg ~$0.07–0.10/kWh) are a key OPEX driver for SLM Solutions customers. Energy price spikes in 2022–24 slowed capital shifts to serial metal AM by raising unit costs and payback periods. Efficiency features and optimized scan strategies cut print time and kWh per part, improving throughput. On‑site solar or night/off‑peak scheduling (shifting to lower tariffs) can lower energy spend and materially strengthen ROI cases.

Currency fluctuations
With euro‑based costs and global sales, EUR/USD swung roughly 1.05–1.13 and EUR/JPY about 150–165 during 2024–H1 2025, directly affecting revenue translation and price competitiveness for SLM Solutions. Hedging (typical premiums 0.5–2% p.a.) reduces P&L volatility but increases costs. Pricing in customer currencies can boost conversion; supply contracts should include FX pass‑through or collars for stability.
- FX exposure: EUR/USD 1.05–1.13, EUR/JPY 150–165
- Hedging cost: ~0.5–2% p.a.
- Customer pricing: local currency eases purchases
- Contracts: include pass‑through, collars, or netting
Aftermarket & service revenues
Aftermarket revenues from installation, training, maintenance, and consumables provide recurring income and margin stability for SLM Solutions, with expanding installed base boosting annuity streams and supporting revenue predictability; uptime guarantees and remote diagnostics enable premium pricing, while downturns often shift customers toward service over new-system purchases.
- Installation & training: recurring margins
- Maintenance & consumables: stable annuity streams
- Uptime SLAs/remote diagnostics: premium pricing
- Downturns: higher service share vs new systems
US $52bn CHIPS, EU €95.5bn speed AM; US 25% steel tariffs and sanctions lengthen sales
SLM metal AM sales tied to cyclic aerospace/auto/medical markets; global metal AM equipment ~$5.2bn in 2024 and OEM orders cluster with investment waves.
Leasing/subscriptions ~15–20% of deployments in 2024 smooth demand; backlogs sensitive to credit and capex freezes.
Material reuse 60–80% (target >85% saves 20–40% material cost); quad‑laser systems 2–3x build rate.
| Metric | Value |
|---|---|
| Market 2024 | $5.2bn |
| Leasing | 15–20% |
| Reuse | 60–80% |
| Energy draw | 10–50 kW |
What You See Is What You Get
SLM Solutions Group PESTLE Analysis
The SLM Solutions Group PESTLE Analysis preview shown here is the exact document you’ll receive after purchase—fully formatted, professionally structured, and ready to use. The layout, content, and structure visible are identical to the final file you’ll download immediately after payment. No placeholders, no teasers—this is the real product you’ll own upon checkout.

Make Smarter Strategic Decisions with a Complete PESTEL View
Unlock strategic clarity with our PESTLE Analysis of SLM Solutions Group—three expert-level insights into how political shifts, economic cycles, and tech disruption will shape growth and risk; ideal for investors and strategists. This concise briefing highlights immediate threats and opportunities you can act on. Purchase the full report to access the complete, ready-to-use analysis and data tables now.
Political factors
Industrial policy & subsidies
Governments support advanced manufacturing with grants and tax credits, directly boosting SLM’s sales pipeline and shaping localization decisions; US CHIPS Act ($52bn) and similar EU measures increase demand for metal AM in strategic supply chains. EU and US reshoring pushes prioritize aerospace and defense, accelerating qualified part adoption. Accessing incentives improves customer ROI and often shortens purchase decisions. Policy shifts could redirect funds away from AM, slowing project pipelines.
Export controls & defense ties
Metal AM for aerospace/defense triggers US ITAR and EAR and EU Dual-Use Regulation (EU) 2021/821, constraining SLM Solutions (headquartered in Lübeck) shipments, software updates and remote support. Licensing delays commonly stretch sales cycles by weeks to months and hamper service responsiveness. Robust compliance strengthens trust with defense primes but raises administrative overhead. Geopolitical tensions can abruptly close key markets.
Trade tariffs & supply chains
Tariffs on metals, optics and electronics directly raise SLM Solutions Group’s bill of materials and pricing—e.g., US Section 232 steel tariffs remain at 25%, increasing input cost pressure for metal‑based AM systems. Cross‑border shipping of metal powders and spare parts faces customs complexity and IATA/IMDG hazardous‑goods rules that add delay and cost. Localization of assembly or service centers reduces tariff exposure and lead times. Trade disputes can abruptly disrupt procurement of critical components and spares.
Public procurement dynamics
National labs and universities buy AM systems through competitive tenders that set strict feature and price thresholds; Horizon Europe’s €95.5bn R&D frame (2021–27) and large national programs shape specs and demand. Long public budget cycles (often 6–18 months) and fiscal constraints time procurements; demonstrated domestic value add and local supply chains are key differentiators. Shifts in research funding toward green tech redirect demand to specific materials and applications.
- Procurement: competitive tenders drive specs
- Timing: 6–18 month cycles; fiscal constraints
- Edge: domestic value add, local supply
- Funding shifts: steer materials/applications
Sanctions & market access
Sanctions regimes (EU, US, UK) since 2022 restrict dual‑use machine exports and can block sales to listed regions or entities; SLM must screen customers and end‑uses to avoid heavy fines. Rapid list changes through 2024–2025 require agile compliance and legal review; lost markets must be offset by deeper penetration in permitted geographies.
- Screening: mandatory against EU/US/UK lists
- Agility: frequent list updates in 2024–2025
- Mitigation: shift focus to approved markets
US $52bn CHIPS, EU €95.5bn speed AM; US 25% steel tariffs and sanctions lengthen sales
Government incentives (US CHIPS $52bn; EU Horizon €95.5bn) boost demand and shorten buying cycles for metal AM, while reshoring prioritizes aerospace/defense. Export controls (ITAR/EAR, EU Dual‑Use Reg 2021/821) and 2024–2025 sanctions force strict screening, lengthening sales cycles. Tariffs (US steel 25%) and hazardous‑goods rules raise BOM and logistics costs, driving localization.
| Issue | Key data |
|---|---|
| Incentives | US CHIPS $52bn; Horizon €95.5bn |
| Tariffs | US steel 25% |
| Compliance | ITAR/EAR; Dual‑Use 2021/821; 2024–25 sanctions |
| Procurement | Public cycles 6–18 months |
What is included in the product
Detailed Word Document
Provides a concise PESTLE analysis of SLM Solutions Group, examining Political, Economic, Social, Technological, Environmental and Legal drivers with data‑backed trends and sector-specific examples to identify risks and opportunities; tailored for executives and investors with forward‑looking insights for strategy and funding readiness.
Customizable Excel Spreadsheet
A concise, visually segmented PESTLE summary of SLM Solutions Group that can be dropped into presentations, edited with region- or business-specific notes, and easily shared across teams to streamline external risk discussions and strategic planning.
Economic factors
Capital spending cycles
SLM metal AM systems are high‑ticket CapEx tied to aerospace, automotive and medical cycles, where the global metal AM equipment market reached about $5.2bn in 2024 and OEM orders cluster with sectoral investment waves. Macroeconomic slowdowns commonly delay orders and stretch payback periods beyond three years, reducing near‑term revenue visibility. Leasing and subscription offerings, now capturing roughly 15–20% of new deployments in 2024, can smooth demand. Backlogs and preorders improve visibility but remain sensitive to tightening credit and customer capex freezes.
Powder & parts economics
Material costs and powder reuse are key drivers of cost per part: typical reuse rates run 60–80%, and improving yield to >85% can cut material cost per part roughly 20–40%.
SLM’s multi‑laser machines and process efficiency boost throughput—quad‑laser systems have been shown to double to triple effective build rates versus single‑laser setups—lowering unit labor and overhead per part.
Qualifying more alloys, notably Ti and Ni superalloys, opens higher‑margin aerospace and medical segments, while volatility in nickel, titanium and aluminum markets (notable price swings 2022–24) continues to affect adoption timing and customer TCO calculations.
Energy prices & OPEX
LPBF is energy‑intensive—commercial machines draw roughly 10–50 kW, so industrial electricity prices (2024 EU industrial avg ~€0.14–0.22/kWh; US industrial avg ~$0.07–0.10/kWh) are a key OPEX driver for SLM Solutions customers. Energy price spikes in 2022–24 slowed capital shifts to serial metal AM by raising unit costs and payback periods. Efficiency features and optimized scan strategies cut print time and kWh per part, improving throughput. On‑site solar or night/off‑peak scheduling (shifting to lower tariffs) can lower energy spend and materially strengthen ROI cases.
Currency fluctuations
With euro‑based costs and global sales, EUR/USD swung roughly 1.05–1.13 and EUR/JPY about 150–165 during 2024–H1 2025, directly affecting revenue translation and price competitiveness for SLM Solutions. Hedging (typical premiums 0.5–2% p.a.) reduces P&L volatility but increases costs. Pricing in customer currencies can boost conversion; supply contracts should include FX pass‑through or collars for stability.
- FX exposure: EUR/USD 1.05–1.13, EUR/JPY 150–165
- Hedging cost: ~0.5–2% p.a.
- Customer pricing: local currency eases purchases
- Contracts: include pass‑through, collars, or netting
Aftermarket & service revenues
Aftermarket revenues from installation, training, maintenance, and consumables provide recurring income and margin stability for SLM Solutions, with expanding installed base boosting annuity streams and supporting revenue predictability; uptime guarantees and remote diagnostics enable premium pricing, while downturns often shift customers toward service over new-system purchases.
- Installation & training: recurring margins
- Maintenance & consumables: stable annuity streams
- Uptime SLAs/remote diagnostics: premium pricing
- Downturns: higher service share vs new systems
US $52bn CHIPS, EU €95.5bn speed AM; US 25% steel tariffs and sanctions lengthen sales
SLM metal AM sales tied to cyclic aerospace/auto/medical markets; global metal AM equipment ~$5.2bn in 2024 and OEM orders cluster with investment waves.
Leasing/subscriptions ~15–20% of deployments in 2024 smooth demand; backlogs sensitive to credit and capex freezes.
Material reuse 60–80% (target >85% saves 20–40% material cost); quad‑laser systems 2–3x build rate.
| Metric | Value |
|---|---|
| Market 2024 | $5.2bn |
| Leasing | 15–20% |
| Reuse | 60–80% |
| Energy draw | 10–50 kW |
What You See Is What You Get
SLM Solutions Group PESTLE Analysis
The SLM Solutions Group PESTLE Analysis preview shown here is the exact document you’ll receive after purchase—fully formatted, professionally structured, and ready to use. The layout, content, and structure visible are identical to the final file you’ll download immediately after payment. No placeholders, no teasers—this is the real product you’ll own upon checkout.
Original: $10.00
-65%$10.00
$3.50Description
Make Smarter Strategic Decisions with a Complete PESTEL View
Unlock strategic clarity with our PESTLE Analysis of SLM Solutions Group—three expert-level insights into how political shifts, economic cycles, and tech disruption will shape growth and risk; ideal for investors and strategists. This concise briefing highlights immediate threats and opportunities you can act on. Purchase the full report to access the complete, ready-to-use analysis and data tables now.
Political factors
Industrial policy & subsidies
Governments support advanced manufacturing with grants and tax credits, directly boosting SLM’s sales pipeline and shaping localization decisions; US CHIPS Act ($52bn) and similar EU measures increase demand for metal AM in strategic supply chains. EU and US reshoring pushes prioritize aerospace and defense, accelerating qualified part adoption. Accessing incentives improves customer ROI and often shortens purchase decisions. Policy shifts could redirect funds away from AM, slowing project pipelines.
Export controls & defense ties
Metal AM for aerospace/defense triggers US ITAR and EAR and EU Dual-Use Regulation (EU) 2021/821, constraining SLM Solutions (headquartered in Lübeck) shipments, software updates and remote support. Licensing delays commonly stretch sales cycles by weeks to months and hamper service responsiveness. Robust compliance strengthens trust with defense primes but raises administrative overhead. Geopolitical tensions can abruptly close key markets.
Trade tariffs & supply chains
Tariffs on metals, optics and electronics directly raise SLM Solutions Group’s bill of materials and pricing—e.g., US Section 232 steel tariffs remain at 25%, increasing input cost pressure for metal‑based AM systems. Cross‑border shipping of metal powders and spare parts faces customs complexity and IATA/IMDG hazardous‑goods rules that add delay and cost. Localization of assembly or service centers reduces tariff exposure and lead times. Trade disputes can abruptly disrupt procurement of critical components and spares.
Public procurement dynamics
National labs and universities buy AM systems through competitive tenders that set strict feature and price thresholds; Horizon Europe’s €95.5bn R&D frame (2021–27) and large national programs shape specs and demand. Long public budget cycles (often 6–18 months) and fiscal constraints time procurements; demonstrated domestic value add and local supply chains are key differentiators. Shifts in research funding toward green tech redirect demand to specific materials and applications.
- Procurement: competitive tenders drive specs
- Timing: 6–18 month cycles; fiscal constraints
- Edge: domestic value add, local supply
- Funding shifts: steer materials/applications
Sanctions & market access
Sanctions regimes (EU, US, UK) since 2022 restrict dual‑use machine exports and can block sales to listed regions or entities; SLM must screen customers and end‑uses to avoid heavy fines. Rapid list changes through 2024–2025 require agile compliance and legal review; lost markets must be offset by deeper penetration in permitted geographies.
- Screening: mandatory against EU/US/UK lists
- Agility: frequent list updates in 2024–2025
- Mitigation: shift focus to approved markets
US $52bn CHIPS, EU €95.5bn speed AM; US 25% steel tariffs and sanctions lengthen sales
Government incentives (US CHIPS $52bn; EU Horizon €95.5bn) boost demand and shorten buying cycles for metal AM, while reshoring prioritizes aerospace/defense. Export controls (ITAR/EAR, EU Dual‑Use Reg 2021/821) and 2024–2025 sanctions force strict screening, lengthening sales cycles. Tariffs (US steel 25%) and hazardous‑goods rules raise BOM and logistics costs, driving localization.
| Issue | Key data |
|---|---|
| Incentives | US CHIPS $52bn; Horizon €95.5bn |
| Tariffs | US steel 25% |
| Compliance | ITAR/EAR; Dual‑Use 2021/821; 2024–25 sanctions |
| Procurement | Public cycles 6–18 months |
What is included in the product
Detailed Word Document
Provides a concise PESTLE analysis of SLM Solutions Group, examining Political, Economic, Social, Technological, Environmental and Legal drivers with data‑backed trends and sector-specific examples to identify risks and opportunities; tailored for executives and investors with forward‑looking insights for strategy and funding readiness.
Customizable Excel Spreadsheet
A concise, visually segmented PESTLE summary of SLM Solutions Group that can be dropped into presentations, edited with region- or business-specific notes, and easily shared across teams to streamline external risk discussions and strategic planning.
Economic factors
Capital spending cycles
SLM metal AM systems are high‑ticket CapEx tied to aerospace, automotive and medical cycles, where the global metal AM equipment market reached about $5.2bn in 2024 and OEM orders cluster with sectoral investment waves. Macroeconomic slowdowns commonly delay orders and stretch payback periods beyond three years, reducing near‑term revenue visibility. Leasing and subscription offerings, now capturing roughly 15–20% of new deployments in 2024, can smooth demand. Backlogs and preorders improve visibility but remain sensitive to tightening credit and customer capex freezes.
Powder & parts economics
Material costs and powder reuse are key drivers of cost per part: typical reuse rates run 60–80%, and improving yield to >85% can cut material cost per part roughly 20–40%.
SLM’s multi‑laser machines and process efficiency boost throughput—quad‑laser systems have been shown to double to triple effective build rates versus single‑laser setups—lowering unit labor and overhead per part.
Qualifying more alloys, notably Ti and Ni superalloys, opens higher‑margin aerospace and medical segments, while volatility in nickel, titanium and aluminum markets (notable price swings 2022–24) continues to affect adoption timing and customer TCO calculations.
Energy prices & OPEX
LPBF is energy‑intensive—commercial machines draw roughly 10–50 kW, so industrial electricity prices (2024 EU industrial avg ~€0.14–0.22/kWh; US industrial avg ~$0.07–0.10/kWh) are a key OPEX driver for SLM Solutions customers. Energy price spikes in 2022–24 slowed capital shifts to serial metal AM by raising unit costs and payback periods. Efficiency features and optimized scan strategies cut print time and kWh per part, improving throughput. On‑site solar or night/off‑peak scheduling (shifting to lower tariffs) can lower energy spend and materially strengthen ROI cases.
Currency fluctuations
With euro‑based costs and global sales, EUR/USD swung roughly 1.05–1.13 and EUR/JPY about 150–165 during 2024–H1 2025, directly affecting revenue translation and price competitiveness for SLM Solutions. Hedging (typical premiums 0.5–2% p.a.) reduces P&L volatility but increases costs. Pricing in customer currencies can boost conversion; supply contracts should include FX pass‑through or collars for stability.
- FX exposure: EUR/USD 1.05–1.13, EUR/JPY 150–165
- Hedging cost: ~0.5–2% p.a.
- Customer pricing: local currency eases purchases
- Contracts: include pass‑through, collars, or netting
Aftermarket & service revenues
Aftermarket revenues from installation, training, maintenance, and consumables provide recurring income and margin stability for SLM Solutions, with expanding installed base boosting annuity streams and supporting revenue predictability; uptime guarantees and remote diagnostics enable premium pricing, while downturns often shift customers toward service over new-system purchases.
- Installation & training: recurring margins
- Maintenance & consumables: stable annuity streams
- Uptime SLAs/remote diagnostics: premium pricing
- Downturns: higher service share vs new systems
US $52bn CHIPS, EU €95.5bn speed AM; US 25% steel tariffs and sanctions lengthen sales
SLM metal AM sales tied to cyclic aerospace/auto/medical markets; global metal AM equipment ~$5.2bn in 2024 and OEM orders cluster with investment waves.
Leasing/subscriptions ~15–20% of deployments in 2024 smooth demand; backlogs sensitive to credit and capex freezes.
Material reuse 60–80% (target >85% saves 20–40% material cost); quad‑laser systems 2–3x build rate.
| Metric | Value |
|---|---|
| Market 2024 | $5.2bn |
| Leasing | 15–20% |
| Reuse | 60–80% |
| Energy draw | 10–50 kW |
What You See Is What You Get
SLM Solutions Group PESTLE Analysis
The SLM Solutions Group PESTLE Analysis preview shown here is the exact document you’ll receive after purchase—fully formatted, professionally structured, and ready to use. The layout, content, and structure visible are identical to the final file you’ll download immediately after payment. No placeholders, no teasers—this is the real product you’ll own upon checkout.











