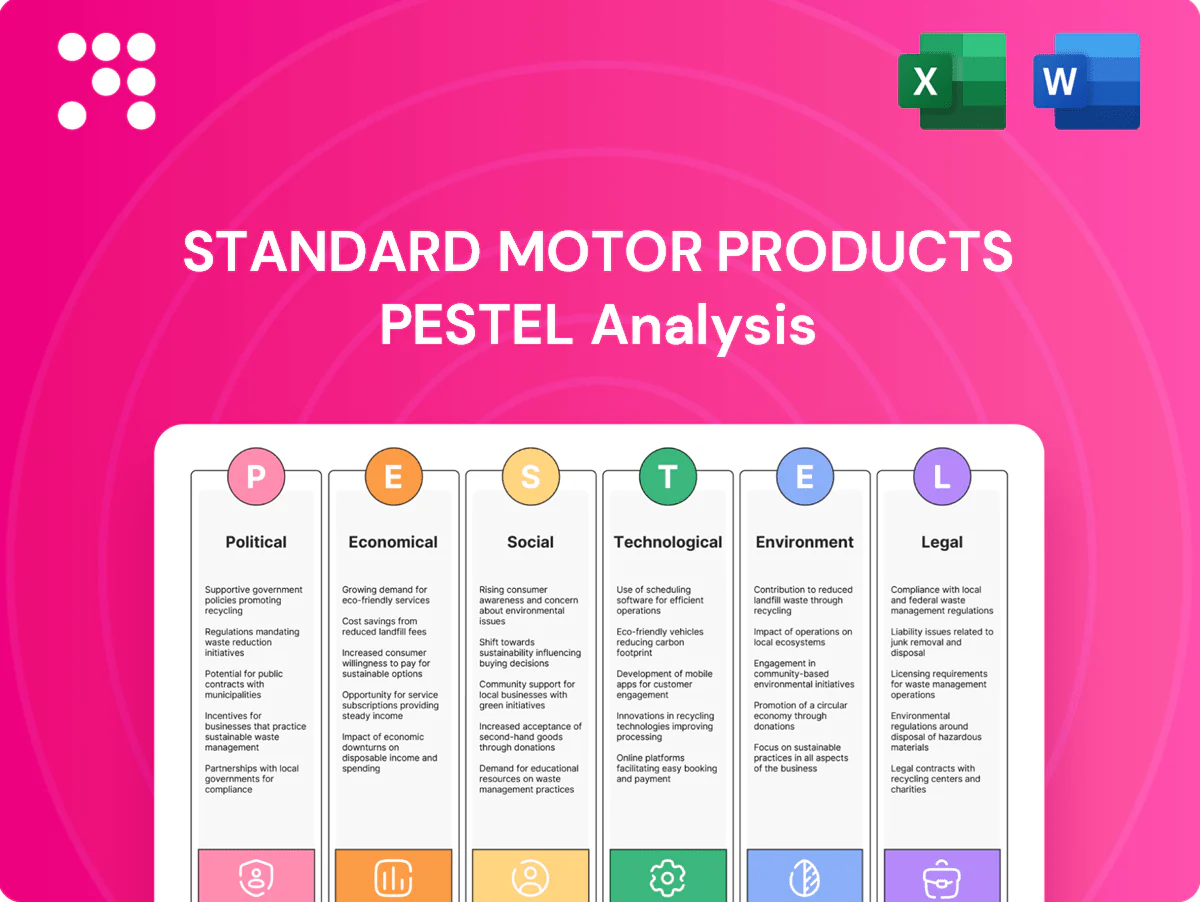
Standard Motor Products PESTLE Analysis

Your Shortcut to Market Insight Starts Here
Explore how political regulation, economic cycles, supply-chain shifts, technological innovation and environmental rules affect Standard Motor Products' outlook. Our PESTLE pinpoints risks and opportunities for investors and strategists. Buy the full analysis to get actionable, downloadable insights now.
Political factors

Trade policy and tariffs
US tariffs from the 2018 Section 301 actions remain on roughly $550bn of Chinese goods with rates up to 25%, and Section 232 steel/aluminum duties (25%/10%) persist, raising costs for metals, electronics and subassemblies for Standard Motor Products. SMP may need to re‑source or raise prices to offset duties; USMCA (effective July 1, 2020) and its 75% auto content rule steer North American sourcing and logistics. Geopolitical tensions lengthen lead times and increase inventory buffers.
EV transition incentives
US and EU subsidies, including the US federal EV tax credit up to 7,500 USD and the NEVI charging program with about 5 billion USD, accelerate EV adoption and shift fleet mix toward electrified vehicles. Demand moves away from traditional engine parts toward high-voltage hardware, advanced thermal management and sensors, pressuring SMP to reallocate R&D and capex. Public funding for charging and grid upgrades further cements this policy-driven curve, affecting product roadmaps and revenue mix.

Infrastructure and industrial policy
Infrastructure Investment and Jobs Act (2021) authorized roughly $1.2 trillion, improving freight corridors and helping reduce logistics bottlenecks for parts distribution.
Buy American provisions in IIJA and tightened federal procurement rules favor domestic sourcing, potentially benefiting Standard Motor Products' US manufacturing footprint.
Federal grants and credits, including the CHIPS Act's $52 billion and IRA incentives, support automation and capacity upgrades; policy stability remains critical for long-term capex decisions.

Regional regulatory divergence
Regional regulatory divergence—US AIM Act (HFC phasedown 85% by 2036) vs EU F-gas (79% cut vs 2015 by 2030) and differing emerging-market timelines complicates homologation; SMP must tailor emissions and refrigerant components to local rules, respond to political shifts that can change compliance quickly, and manage SKU proliferation as a strategic imperative.
- AIM Act: 85% HFC phasedown by 2036
- EU F-gas: 79% reduction vs 2015 by 2030
- Rapid political shifts raise compliance risk and SKU complexity
Public procurement and fleet policies
Government fleet electrification (EO 14057: ZEVs by 2035) and a federal fleet of ~645,000 vehicles shift aftermarket demand away from some ICE parts while increasing temperature-control and power-electronics service needs; predictable fleet maintenance cycles sustain volume for HVAC and engine-management SKUs; public procurement sets price/quality benchmarks and mass-transit policy changes can reduce VMT and parts wear.
Tariffs and EV incentives reshape North American supply chains
US tariffs on roughly $550bn of Chinese goods and Section 232 duties (25%/10%) raise input costs; USMCA and Buy American steer North American sourcing. Federal policies (EV tax credit up to 7,500 USD, NEVI ~5bn USD, IIJA 1.2tn USD, CHIPS 52bn USD, IRA incentives) accelerate electrification and capex shifts. AIM Act (85% by 2036) and EU F‑gas (79% by 2030) force regional product variants; EO 14057 targets federal ZEVs by 2035.
| Policy | Key figure |
|---|---|
| Tariffs | $550bn |
| NEVI | $5bn |
| IIJA | $1.2tn |
| CHIPS | $52bn |
What is included in the product
 Detailed Word Document
Explores how macro-environmental factors uniquely affect Standard Motor Products across Political, Economic, Social, Technological, Environmental, and Legal dimensions, with data-backed trends and forward-looking insights tailored to the auto parts industry and regional market dynamics to help executives and investors identify risks and opportunities.

 Customizable Excel Spreadsheet
Condensed PESTLE of Standard Motor Products that’s visually segmented for quick interpretation, easily dropped into presentations or shared across teams, and editable for region- or product-specific notes to streamline risk discussions and strategic planning.
Economic factors

Miles driven and vehicle age
Aftermarket demand for Standard Motor Products closely follows vehicle usage and a aging U.S. car parc — U.S. vehicle miles traveled recovered to about 3.26 trillion in 2023 with average annual miles per driver near 13,800 in 2024, driving higher part wear. Higher miles increase failure rates for ignition, emissions and A/C components, boosting replacement cycles. The national average vehicle age rose to ~12.6 years in 2024, supporting steady parts demand. Economic slowdowns may cut VMT but often extend ownership, stabilizing maintenance revenue.
Input cost inflation
Input-cost inflation in 2024—with LME copper near $9,000/ton, elevated aluminum and resin prices, and ongoing semiconductor tightness—drives Standard Motor Products COGS volatility and margin pressure. SMP must use hedging, long-term supplier contracts, and targeted pricing to protect margins. Persistent inflation pushes distributor and retail pricing higher, and the speed of cost pass-through determines gross-margin resilience.

Supply chain and logistics
Ocean freight volatility and port congestion continue to drive lead times; the Drewry World Container Index fell roughly 80% from 2021 peaks by mid‑2024, easing but not eliminating delays. Nearshoring and dual‑sourcing improve resilience—McKinsey (2024) cites nearshoring can raise unit costs by about 10–20%—raising procurement spend. Inventory optimization is critical to sustain professional channel fill rates (typically >95%), while economic normalization is allowing firms to unwind elevated safety stocks built during the pandemic.

Currency and international exposure
FX movements affect Standard Motor Products by raising costs of imported components and altering translated foreign sales; a stronger dollar can compress overseas revenue while lowering dollar-priced input costs.
Company hedging programs aim to reduce earnings volatility but add operational complexity and potential basis risk; localized pricing helps protect market share in key markets.
- FX impact: import costs vs translated sales
- Strong dollar: compresses revenue, may cut some input costs
- Hedging: reduces volatility, increases complexity
- Pricing localization: preserves market share
Interest rates and credit conditions
- Higher borrowing costs: Fed 5.25–5.50%
- Tighter trade credit, lower inventories
- Shift to essential parts, lower AOV
Tariffs and EV incentives reshape North American supply chains
Aftermarket demand benefits from higher VMT (~3.26T miles in 2023) and U.S. vehicle age ~12.6 years (2024), supporting steady parts replacement. Input-cost inflation (LME copper ≈ $9,000/ton in 2024), freight volatility and semiconductor tightness pressure COGS and margins. Fed funds ~5.25–5.50% (mid‑2025) raises working‑capital costs and shifts demand toward essential parts.
| Metric | Value |
|---|---|
| VMT (2023) | 3.26T miles |
| Avg vehicle age (2024) | 12.6 yrs |
| LME copper (2024) | $9,000/ton |
| Fed funds (mid‑2025) | 5.25–5.50% |
Preview the Actual Deliverable
Standard Motor Products PESTLE Analysis
The Standard Motor Products PESTLE Analysis preview shown here is the exact document you’ll receive after purchase—fully formatted and ready to use. It provides concise political, economic, social, technological, legal, and environmental insights tailored to SMP. No placeholders or teasers—this is the final, downloadable file. Use it immediately after checkout.

Your Shortcut to Market Insight Starts Here
Explore how political regulation, economic cycles, supply-chain shifts, technological innovation and environmental rules affect Standard Motor Products' outlook. Our PESTLE pinpoints risks and opportunities for investors and strategists. Buy the full analysis to get actionable, downloadable insights now.
Political factors
Trade policy and tariffs
US tariffs from the 2018 Section 301 actions remain on roughly $550bn of Chinese goods with rates up to 25%, and Section 232 steel/aluminum duties (25%/10%) persist, raising costs for metals, electronics and subassemblies for Standard Motor Products. SMP may need to re‑source or raise prices to offset duties; USMCA (effective July 1, 2020) and its 75% auto content rule steer North American sourcing and logistics. Geopolitical tensions lengthen lead times and increase inventory buffers.
EV transition incentives
US and EU subsidies, including the US federal EV tax credit up to 7,500 USD and the NEVI charging program with about 5 billion USD, accelerate EV adoption and shift fleet mix toward electrified vehicles. Demand moves away from traditional engine parts toward high-voltage hardware, advanced thermal management and sensors, pressuring SMP to reallocate R&D and capex. Public funding for charging and grid upgrades further cements this policy-driven curve, affecting product roadmaps and revenue mix.
Infrastructure and industrial policy
Infrastructure Investment and Jobs Act (2021) authorized roughly $1.2 trillion, improving freight corridors and helping reduce logistics bottlenecks for parts distribution.
Buy American provisions in IIJA and tightened federal procurement rules favor domestic sourcing, potentially benefiting Standard Motor Products' US manufacturing footprint.
Federal grants and credits, including the CHIPS Act's $52 billion and IRA incentives, support automation and capacity upgrades; policy stability remains critical for long-term capex decisions.
Regional regulatory divergence
Regional regulatory divergence—US AIM Act (HFC phasedown 85% by 2036) vs EU F-gas (79% cut vs 2015 by 2030) and differing emerging-market timelines complicates homologation; SMP must tailor emissions and refrigerant components to local rules, respond to political shifts that can change compliance quickly, and manage SKU proliferation as a strategic imperative.
- AIM Act: 85% HFC phasedown by 2036
- EU F-gas: 79% reduction vs 2015 by 2030
- Rapid political shifts raise compliance risk and SKU complexity
Public procurement and fleet policies
Government fleet electrification (EO 14057: ZEVs by 2035) and a federal fleet of ~645,000 vehicles shift aftermarket demand away from some ICE parts while increasing temperature-control and power-electronics service needs; predictable fleet maintenance cycles sustain volume for HVAC and engine-management SKUs; public procurement sets price/quality benchmarks and mass-transit policy changes can reduce VMT and parts wear.
Tariffs and EV incentives reshape North American supply chains
US tariffs on roughly $550bn of Chinese goods and Section 232 duties (25%/10%) raise input costs; USMCA and Buy American steer North American sourcing. Federal policies (EV tax credit up to 7,500 USD, NEVI ~5bn USD, IIJA 1.2tn USD, CHIPS 52bn USD, IRA incentives) accelerate electrification and capex shifts. AIM Act (85% by 2036) and EU F‑gas (79% by 2030) force regional product variants; EO 14057 targets federal ZEVs by 2035.
| Policy | Key figure |
|---|---|
| Tariffs | $550bn |
| NEVI | $5bn |
| IIJA | $1.2tn |
| CHIPS | $52bn |
What is included in the product
Detailed Word Document
Explores how macro-environmental factors uniquely affect Standard Motor Products across Political, Economic, Social, Technological, Environmental, and Legal dimensions, with data-backed trends and forward-looking insights tailored to the auto parts industry and regional market dynamics to help executives and investors identify risks and opportunities.
Customizable Excel Spreadsheet
Condensed PESTLE of Standard Motor Products that’s visually segmented for quick interpretation, easily dropped into presentations or shared across teams, and editable for region- or product-specific notes to streamline risk discussions and strategic planning.
Economic factors
Miles driven and vehicle age
Aftermarket demand for Standard Motor Products closely follows vehicle usage and a aging U.S. car parc — U.S. vehicle miles traveled recovered to about 3.26 trillion in 2023 with average annual miles per driver near 13,800 in 2024, driving higher part wear. Higher miles increase failure rates for ignition, emissions and A/C components, boosting replacement cycles. The national average vehicle age rose to ~12.6 years in 2024, supporting steady parts demand. Economic slowdowns may cut VMT but often extend ownership, stabilizing maintenance revenue.
Input cost inflation
Input-cost inflation in 2024—with LME copper near $9,000/ton, elevated aluminum and resin prices, and ongoing semiconductor tightness—drives Standard Motor Products COGS volatility and margin pressure. SMP must use hedging, long-term supplier contracts, and targeted pricing to protect margins. Persistent inflation pushes distributor and retail pricing higher, and the speed of cost pass-through determines gross-margin resilience.
Supply chain and logistics
Ocean freight volatility and port congestion continue to drive lead times; the Drewry World Container Index fell roughly 80% from 2021 peaks by mid‑2024, easing but not eliminating delays. Nearshoring and dual‑sourcing improve resilience—McKinsey (2024) cites nearshoring can raise unit costs by about 10–20%—raising procurement spend. Inventory optimization is critical to sustain professional channel fill rates (typically >95%), while economic normalization is allowing firms to unwind elevated safety stocks built during the pandemic.
Currency and international exposure
FX movements affect Standard Motor Products by raising costs of imported components and altering translated foreign sales; a stronger dollar can compress overseas revenue while lowering dollar-priced input costs.
Company hedging programs aim to reduce earnings volatility but add operational complexity and potential basis risk; localized pricing helps protect market share in key markets.
- FX impact: import costs vs translated sales
- Strong dollar: compresses revenue, may cut some input costs
- Hedging: reduces volatility, increases complexity
- Pricing localization: preserves market share
Interest rates and credit conditions
- Higher borrowing costs: Fed 5.25–5.50%
- Tighter trade credit, lower inventories
- Shift to essential parts, lower AOV
Tariffs and EV incentives reshape North American supply chains
Aftermarket demand benefits from higher VMT (~3.26T miles in 2023) and U.S. vehicle age ~12.6 years (2024), supporting steady parts replacement. Input-cost inflation (LME copper ≈ $9,000/ton in 2024), freight volatility and semiconductor tightness pressure COGS and margins. Fed funds ~5.25–5.50% (mid‑2025) raises working‑capital costs and shifts demand toward essential parts.
| Metric | Value |
|---|---|
| VMT (2023) | 3.26T miles |
| Avg vehicle age (2024) | 12.6 yrs |
| LME copper (2024) | $9,000/ton |
| Fed funds (mid‑2025) | 5.25–5.50% |
Preview the Actual Deliverable
Standard Motor Products PESTLE Analysis
The Standard Motor Products PESTLE Analysis preview shown here is the exact document you’ll receive after purchase—fully formatted and ready to use. It provides concise political, economic, social, technological, legal, and environmental insights tailored to SMP. No placeholders or teasers—this is the final, downloadable file. Use it immediately after checkout.
Description
Your Shortcut to Market Insight Starts Here
Explore how political regulation, economic cycles, supply-chain shifts, technological innovation and environmental rules affect Standard Motor Products' outlook. Our PESTLE pinpoints risks and opportunities for investors and strategists. Buy the full analysis to get actionable, downloadable insights now.
Political factors
Trade policy and tariffs
US tariffs from the 2018 Section 301 actions remain on roughly $550bn of Chinese goods with rates up to 25%, and Section 232 steel/aluminum duties (25%/10%) persist, raising costs for metals, electronics and subassemblies for Standard Motor Products. SMP may need to re‑source or raise prices to offset duties; USMCA (effective July 1, 2020) and its 75% auto content rule steer North American sourcing and logistics. Geopolitical tensions lengthen lead times and increase inventory buffers.
EV transition incentives
US and EU subsidies, including the US federal EV tax credit up to 7,500 USD and the NEVI charging program with about 5 billion USD, accelerate EV adoption and shift fleet mix toward electrified vehicles. Demand moves away from traditional engine parts toward high-voltage hardware, advanced thermal management and sensors, pressuring SMP to reallocate R&D and capex. Public funding for charging and grid upgrades further cements this policy-driven curve, affecting product roadmaps and revenue mix.
Infrastructure and industrial policy
Infrastructure Investment and Jobs Act (2021) authorized roughly $1.2 trillion, improving freight corridors and helping reduce logistics bottlenecks for parts distribution.
Buy American provisions in IIJA and tightened federal procurement rules favor domestic sourcing, potentially benefiting Standard Motor Products' US manufacturing footprint.
Federal grants and credits, including the CHIPS Act's $52 billion and IRA incentives, support automation and capacity upgrades; policy stability remains critical for long-term capex decisions.
Regional regulatory divergence
Regional regulatory divergence—US AIM Act (HFC phasedown 85% by 2036) vs EU F-gas (79% cut vs 2015 by 2030) and differing emerging-market timelines complicates homologation; SMP must tailor emissions and refrigerant components to local rules, respond to political shifts that can change compliance quickly, and manage SKU proliferation as a strategic imperative.
- AIM Act: 85% HFC phasedown by 2036
- EU F-gas: 79% reduction vs 2015 by 2030
- Rapid political shifts raise compliance risk and SKU complexity
Public procurement and fleet policies
Government fleet electrification (EO 14057: ZEVs by 2035) and a federal fleet of ~645,000 vehicles shift aftermarket demand away from some ICE parts while increasing temperature-control and power-electronics service needs; predictable fleet maintenance cycles sustain volume for HVAC and engine-management SKUs; public procurement sets price/quality benchmarks and mass-transit policy changes can reduce VMT and parts wear.
Tariffs and EV incentives reshape North American supply chains
US tariffs on roughly $550bn of Chinese goods and Section 232 duties (25%/10%) raise input costs; USMCA and Buy American steer North American sourcing. Federal policies (EV tax credit up to 7,500 USD, NEVI ~5bn USD, IIJA 1.2tn USD, CHIPS 52bn USD, IRA incentives) accelerate electrification and capex shifts. AIM Act (85% by 2036) and EU F‑gas (79% by 2030) force regional product variants; EO 14057 targets federal ZEVs by 2035.
| Policy | Key figure |
|---|---|
| Tariffs | $550bn |
| NEVI | $5bn |
| IIJA | $1.2tn |
| CHIPS | $52bn |
What is included in the product
Detailed Word Document
Explores how macro-environmental factors uniquely affect Standard Motor Products across Political, Economic, Social, Technological, Environmental, and Legal dimensions, with data-backed trends and forward-looking insights tailored to the auto parts industry and regional market dynamics to help executives and investors identify risks and opportunities.
Customizable Excel Spreadsheet
Condensed PESTLE of Standard Motor Products that’s visually segmented for quick interpretation, easily dropped into presentations or shared across teams, and editable for region- or product-specific notes to streamline risk discussions and strategic planning.
Economic factors
Miles driven and vehicle age
Aftermarket demand for Standard Motor Products closely follows vehicle usage and a aging U.S. car parc — U.S. vehicle miles traveled recovered to about 3.26 trillion in 2023 with average annual miles per driver near 13,800 in 2024, driving higher part wear. Higher miles increase failure rates for ignition, emissions and A/C components, boosting replacement cycles. The national average vehicle age rose to ~12.6 years in 2024, supporting steady parts demand. Economic slowdowns may cut VMT but often extend ownership, stabilizing maintenance revenue.
Input cost inflation
Input-cost inflation in 2024—with LME copper near $9,000/ton, elevated aluminum and resin prices, and ongoing semiconductor tightness—drives Standard Motor Products COGS volatility and margin pressure. SMP must use hedging, long-term supplier contracts, and targeted pricing to protect margins. Persistent inflation pushes distributor and retail pricing higher, and the speed of cost pass-through determines gross-margin resilience.
Supply chain and logistics
Ocean freight volatility and port congestion continue to drive lead times; the Drewry World Container Index fell roughly 80% from 2021 peaks by mid‑2024, easing but not eliminating delays. Nearshoring and dual‑sourcing improve resilience—McKinsey (2024) cites nearshoring can raise unit costs by about 10–20%—raising procurement spend. Inventory optimization is critical to sustain professional channel fill rates (typically >95%), while economic normalization is allowing firms to unwind elevated safety stocks built during the pandemic.
Currency and international exposure
FX movements affect Standard Motor Products by raising costs of imported components and altering translated foreign sales; a stronger dollar can compress overseas revenue while lowering dollar-priced input costs.
Company hedging programs aim to reduce earnings volatility but add operational complexity and potential basis risk; localized pricing helps protect market share in key markets.
- FX impact: import costs vs translated sales
- Strong dollar: compresses revenue, may cut some input costs
- Hedging: reduces volatility, increases complexity
- Pricing localization: preserves market share
Interest rates and credit conditions
- Higher borrowing costs: Fed 5.25–5.50%
- Tighter trade credit, lower inventories
- Shift to essential parts, lower AOV
Tariffs and EV incentives reshape North American supply chains
Aftermarket demand benefits from higher VMT (~3.26T miles in 2023) and U.S. vehicle age ~12.6 years (2024), supporting steady parts replacement. Input-cost inflation (LME copper ≈ $9,000/ton in 2024), freight volatility and semiconductor tightness pressure COGS and margins. Fed funds ~5.25–5.50% (mid‑2025) raises working‑capital costs and shifts demand toward essential parts.
| Metric | Value |
|---|---|
| VMT (2023) | 3.26T miles |
| Avg vehicle age (2024) | 12.6 yrs |
| LME copper (2024) | $9,000/ton |
| Fed funds (mid‑2025) | 5.25–5.50% |
Preview the Actual Deliverable
Standard Motor Products PESTLE Analysis
The Standard Motor Products PESTLE Analysis preview shown here is the exact document you’ll receive after purchase—fully formatted and ready to use. It provides concise political, economic, social, technological, legal, and environmental insights tailored to SMP. No placeholders or teasers—this is the final, downloadable file. Use it immediately after checkout.











