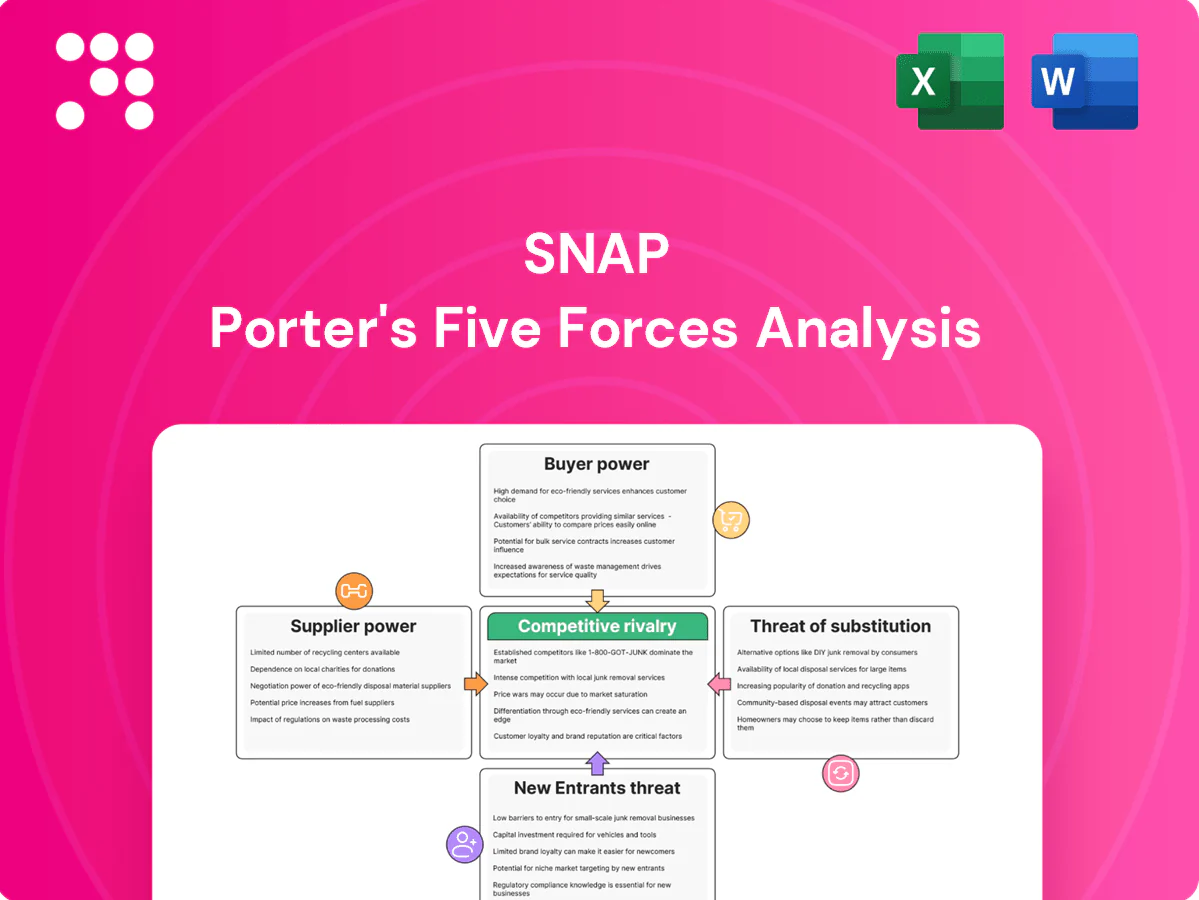
Snap Porter's Five Forces Analysis

A Must-Have Tool for Decision-Makers
Snap’s Porter's Five Forces snapshot highlights intense competitive rivalry, moderate buyer power, and growing substitute threats as AR and ad platforms evolve. This brief overview flags strategic pressures but omits force-by-force ratings, visuals, and quantified implications. Unlock the full Porter's Five Forces Analysis to get a consultant-grade breakdown, visuals, and actionable insights to inform investment or strategy decisions.
Suppliers Bargaining Power

Dependence on Apple and Google
Snap depends on iOS and Android for distribution, data access and tracking; in 2024 iOS and Android together held ~99% of global mobile OS share (StatCounter: Android ~69%, iOS ~30%), concentrating gatekeeper power. Platform policy shifts like Apple’s ATT and Google privacy changes have reduced ad targeting and measurement accuracy, while app-store commissions (15–30%) and rules constrain monetization levers. This concentration gives Apple and Google meaningful leverage over Snap’s ad business and product changes.
Cloud and infrastructure concentration
Snap relies on third-party cloud providers for compute, storage and delivery, and global cloud market concentration (2024 market shares: AWS ~33%, Azure ~23%, Google Cloud ~12%) means pricing, capacity and egress terms can materially affect unit economics at scale. High switching costs and migration risk reinforce supplier bargaining power. Long-term commitments lower volatility but increase lock-in and exposure to price shifts.

Content, music, and licensing partners
Licenses for music, media snippets, and AR assets underpin Snap's engagement features but give rights holders leverage to demand higher fees or restrictions; global recorded music revenue exceeded $25 billion in 2024 (IFPI), highlighting licensors' market strength. Limited substitutes for top catalogs amplify bargaining power on price and usage terms. Snap mitigates risk by diversifying partners and prioritizing user-generated content to lower licensing exposure.

Hardware and component suppliers
Spectacles and future devices depend on specialized optics, sensors and application-specific chips, and supply is concentrated among a few vendors (TSMC held about 54% of foundry revenue in 2024), creating lead-time and pricing pressure. Yield issues or component shortages have delayed launches and raised COGS historically; strategic sourcing and design-for-supply lower but do not eliminate exposure.
- Vendor concentration: major foundries and optics firms
- Lead times: elevated vs pre-pandemic levels
- Impact: launch delays, higher COGS
- Mitigation: strategic sourcing, design-for-supply
Ad tech, measurement, and brand safety tools
Third-party verification, attribution, and brand-safety tools remain critical to advertiser trust; preferred partners can set standards and levy fees (often cited up to 20%), shaping net CPMs and partner choice.
Service degradation or withdrawal can cut measured campaign conversions by ~30% in industry case studies, harming advertiser perception and spend.
Snap has accelerated first-party measurement investments in 2024 to reduce dependency and control attribution accuracy.
- third-party critical
- preferred partners charge fees (~20%)
- withdrawal → ~30% measured hit
- snap first-party measurement (2024)
Supplier power high: OS, cloud, foundry, licensors raise costs; verification fees cut conversions
Supplier power is high: iOS+Android ~99% share (2024), app-store fees 15–30% and ATT-like rules shrink ad effectiveness. Cloud concentration (AWS 33%, Azure 23%, GCP 12% in 2024) raises costs and switching risk. Key licensors (recorded music >$25B 2024) and component foundries (TSMC ~54% 2024) can demand price/terms. Preferred verification partners levy ~20% fees; withdrawal can cut measured conversions ~30%.
| Supplier | 2024 metric |
|---|---|
| Mobile OS | iOS+Android ~99% |
| Cloud | AWS 33% / Azure 23% / GCP 12% |
| Foundry | TSMC ~54% |
| Music market | >$25B |
What is included in the product
 Detailed Word Document
Comprehensive Porter's Five Forces analysis tailored for Snap that uncovers competitive dynamics, customer and supplier power, substitution and entrant threats, and emerging disruptors affecting its pricing, profitability and market share—delivered in an editable format for easy inclusion in reports and strategy decks.

 Customizable Excel Spreadsheet
A one-sheet, customizable Porter's Five Forces tool that instantly visualizes competitive pressure with a spider chart, no macros required—easy to copy into decks, swap in your data, and duplicate tabs for scenario or regulatory impact analysis.
Customers Bargaining Power

Advertisers have abundant alternatives
Meta, TikTok, YouTube and search vie for the same ad budgets, while programmatic and self-serve platforms—which drove over 80% of US display transactions in 2023–24—make switching low and fast. Performance marketers can reallocate spend within days based on ROAS, increasing price sensitivity. That ease of movement empowers buyers to demand better CPMs, measurement and creative tools from Snap.
Agency and large-brand negotiation
Major agencies aggregate client budgets and negotiate rates, incentives, and bespoke service levels that compress platform margins; they also demand continuous optimization tied to campaign outcomes. Volume discounts and bespoke support shift leverage away from Snap, while agencies’ performance expectations force ongoing investment in measurement, scale, and brand safety. Snap must prove measurement accuracy, reach, and safety to retain spend.

User attention is the currency
End users pay with time, not cash, so attention is highly contestable; in 2024 global digital ad spend topped $620B, tying revenue directly to engagement. If experiences lag, users switch apps instantly, forcing Snap to prioritize product velocity and reliability or lose share. That indirect buyer power increases churn risk and makes engagement volatile, which cascades into ad demand and pricing pressure.

Privacy and relevance expectations
Users expect granular privacy controls alongside personalized content; tighter privacy norms have reduced data signals and hurt ad performance. Advertisers press for better targeting or lower prices, given ads make up over 95% of Snap’s revenue. Snap must balance user trust with monetization to protect its >400 million DAU base while preserving CPMs.
- Privacy vs targeting: reduced signals
- Advertiser leverage: demand lower prices/better targeting
- Revenue mix: ads >95% (2024)
- User scale: >400M DAU (2024)
Youth-skewed audience concentration
Snap’s core demographic concentration is a double-edged sword: with roughly 428 million DAUs in 2024 and an estimated ~60% under 25, advertisers focused on older cohorts often discount Snap inventory, reducing CPMs. Rapid cyclical shifts in teen culture can quickly alter engagement, raising churn risk. Heavy dependence on one segment magnifies buyer leverage during downturns, pressuring ad rates and inventory mix.
- High youth share: ~60% under 25
- DAUs 2024: ~428M
- Advertiser leverage rises in downturns, lowering CPMs
Programmatic (>80%) drives ad leverage; social 428M DAUs, ~60% under 25
Advertisers wield strong leverage: programmatic/self-serve drove >80% of US display transactions (2023–24), enabling rapid reallocation and price sensitivity. Snap relies on ads for >95% of revenue (2024) with ~428M DAUs (~60% under 25), making CPMs vulnerable to churn and demographic shifts as global digital ad spend topped $620B (2024).
| Metric | Value (2024) |
|---|---|
| US programmatic share | >80% |
| Snap ad revenue share | >95% |
| DAUs | ~428M |
| % under 25 | ~60% |
| Global digital ad spend | $620B |
Full Version Awaits
Snap Porter's Five Forces Analysis
This preview shows the exact Snap Porter’s Five Forces Analysis you'll receive immediately after purchase—no placeholders or edits. The file is fully formatted, professionally written, and ready for download and use the moment you buy. What you see here is the final deliverable, available instantly after payment.

A Must-Have Tool for Decision-Makers
Snap’s Porter's Five Forces snapshot highlights intense competitive rivalry, moderate buyer power, and growing substitute threats as AR and ad platforms evolve. This brief overview flags strategic pressures but omits force-by-force ratings, visuals, and quantified implications. Unlock the full Porter's Five Forces Analysis to get a consultant-grade breakdown, visuals, and actionable insights to inform investment or strategy decisions.
Suppliers Bargaining Power
Dependence on Apple and Google
Snap depends on iOS and Android for distribution, data access and tracking; in 2024 iOS and Android together held ~99% of global mobile OS share (StatCounter: Android ~69%, iOS ~30%), concentrating gatekeeper power. Platform policy shifts like Apple’s ATT and Google privacy changes have reduced ad targeting and measurement accuracy, while app-store commissions (15–30%) and rules constrain monetization levers. This concentration gives Apple and Google meaningful leverage over Snap’s ad business and product changes.
Cloud and infrastructure concentration
Snap relies on third-party cloud providers for compute, storage and delivery, and global cloud market concentration (2024 market shares: AWS ~33%, Azure ~23%, Google Cloud ~12%) means pricing, capacity and egress terms can materially affect unit economics at scale. High switching costs and migration risk reinforce supplier bargaining power. Long-term commitments lower volatility but increase lock-in and exposure to price shifts.
Content, music, and licensing partners
Licenses for music, media snippets, and AR assets underpin Snap's engagement features but give rights holders leverage to demand higher fees or restrictions; global recorded music revenue exceeded $25 billion in 2024 (IFPI), highlighting licensors' market strength. Limited substitutes for top catalogs amplify bargaining power on price and usage terms. Snap mitigates risk by diversifying partners and prioritizing user-generated content to lower licensing exposure.
Hardware and component suppliers
Spectacles and future devices depend on specialized optics, sensors and application-specific chips, and supply is concentrated among a few vendors (TSMC held about 54% of foundry revenue in 2024), creating lead-time and pricing pressure. Yield issues or component shortages have delayed launches and raised COGS historically; strategic sourcing and design-for-supply lower but do not eliminate exposure.
- Vendor concentration: major foundries and optics firms
- Lead times: elevated vs pre-pandemic levels
- Impact: launch delays, higher COGS
- Mitigation: strategic sourcing, design-for-supply
Ad tech, measurement, and brand safety tools
Third-party verification, attribution, and brand-safety tools remain critical to advertiser trust; preferred partners can set standards and levy fees (often cited up to 20%), shaping net CPMs and partner choice.
Service degradation or withdrawal can cut measured campaign conversions by ~30% in industry case studies, harming advertiser perception and spend.
Snap has accelerated first-party measurement investments in 2024 to reduce dependency and control attribution accuracy.
- third-party critical
- preferred partners charge fees (~20%)
- withdrawal → ~30% measured hit
- snap first-party measurement (2024)
Supplier power high: OS, cloud, foundry, licensors raise costs; verification fees cut conversions
Supplier power is high: iOS+Android ~99% share (2024), app-store fees 15–30% and ATT-like rules shrink ad effectiveness. Cloud concentration (AWS 33%, Azure 23%, GCP 12% in 2024) raises costs and switching risk. Key licensors (recorded music >$25B 2024) and component foundries (TSMC ~54% 2024) can demand price/terms. Preferred verification partners levy ~20% fees; withdrawal can cut measured conversions ~30%.
| Supplier | 2024 metric |
|---|---|
| Mobile OS | iOS+Android ~99% |
| Cloud | AWS 33% / Azure 23% / GCP 12% |
| Foundry | TSMC ~54% |
| Music market | >$25B |
What is included in the product
Detailed Word Document
Comprehensive Porter's Five Forces analysis tailored for Snap that uncovers competitive dynamics, customer and supplier power, substitution and entrant threats, and emerging disruptors affecting its pricing, profitability and market share—delivered in an editable format for easy inclusion in reports and strategy decks.
Customizable Excel Spreadsheet
A one-sheet, customizable Porter's Five Forces tool that instantly visualizes competitive pressure with a spider chart, no macros required—easy to copy into decks, swap in your data, and duplicate tabs for scenario or regulatory impact analysis.
Customers Bargaining Power
Advertisers have abundant alternatives
Meta, TikTok, YouTube and search vie for the same ad budgets, while programmatic and self-serve platforms—which drove over 80% of US display transactions in 2023–24—make switching low and fast. Performance marketers can reallocate spend within days based on ROAS, increasing price sensitivity. That ease of movement empowers buyers to demand better CPMs, measurement and creative tools from Snap.
Agency and large-brand negotiation
Major agencies aggregate client budgets and negotiate rates, incentives, and bespoke service levels that compress platform margins; they also demand continuous optimization tied to campaign outcomes. Volume discounts and bespoke support shift leverage away from Snap, while agencies’ performance expectations force ongoing investment in measurement, scale, and brand safety. Snap must prove measurement accuracy, reach, and safety to retain spend.
User attention is the currency
End users pay with time, not cash, so attention is highly contestable; in 2024 global digital ad spend topped $620B, tying revenue directly to engagement. If experiences lag, users switch apps instantly, forcing Snap to prioritize product velocity and reliability or lose share. That indirect buyer power increases churn risk and makes engagement volatile, which cascades into ad demand and pricing pressure.
Privacy and relevance expectations
Users expect granular privacy controls alongside personalized content; tighter privacy norms have reduced data signals and hurt ad performance. Advertisers press for better targeting or lower prices, given ads make up over 95% of Snap’s revenue. Snap must balance user trust with monetization to protect its >400 million DAU base while preserving CPMs.
- Privacy vs targeting: reduced signals
- Advertiser leverage: demand lower prices/better targeting
- Revenue mix: ads >95% (2024)
- User scale: >400M DAU (2024)
Youth-skewed audience concentration
Snap’s core demographic concentration is a double-edged sword: with roughly 428 million DAUs in 2024 and an estimated ~60% under 25, advertisers focused on older cohorts often discount Snap inventory, reducing CPMs. Rapid cyclical shifts in teen culture can quickly alter engagement, raising churn risk. Heavy dependence on one segment magnifies buyer leverage during downturns, pressuring ad rates and inventory mix.
- High youth share: ~60% under 25
- DAUs 2024: ~428M
- Advertiser leverage rises in downturns, lowering CPMs
Programmatic (>80%) drives ad leverage; social 428M DAUs, ~60% under 25
Advertisers wield strong leverage: programmatic/self-serve drove >80% of US display transactions (2023–24), enabling rapid reallocation and price sensitivity. Snap relies on ads for >95% of revenue (2024) with ~428M DAUs (~60% under 25), making CPMs vulnerable to churn and demographic shifts as global digital ad spend topped $620B (2024).
| Metric | Value (2024) |
|---|---|
| US programmatic share | >80% |
| Snap ad revenue share | >95% |
| DAUs | ~428M |
| % under 25 | ~60% |
| Global digital ad spend | $620B |
Full Version Awaits
Snap Porter's Five Forces Analysis
This preview shows the exact Snap Porter’s Five Forces Analysis you'll receive immediately after purchase—no placeholders or edits. The file is fully formatted, professionally written, and ready for download and use the moment you buy. What you see here is the final deliverable, available instantly after payment.
Original: $10.00
-65%$10.00
$3.50Description
A Must-Have Tool for Decision-Makers
Snap’s Porter's Five Forces snapshot highlights intense competitive rivalry, moderate buyer power, and growing substitute threats as AR and ad platforms evolve. This brief overview flags strategic pressures but omits force-by-force ratings, visuals, and quantified implications. Unlock the full Porter's Five Forces Analysis to get a consultant-grade breakdown, visuals, and actionable insights to inform investment or strategy decisions.
Suppliers Bargaining Power
Dependence on Apple and Google
Snap depends on iOS and Android for distribution, data access and tracking; in 2024 iOS and Android together held ~99% of global mobile OS share (StatCounter: Android ~69%, iOS ~30%), concentrating gatekeeper power. Platform policy shifts like Apple’s ATT and Google privacy changes have reduced ad targeting and measurement accuracy, while app-store commissions (15–30%) and rules constrain monetization levers. This concentration gives Apple and Google meaningful leverage over Snap’s ad business and product changes.
Cloud and infrastructure concentration
Snap relies on third-party cloud providers for compute, storage and delivery, and global cloud market concentration (2024 market shares: AWS ~33%, Azure ~23%, Google Cloud ~12%) means pricing, capacity and egress terms can materially affect unit economics at scale. High switching costs and migration risk reinforce supplier bargaining power. Long-term commitments lower volatility but increase lock-in and exposure to price shifts.
Content, music, and licensing partners
Licenses for music, media snippets, and AR assets underpin Snap's engagement features but give rights holders leverage to demand higher fees or restrictions; global recorded music revenue exceeded $25 billion in 2024 (IFPI), highlighting licensors' market strength. Limited substitutes for top catalogs amplify bargaining power on price and usage terms. Snap mitigates risk by diversifying partners and prioritizing user-generated content to lower licensing exposure.
Hardware and component suppliers
Spectacles and future devices depend on specialized optics, sensors and application-specific chips, and supply is concentrated among a few vendors (TSMC held about 54% of foundry revenue in 2024), creating lead-time and pricing pressure. Yield issues or component shortages have delayed launches and raised COGS historically; strategic sourcing and design-for-supply lower but do not eliminate exposure.
- Vendor concentration: major foundries and optics firms
- Lead times: elevated vs pre-pandemic levels
- Impact: launch delays, higher COGS
- Mitigation: strategic sourcing, design-for-supply
Ad tech, measurement, and brand safety tools
Third-party verification, attribution, and brand-safety tools remain critical to advertiser trust; preferred partners can set standards and levy fees (often cited up to 20%), shaping net CPMs and partner choice.
Service degradation or withdrawal can cut measured campaign conversions by ~30% in industry case studies, harming advertiser perception and spend.
Snap has accelerated first-party measurement investments in 2024 to reduce dependency and control attribution accuracy.
- third-party critical
- preferred partners charge fees (~20%)
- withdrawal → ~30% measured hit
- snap first-party measurement (2024)
Supplier power high: OS, cloud, foundry, licensors raise costs; verification fees cut conversions
Supplier power is high: iOS+Android ~99% share (2024), app-store fees 15–30% and ATT-like rules shrink ad effectiveness. Cloud concentration (AWS 33%, Azure 23%, GCP 12% in 2024) raises costs and switching risk. Key licensors (recorded music >$25B 2024) and component foundries (TSMC ~54% 2024) can demand price/terms. Preferred verification partners levy ~20% fees; withdrawal can cut measured conversions ~30%.
| Supplier | 2024 metric |
|---|---|
| Mobile OS | iOS+Android ~99% |
| Cloud | AWS 33% / Azure 23% / GCP 12% |
| Foundry | TSMC ~54% |
| Music market | >$25B |
What is included in the product
Detailed Word Document
Comprehensive Porter's Five Forces analysis tailored for Snap that uncovers competitive dynamics, customer and supplier power, substitution and entrant threats, and emerging disruptors affecting its pricing, profitability and market share—delivered in an editable format for easy inclusion in reports and strategy decks.
Customizable Excel Spreadsheet
A one-sheet, customizable Porter's Five Forces tool that instantly visualizes competitive pressure with a spider chart, no macros required—easy to copy into decks, swap in your data, and duplicate tabs for scenario or regulatory impact analysis.
Customers Bargaining Power
Advertisers have abundant alternatives
Meta, TikTok, YouTube and search vie for the same ad budgets, while programmatic and self-serve platforms—which drove over 80% of US display transactions in 2023–24—make switching low and fast. Performance marketers can reallocate spend within days based on ROAS, increasing price sensitivity. That ease of movement empowers buyers to demand better CPMs, measurement and creative tools from Snap.
Agency and large-brand negotiation
Major agencies aggregate client budgets and negotiate rates, incentives, and bespoke service levels that compress platform margins; they also demand continuous optimization tied to campaign outcomes. Volume discounts and bespoke support shift leverage away from Snap, while agencies’ performance expectations force ongoing investment in measurement, scale, and brand safety. Snap must prove measurement accuracy, reach, and safety to retain spend.
User attention is the currency
End users pay with time, not cash, so attention is highly contestable; in 2024 global digital ad spend topped $620B, tying revenue directly to engagement. If experiences lag, users switch apps instantly, forcing Snap to prioritize product velocity and reliability or lose share. That indirect buyer power increases churn risk and makes engagement volatile, which cascades into ad demand and pricing pressure.
Privacy and relevance expectations
Users expect granular privacy controls alongside personalized content; tighter privacy norms have reduced data signals and hurt ad performance. Advertisers press for better targeting or lower prices, given ads make up over 95% of Snap’s revenue. Snap must balance user trust with monetization to protect its >400 million DAU base while preserving CPMs.
- Privacy vs targeting: reduced signals
- Advertiser leverage: demand lower prices/better targeting
- Revenue mix: ads >95% (2024)
- User scale: >400M DAU (2024)
Youth-skewed audience concentration
Snap’s core demographic concentration is a double-edged sword: with roughly 428 million DAUs in 2024 and an estimated ~60% under 25, advertisers focused on older cohorts often discount Snap inventory, reducing CPMs. Rapid cyclical shifts in teen culture can quickly alter engagement, raising churn risk. Heavy dependence on one segment magnifies buyer leverage during downturns, pressuring ad rates and inventory mix.
- High youth share: ~60% under 25
- DAUs 2024: ~428M
- Advertiser leverage rises in downturns, lowering CPMs
Programmatic (>80%) drives ad leverage; social 428M DAUs, ~60% under 25
Advertisers wield strong leverage: programmatic/self-serve drove >80% of US display transactions (2023–24), enabling rapid reallocation and price sensitivity. Snap relies on ads for >95% of revenue (2024) with ~428M DAUs (~60% under 25), making CPMs vulnerable to churn and demographic shifts as global digital ad spend topped $620B (2024).
| Metric | Value (2024) |
|---|---|
| US programmatic share | >80% |
| Snap ad revenue share | >95% |
| DAUs | ~428M |
| % under 25 | ~60% |
| Global digital ad spend | $620B |
Full Version Awaits
Snap Porter's Five Forces Analysis
This preview shows the exact Snap Porter’s Five Forces Analysis you'll receive immediately after purchase—no placeholders or edits. The file is fully formatted, professionally written, and ready for download and use the moment you buy. What you see here is the final deliverable, available instantly after payment.











