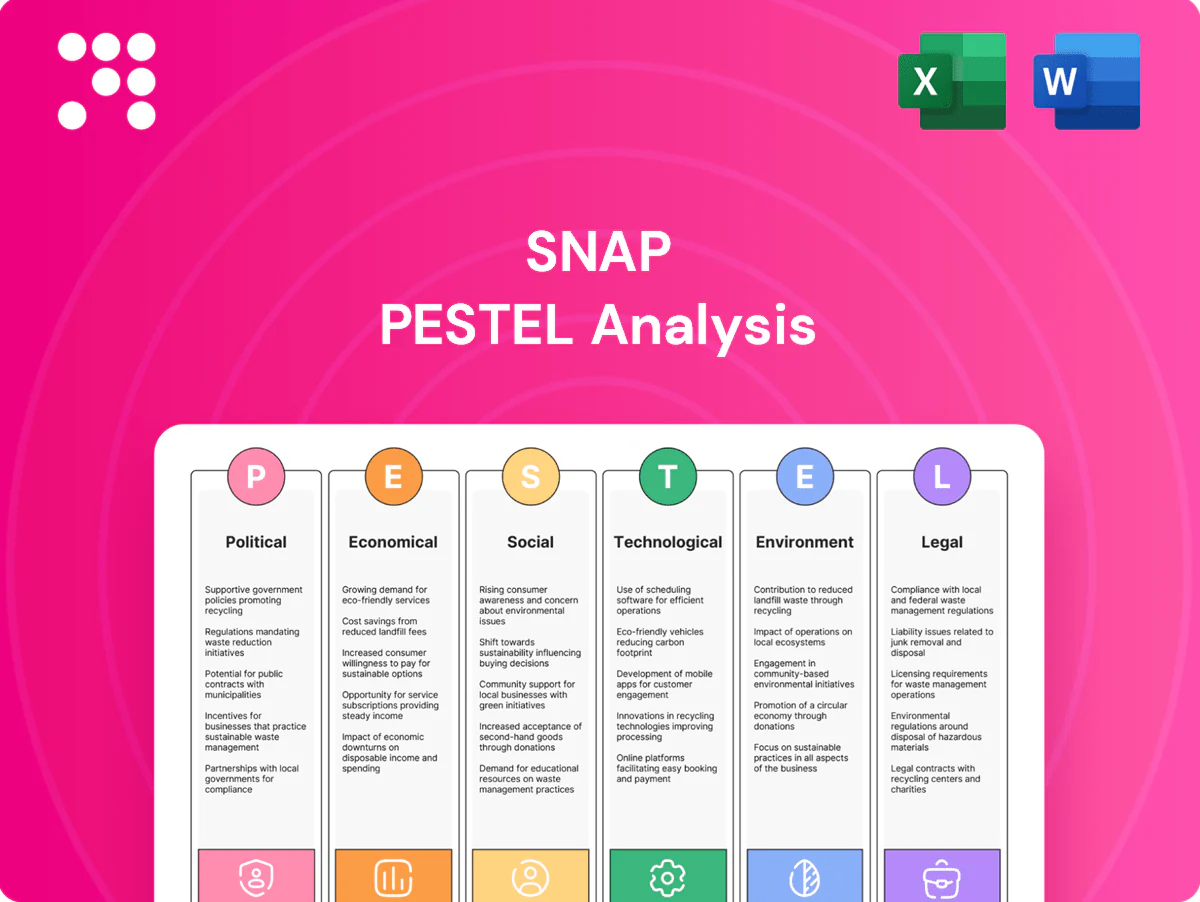
Snap PESTLE Analysis

Your Competitive Advantage Starts with This Report
Unlock strategic advantage with our PESTLE Analysis of Snap—concise, up-to-date insight into political, economic, social, technological, legal and environmental forces shaping its future. Ideal for investors and strategists; buy the full report for actionable, customizable intelligence ready to deploy.
Political factors

Platform regulation momentum
Governments are intensifying scrutiny of social platforms over safety and integrity, with the EU Digital Services Act allowing fines up to 6% of global turnover and the UK Online Safety Act imposing strict duties; such rules force faster takedowns, transparency and crisis protocols. For Snap—with roughly $4.8bn revenue in 2024—compliance demands added policy, ops and tooling spend but can become a trust differentiator for regulators and advertisers.
Data sovereignty and localization
More countries such as China, Russia and India now require local storage and processing of user data, fragmenting infrastructure and complicating feature parity and ad delivery across regions.
To comply, Snap may incur higher cloud and staffing costs and accept latency trade-offs by deploying regional stacks.
GDPR-era fines totalling about €3.8 billion to date illustrate the real risk of fines, service limits or loss of market access.

Geopolitical tensions and ad spend
Macro geopolitical tensions and sanctions, exemplified by Snap’s suspension of operations in Russia in March 2022, disrupt cross-border campaigns and force brands to pause or reallocate budgets, pressuring CPMs. Snap’s significant international footprint amplifies FX and policy risk, creating revenue volatility. Scenario planning and regional diversification help mitigate these swings.

Political advertising and content rules
Snap has maintained a near-total ban on paid political advertising since 2019, and evolving norms around misinformation and civic content continue to shape tighter policy choices that lower regulatory and reputational risk but constrain access to political ad revenue pools.
Consistent enforcement is vital to prevent public backlash and regulatory scrutiny; clear guardrails and transparency help preserve user trust and advertiser safety while limiting short-term monetization opportunities.
- Policy: near-total political ad ban since 2019
- Trade-off: reduced legal/reputational risk vs lost political ad revenue
- Priority: consistent enforcement to avoid backlash
- Goal: clear guardrails to protect users and advertisers
Digital services taxes (DST)
- Impact: margin compression
- Example: France 3% DST (€25m/€750m thresholds)
- Risk: overlapping regimes
- Action: revise pricing and tax planning
EU DSA 6%, GDPR €3.8bn push social app to lift compliance
Governments tighten platform safety and integrity rules (EU DSA fines up to 6% turnover; GDPR fines ≈€3.8bn to date), forcing Snap (≈$4.8bn revenue 2024) to raise compliance, ops and regional infra spend. Local data laws and geopolitical suspensions drive feature fragmentation and revenue volatility. Digital services taxes (e.g., France 3% >€25m/€750m) compress margins; consistent enforcement and regional diversification mitigate risks.
| Metric | Value |
|---|---|
| Snap revenue 2024 | $4.8bn |
| DSA fine cap | 6% global turnover |
| GDPR fines to date | ≈€3.8bn |
| France DST | 3% (thresholds €25m/€750m) |
What is included in the product
 Detailed Word Document
Explores how external macro-environmental factors uniquely affect Snap across six dimensions—Political, Economic, Social, Technological, Environmental, and Legal—within the global social media and digital advertising context. Every section is data-backed, forward-looking, and formatted for executives, consultants, and entrepreneurs to identify threats, opportunities, and strategy-ready insights.

 Customizable Excel Spreadsheet
A concise, visually segmented PESTLE summary of Snap that’s easy to drop into presentations, share across teams, and annotate with region-specific notes to streamline strategy meetings and risk discussions.
Economic factors

Advertising cycle sensitivity
Ad budgets are cyclical and track GDP and corporate earnings, and Snap—which generated roughly $4.6 billion in 2023 and had ~363 million DAUs—faces pressure to shift spend from brand to performance in downturns, compressing pricing. Snap’s direct-response tools cushion revenue but cannot fully offset macro softening. Diversifying verticals and better ROAS analytics improve revenue stability.
Signal loss and monetization
Apple's App Tracking Transparency rolled out in 2021 and by 2024 iOS ad‑tracking opt‑in rates averaged roughly 25–30% industrywide, reducing mobile ad signal quality and harming targeting and measurement. Industry analyses show eCPMs fell by up to ~30% on impacted iOS inventory, so Snap’s investment in privacy‑safe attribution and modeled measurement is economically critical. Demonstrable conversion lift from these solutions is a prerequisite to unlocking incremental advertiser budgets.

FX and international exposure
Revenue earned abroad exposes Snap to FX translation risk; Snap reported full-year 2023 revenue of $4.59 billion, so dollar strength can materially compress reported growth and margins when non‑USD markets weaken. Hedging programs reduce volatility but introduce incremental costs and operational complexity that pressured gross margins in recent quarters. Localized go‑to‑market and pricing in local currencies help balance currency swings and sustain user and advertiser growth.

Cost structure and scalability
Cloud, AI compute, and content-moderation costs are major variable drivers for Snap; FY2024 revenue was about $5.8B, pressuring gross margin until infrastructure efficiencies scale. On-device ML and efficient CDN/hosting reduced incremental cost-per-user, helping gross margin recovery. Headcount cuts since 2023 and automation improve operating leverage. Hardware experiments like Spectacles require capital-light partnerships to avoid margin drag.
- Cloud/AI: variable COGS
- On-device ML: margin lift
- Headcount discipline: opex leverage
- Spectacles: capital-light required
SMB advertiser health
SMB advertisers are a key growth engine for Snap but remain vulnerable to rate and demand shocks; US SMBs employ about 47% of the private workforce (SBA). Credit conditions and CAC payback windows largely determine spend resilience, while easy self-serve tools and flexible budgets improve stickiness and churn. Targeted education and case studies lift SMB adoption across cycles.
- SMB importance: 47% private employment
- Resilience: tied to credit/CAC payback
- Retention: self-serve + flexible budgets
- Growth: education and case studies
EU DSA 6%, GDPR €3.8bn push social app to lift compliance
Snap (≈363M DAU) revenue: $4.59B (2023), ≈$5.8B (FY2024); ad budgets track GDP so downturns and dollar strength compress growth/margins. ATT cut iOS opt‑ins to ~25–30% and eCPMs fell ≈30%, increasing need for privacy‑safe measurement. Cloud/AI costs raise COGS; SMBs (~47% private employment) remain credit‑sensitive.
| Metric | Value |
|---|---|
| DAUs | ≈363M |
| Revenue 2023 | $4.59B |
| Revenue FY2024 | ≈$5.8B |
| iOS opt‑in | 25–30% |
| eCPM impact | ≈-30% |
| SMB employment | ≈47% |
What You See Is What You Get
Snap PESTLE Analysis
The preview shown here is the exact Snap PESTLE Analysis you’ll receive after purchase—fully formatted and ready to use. It covers political, economic, social, technological, legal, and environmental factors relevant to Snap, with actionable insights and structured findings. No placeholders or teasers; this is the final file you can download instantly after checkout.

Your Competitive Advantage Starts with This Report
Unlock strategic advantage with our PESTLE Analysis of Snap—concise, up-to-date insight into political, economic, social, technological, legal and environmental forces shaping its future. Ideal for investors and strategists; buy the full report for actionable, customizable intelligence ready to deploy.
Political factors
Platform regulation momentum
Governments are intensifying scrutiny of social platforms over safety and integrity, with the EU Digital Services Act allowing fines up to 6% of global turnover and the UK Online Safety Act imposing strict duties; such rules force faster takedowns, transparency and crisis protocols. For Snap—with roughly $4.8bn revenue in 2024—compliance demands added policy, ops and tooling spend but can become a trust differentiator for regulators and advertisers.
Data sovereignty and localization
More countries such as China, Russia and India now require local storage and processing of user data, fragmenting infrastructure and complicating feature parity and ad delivery across regions.
To comply, Snap may incur higher cloud and staffing costs and accept latency trade-offs by deploying regional stacks.
GDPR-era fines totalling about €3.8 billion to date illustrate the real risk of fines, service limits or loss of market access.
Geopolitical tensions and ad spend
Macro geopolitical tensions and sanctions, exemplified by Snap’s suspension of operations in Russia in March 2022, disrupt cross-border campaigns and force brands to pause or reallocate budgets, pressuring CPMs. Snap’s significant international footprint amplifies FX and policy risk, creating revenue volatility. Scenario planning and regional diversification help mitigate these swings.
Political advertising and content rules
Snap has maintained a near-total ban on paid political advertising since 2019, and evolving norms around misinformation and civic content continue to shape tighter policy choices that lower regulatory and reputational risk but constrain access to political ad revenue pools.
Consistent enforcement is vital to prevent public backlash and regulatory scrutiny; clear guardrails and transparency help preserve user trust and advertiser safety while limiting short-term monetization opportunities.
- Policy: near-total political ad ban since 2019
- Trade-off: reduced legal/reputational risk vs lost political ad revenue
- Priority: consistent enforcement to avoid backlash
- Goal: clear guardrails to protect users and advertisers
Digital services taxes (DST)
- Impact: margin compression
- Example: France 3% DST (€25m/€750m thresholds)
- Risk: overlapping regimes
- Action: revise pricing and tax planning
EU DSA 6%, GDPR €3.8bn push social app to lift compliance
Governments tighten platform safety and integrity rules (EU DSA fines up to 6% turnover; GDPR fines ≈€3.8bn to date), forcing Snap (≈$4.8bn revenue 2024) to raise compliance, ops and regional infra spend. Local data laws and geopolitical suspensions drive feature fragmentation and revenue volatility. Digital services taxes (e.g., France 3% >€25m/€750m) compress margins; consistent enforcement and regional diversification mitigate risks.
| Metric | Value |
|---|---|
| Snap revenue 2024 | $4.8bn |
| DSA fine cap | 6% global turnover |
| GDPR fines to date | ≈€3.8bn |
| France DST | 3% (thresholds €25m/€750m) |
What is included in the product
Detailed Word Document
Explores how external macro-environmental factors uniquely affect Snap across six dimensions—Political, Economic, Social, Technological, Environmental, and Legal—within the global social media and digital advertising context. Every section is data-backed, forward-looking, and formatted for executives, consultants, and entrepreneurs to identify threats, opportunities, and strategy-ready insights.
Customizable Excel Spreadsheet
A concise, visually segmented PESTLE summary of Snap that’s easy to drop into presentations, share across teams, and annotate with region-specific notes to streamline strategy meetings and risk discussions.
Economic factors
Advertising cycle sensitivity
Ad budgets are cyclical and track GDP and corporate earnings, and Snap—which generated roughly $4.6 billion in 2023 and had ~363 million DAUs—faces pressure to shift spend from brand to performance in downturns, compressing pricing. Snap’s direct-response tools cushion revenue but cannot fully offset macro softening. Diversifying verticals and better ROAS analytics improve revenue stability.
Signal loss and monetization
Apple's App Tracking Transparency rolled out in 2021 and by 2024 iOS ad‑tracking opt‑in rates averaged roughly 25–30% industrywide, reducing mobile ad signal quality and harming targeting and measurement. Industry analyses show eCPMs fell by up to ~30% on impacted iOS inventory, so Snap’s investment in privacy‑safe attribution and modeled measurement is economically critical. Demonstrable conversion lift from these solutions is a prerequisite to unlocking incremental advertiser budgets.
FX and international exposure
Revenue earned abroad exposes Snap to FX translation risk; Snap reported full-year 2023 revenue of $4.59 billion, so dollar strength can materially compress reported growth and margins when non‑USD markets weaken. Hedging programs reduce volatility but introduce incremental costs and operational complexity that pressured gross margins in recent quarters. Localized go‑to‑market and pricing in local currencies help balance currency swings and sustain user and advertiser growth.
Cost structure and scalability
Cloud, AI compute, and content-moderation costs are major variable drivers for Snap; FY2024 revenue was about $5.8B, pressuring gross margin until infrastructure efficiencies scale. On-device ML and efficient CDN/hosting reduced incremental cost-per-user, helping gross margin recovery. Headcount cuts since 2023 and automation improve operating leverage. Hardware experiments like Spectacles require capital-light partnerships to avoid margin drag.
- Cloud/AI: variable COGS
- On-device ML: margin lift
- Headcount discipline: opex leverage
- Spectacles: capital-light required
SMB advertiser health
SMB advertisers are a key growth engine for Snap but remain vulnerable to rate and demand shocks; US SMBs employ about 47% of the private workforce (SBA). Credit conditions and CAC payback windows largely determine spend resilience, while easy self-serve tools and flexible budgets improve stickiness and churn. Targeted education and case studies lift SMB adoption across cycles.
- SMB importance: 47% private employment
- Resilience: tied to credit/CAC payback
- Retention: self-serve + flexible budgets
- Growth: education and case studies
EU DSA 6%, GDPR €3.8bn push social app to lift compliance
Snap (≈363M DAU) revenue: $4.59B (2023), ≈$5.8B (FY2024); ad budgets track GDP so downturns and dollar strength compress growth/margins. ATT cut iOS opt‑ins to ~25–30% and eCPMs fell ≈30%, increasing need for privacy‑safe measurement. Cloud/AI costs raise COGS; SMBs (~47% private employment) remain credit‑sensitive.
| Metric | Value |
|---|---|
| DAUs | ≈363M |
| Revenue 2023 | $4.59B |
| Revenue FY2024 | ≈$5.8B |
| iOS opt‑in | 25–30% |
| eCPM impact | ≈-30% |
| SMB employment | ≈47% |
What You See Is What You Get
Snap PESTLE Analysis
The preview shown here is the exact Snap PESTLE Analysis you’ll receive after purchase—fully formatted and ready to use. It covers political, economic, social, technological, legal, and environmental factors relevant to Snap, with actionable insights and structured findings. No placeholders or teasers; this is the final file you can download instantly after checkout.
Description
Your Competitive Advantage Starts with This Report
Unlock strategic advantage with our PESTLE Analysis of Snap—concise, up-to-date insight into political, economic, social, technological, legal and environmental forces shaping its future. Ideal for investors and strategists; buy the full report for actionable, customizable intelligence ready to deploy.
Political factors
Platform regulation momentum
Governments are intensifying scrutiny of social platforms over safety and integrity, with the EU Digital Services Act allowing fines up to 6% of global turnover and the UK Online Safety Act imposing strict duties; such rules force faster takedowns, transparency and crisis protocols. For Snap—with roughly $4.8bn revenue in 2024—compliance demands added policy, ops and tooling spend but can become a trust differentiator for regulators and advertisers.
Data sovereignty and localization
More countries such as China, Russia and India now require local storage and processing of user data, fragmenting infrastructure and complicating feature parity and ad delivery across regions.
To comply, Snap may incur higher cloud and staffing costs and accept latency trade-offs by deploying regional stacks.
GDPR-era fines totalling about €3.8 billion to date illustrate the real risk of fines, service limits or loss of market access.
Geopolitical tensions and ad spend
Macro geopolitical tensions and sanctions, exemplified by Snap’s suspension of operations in Russia in March 2022, disrupt cross-border campaigns and force brands to pause or reallocate budgets, pressuring CPMs. Snap’s significant international footprint amplifies FX and policy risk, creating revenue volatility. Scenario planning and regional diversification help mitigate these swings.
Political advertising and content rules
Snap has maintained a near-total ban on paid political advertising since 2019, and evolving norms around misinformation and civic content continue to shape tighter policy choices that lower regulatory and reputational risk but constrain access to political ad revenue pools.
Consistent enforcement is vital to prevent public backlash and regulatory scrutiny; clear guardrails and transparency help preserve user trust and advertiser safety while limiting short-term monetization opportunities.
- Policy: near-total political ad ban since 2019
- Trade-off: reduced legal/reputational risk vs lost political ad revenue
- Priority: consistent enforcement to avoid backlash
- Goal: clear guardrails to protect users and advertisers
Digital services taxes (DST)
- Impact: margin compression
- Example: France 3% DST (€25m/€750m thresholds)
- Risk: overlapping regimes
- Action: revise pricing and tax planning
EU DSA 6%, GDPR €3.8bn push social app to lift compliance
Governments tighten platform safety and integrity rules (EU DSA fines up to 6% turnover; GDPR fines ≈€3.8bn to date), forcing Snap (≈$4.8bn revenue 2024) to raise compliance, ops and regional infra spend. Local data laws and geopolitical suspensions drive feature fragmentation and revenue volatility. Digital services taxes (e.g., France 3% >€25m/€750m) compress margins; consistent enforcement and regional diversification mitigate risks.
| Metric | Value |
|---|---|
| Snap revenue 2024 | $4.8bn |
| DSA fine cap | 6% global turnover |
| GDPR fines to date | ≈€3.8bn |
| France DST | 3% (thresholds €25m/€750m) |
What is included in the product
Detailed Word Document
Explores how external macro-environmental factors uniquely affect Snap across six dimensions—Political, Economic, Social, Technological, Environmental, and Legal—within the global social media and digital advertising context. Every section is data-backed, forward-looking, and formatted for executives, consultants, and entrepreneurs to identify threats, opportunities, and strategy-ready insights.
Customizable Excel Spreadsheet
A concise, visually segmented PESTLE summary of Snap that’s easy to drop into presentations, share across teams, and annotate with region-specific notes to streamline strategy meetings and risk discussions.
Economic factors
Advertising cycle sensitivity
Ad budgets are cyclical and track GDP and corporate earnings, and Snap—which generated roughly $4.6 billion in 2023 and had ~363 million DAUs—faces pressure to shift spend from brand to performance in downturns, compressing pricing. Snap’s direct-response tools cushion revenue but cannot fully offset macro softening. Diversifying verticals and better ROAS analytics improve revenue stability.
Signal loss and monetization
Apple's App Tracking Transparency rolled out in 2021 and by 2024 iOS ad‑tracking opt‑in rates averaged roughly 25–30% industrywide, reducing mobile ad signal quality and harming targeting and measurement. Industry analyses show eCPMs fell by up to ~30% on impacted iOS inventory, so Snap’s investment in privacy‑safe attribution and modeled measurement is economically critical. Demonstrable conversion lift from these solutions is a prerequisite to unlocking incremental advertiser budgets.
FX and international exposure
Revenue earned abroad exposes Snap to FX translation risk; Snap reported full-year 2023 revenue of $4.59 billion, so dollar strength can materially compress reported growth and margins when non‑USD markets weaken. Hedging programs reduce volatility but introduce incremental costs and operational complexity that pressured gross margins in recent quarters. Localized go‑to‑market and pricing in local currencies help balance currency swings and sustain user and advertiser growth.
Cost structure and scalability
Cloud, AI compute, and content-moderation costs are major variable drivers for Snap; FY2024 revenue was about $5.8B, pressuring gross margin until infrastructure efficiencies scale. On-device ML and efficient CDN/hosting reduced incremental cost-per-user, helping gross margin recovery. Headcount cuts since 2023 and automation improve operating leverage. Hardware experiments like Spectacles require capital-light partnerships to avoid margin drag.
- Cloud/AI: variable COGS
- On-device ML: margin lift
- Headcount discipline: opex leverage
- Spectacles: capital-light required
SMB advertiser health
SMB advertisers are a key growth engine for Snap but remain vulnerable to rate and demand shocks; US SMBs employ about 47% of the private workforce (SBA). Credit conditions and CAC payback windows largely determine spend resilience, while easy self-serve tools and flexible budgets improve stickiness and churn. Targeted education and case studies lift SMB adoption across cycles.
- SMB importance: 47% private employment
- Resilience: tied to credit/CAC payback
- Retention: self-serve + flexible budgets
- Growth: education and case studies
EU DSA 6%, GDPR €3.8bn push social app to lift compliance
Snap (≈363M DAU) revenue: $4.59B (2023), ≈$5.8B (FY2024); ad budgets track GDP so downturns and dollar strength compress growth/margins. ATT cut iOS opt‑ins to ~25–30% and eCPMs fell ≈30%, increasing need for privacy‑safe measurement. Cloud/AI costs raise COGS; SMBs (~47% private employment) remain credit‑sensitive.
| Metric | Value |
|---|---|
| DAUs | ≈363M |
| Revenue 2023 | $4.59B |
| Revenue FY2024 | ≈$5.8B |
| iOS opt‑in | 25–30% |
| eCPM impact | ≈-30% |
| SMB employment | ≈47% |
What You See Is What You Get
Snap PESTLE Analysis
The preview shown here is the exact Snap PESTLE Analysis you’ll receive after purchase—fully formatted and ready to use. It covers political, economic, social, technological, legal, and environmental factors relevant to Snap, with actionable insights and structured findings. No placeholders or teasers; this is the final file you can download instantly after checkout.











