Sierra Nevada Boston Consulting Group Matrix

Unlock Strategic Clarity
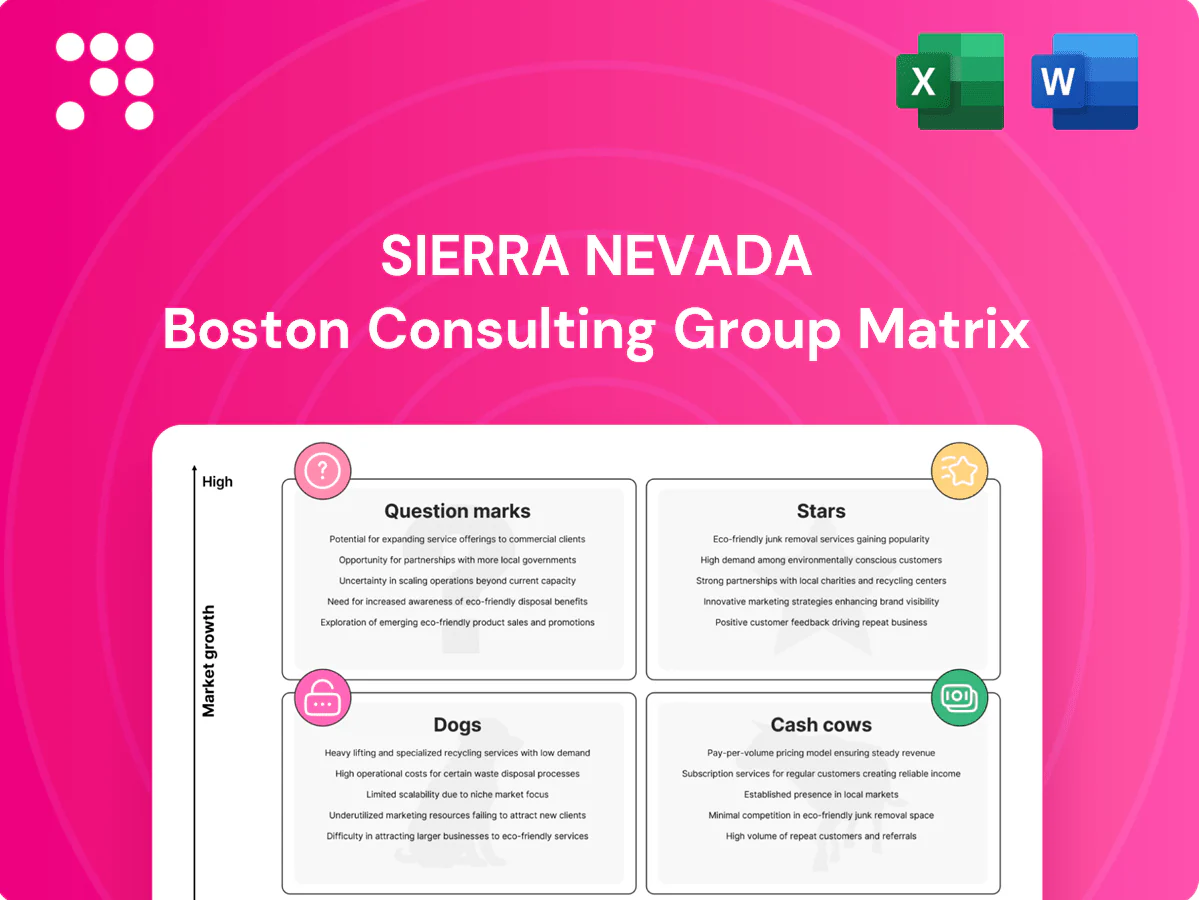
Curious where Sierra Nevada’s products land—Stars, Cash Cows, Dogs, or Question Marks? This snapshot teases the picture; buy the full BCG Matrix to get quadrant-by-quadrant placements, data-backed recommendations, and a ready-to-use Word report plus an Excel summary. Skip the guesswork—purchase now for strategic clarity and a practical roadmap to allocate capital and prioritize growth.
Stars

National security ISR and comms integration
National security ISR and comms integration holds high market share with programs that continue to be renewed, supported by the US DoD FY2024 budget of about $858 billion; mission‑critical systems secure funding even in tight years. These platforms require cash for upgrades, testing and cybersecurity but the position is defendable; keep investing to lock leadership as demand remains strong.
Electronic warfare and mission systems
Contested domains are the new normal: the global electronic warfare market is growing (estimated CAGR ~6.6% 2024–2028) while the US 2024 defense topline reached about $858 billion, underpinning sustained demand.
SNC’s proven systems-integration track record and stacked mission-systems wins give it a competitive edge in delivering multi-domain EW capabilities.
Engineering burn is high, but strategic value and procurement momentum justify funding the roadmap and aggressively capturing adjacent ISR and cyber-electromagnetic use cases before rivals do.

Responsive space systems and payloads
Government and primes demand faster turns and modularity; SNC’s build‑to‑mission model aligns with that shift, supported by Dream Chaser CRS‑2 work (approx $1.4B) and growing DoD space budgets (~$24.5B for US Space Force in FY2024). Pipeline is expanding into orbital services and sensor payloads, but capital intensity is high—facilities, talent, and iterative test cycles require heavy cash. Doubling down now can cement category ownership as the responsive‑space market scales.

Secure command, control, and ground architecture
Secure command, control, and ground architecture is maturing but on the upswing as hardened networks proliferate; global tactical communications market projected CAGR ~6% to 2030 (2024 forecasts).
Sierra Nevada sits close to mission with high switching costs and long accreditation cycles (often 12–18 months) that consume capital.
DoD FY2024 budget ~842 billion USD underpins procurement; keep scaling—platforms can convert to durable annuities via multi-year sustainment.
- High switching costs: mission integration advantage
- Accreditation cycles: commonly 12–18 months, capital intensive
- Market tailwinds: DoD FY2024 ~$842B; tactical comms CAGR ~6% (2024 forecasts)
Special mission aircraft modernization
Special mission aircraft modernization is a Star: defense customers prefer retrofits over replacements as FY2024 US defense discretionary funding reached about 858 billion, keeping demand brisk; Sierra Nevada Corporation’s proven systems-integration and certification record wins competitive bids; programs are capital-intensive but sustain healthy margins with scope; invest to expand capacity and shorten turn times.
- Market: retrofit demand driven by FY2024 $858B US defense spend
- Strength: SNC integration & certification track record
- Challenge: high capital intensity, complex programs
- Action: invest in capacity to reduce lead times
ISR/comms leader - DoD tailwinds and modular wins; scale to capture ~6% tactical comms CAGR
Stars: SNC holds high share in ISR/comms and special-mission retrofit markets; sustained DoD tailwinds (US FY2024 ~858B USD) and modular, cert-driven wins justify continued investment. Programs are capital- and engineering-intensive with 12–18 month accreditation cycles; tactical comms CAGR ~6%—scale to shorten lead times and lock annuities.
| Metric | Value |
|---|---|
| DoD FY2024 | ~858B USD |
| Accreditation | 12–18 months |
| Tactical comms CAGR | ~6% (2024 forecasts) |
| Dream Chaser CRS‑2 | ~1.4B |
What is included in the product
 Detailed Word Document
Comprehensive BCG analysis of Sierra Nevada’s product portfolio, pinpointing Stars, Cash Cows, Question Marks and Dogs and investment moves.

 Customizable Excel Spreadsheet
One-page Sierra Nevada BCG Matrix aligning units by growth/share — quick clarity for exec decisions and presentations.
Cash Cows

Lifecycle support and sustainment contracts
Lifecycle support and sustainment contracts sit on a large installed base with predictable task orders and modest growth, delivering high utilization and steady margins while requiring low marketing spend.
These cash cows reliably fund R&D, provided SLAs are maintained and workflows automated to reduce operations cost.
Operate quietly to milk recurring revenue streams and reinvest into next-gen capabilities.
Legacy surveillance and comms refreshes
Legacy surveillance and comms refreshes are steady cash cows with predictable replace/upgrade cycles across a mature footprint, driving recurring service and retrofit revenues. Competitive moats stem from accreditation, certified interfaces and spares logistics that raise switching costs; the US defense budget in 2024 was about $858 billion, sustaining legacy refresh procurement. Limited upside but low risk—optimize inventory turns and spares provisioning to free working capital and keep cash flowing.

Ground stations O&M and software support
Ground stations O&M and software support deliver stable accounts with minimal churn and incremental enhancements only, showing renewal rates around 90% in 2024 and contract horizons typically 3–7 years. Revenue is sticky with long billing tails; capex intensity is low—annual capex often below 10% of revenue—and working capital remains manageable. Focus on squeezing operational efficiency and preserving the installed base to protect margins.

Training, documentation, and field services
Training, documentation, and field services are cash cows: attach rates rise above 70% once systems are deployed and recurring revenue sustains margins; 2024 benchmarks show comparable field-service EBITDA margins around 20–25%. Utilization is the game—optimize crew hours rather than over‑investing in capacity. Price discipline and standardized crews drive predictable margin, not feature races.
- Attach rate: >70% (2024 benchmark)
- EBITDA margin: 20–25% (2024)
- Focus: utilization over capex
- Strategy: price discipline + standardized crews
Secure hardware spares and depot services
Secure hardware spares, repairs and certified depot work generate steady cash for Sierra Nevada, with defense aftermarket services typically delivering double-digit operating margins and high contract renewal rates in 2024. Market growth is modest but recurring contracts sustain revenue; disciplined forecasting and supply-chain controls preserved margins in 2024. Keep it lean, keep it reliable.
- Parts & depot: steady cash
- 2024: double-digit margins
- High contract renewals
- Forecasting & supply discipline
Lifecycle sustainment: steady margins, ~90% renewals, capex under 10% - optimize ops
Lifecycle support and sustainment contracts sit on a large installed base with predictable task orders, funding R&D and yielding steady margins; US defense budget ~858B in 2024 sustains legacy refreshes.
Ground stations O&M and software support show ~90% renewal rates in 2024, capex <10% of revenue and sticky billing tails—focus on operational efficiency.
Training, field services and depot parts deliver attach rates >70% and EBITDA 20–25% in 2024; optimize inventory and crew utilization to free cash.
| Metric | 2024 |
|---|---|
| US defense budget | 858B |
| Renewal rate | ~90% |
| Attach rate | >70% |
| EBITDA margin | 20–25% |
| Capex | <10% rev |
Delivered as Shown
Sierra Nevada BCG Matrix
The file you’re previewing is the exact Sierra Nevada BCG Matrix report you’ll receive after purchase. No watermarks, no demo content—just a fully formatted, ready-to-use analysis built for strategic clarity. Once bought, the full document is instantly downloadable, editable, and presentation-ready. Crafted by strategy pros, it fits straight into your planning, decks, or client work.

Unlock Strategic Clarity
Curious where Sierra Nevada’s products land—Stars, Cash Cows, Dogs, or Question Marks? This snapshot teases the picture; buy the full BCG Matrix to get quadrant-by-quadrant placements, data-backed recommendations, and a ready-to-use Word report plus an Excel summary. Skip the guesswork—purchase now for strategic clarity and a practical roadmap to allocate capital and prioritize growth.
Stars
National security ISR and comms integration
National security ISR and comms integration holds high market share with programs that continue to be renewed, supported by the US DoD FY2024 budget of about $858 billion; mission‑critical systems secure funding even in tight years. These platforms require cash for upgrades, testing and cybersecurity but the position is defendable; keep investing to lock leadership as demand remains strong.
Electronic warfare and mission systems
Contested domains are the new normal: the global electronic warfare market is growing (estimated CAGR ~6.6% 2024–2028) while the US 2024 defense topline reached about $858 billion, underpinning sustained demand.
SNC’s proven systems-integration track record and stacked mission-systems wins give it a competitive edge in delivering multi-domain EW capabilities.
Engineering burn is high, but strategic value and procurement momentum justify funding the roadmap and aggressively capturing adjacent ISR and cyber-electromagnetic use cases before rivals do.
Responsive space systems and payloads
Government and primes demand faster turns and modularity; SNC’s build‑to‑mission model aligns with that shift, supported by Dream Chaser CRS‑2 work (approx $1.4B) and growing DoD space budgets (~$24.5B for US Space Force in FY2024). Pipeline is expanding into orbital services and sensor payloads, but capital intensity is high—facilities, talent, and iterative test cycles require heavy cash. Doubling down now can cement category ownership as the responsive‑space market scales.
Secure command, control, and ground architecture
Secure command, control, and ground architecture is maturing but on the upswing as hardened networks proliferate; global tactical communications market projected CAGR ~6% to 2030 (2024 forecasts).
Sierra Nevada sits close to mission with high switching costs and long accreditation cycles (often 12–18 months) that consume capital.
DoD FY2024 budget ~842 billion USD underpins procurement; keep scaling—platforms can convert to durable annuities via multi-year sustainment.
- High switching costs: mission integration advantage
- Accreditation cycles: commonly 12–18 months, capital intensive
- Market tailwinds: DoD FY2024 ~$842B; tactical comms CAGR ~6% (2024 forecasts)
Special mission aircraft modernization
Special mission aircraft modernization is a Star: defense customers prefer retrofits over replacements as FY2024 US defense discretionary funding reached about 858 billion, keeping demand brisk; Sierra Nevada Corporation’s proven systems-integration and certification record wins competitive bids; programs are capital-intensive but sustain healthy margins with scope; invest to expand capacity and shorten turn times.
- Market: retrofit demand driven by FY2024 $858B US defense spend
- Strength: SNC integration & certification track record
- Challenge: high capital intensity, complex programs
- Action: invest in capacity to reduce lead times
ISR/comms leader - DoD tailwinds and modular wins; scale to capture ~6% tactical comms CAGR
Stars: SNC holds high share in ISR/comms and special-mission retrofit markets; sustained DoD tailwinds (US FY2024 ~858B USD) and modular, cert-driven wins justify continued investment. Programs are capital- and engineering-intensive with 12–18 month accreditation cycles; tactical comms CAGR ~6%—scale to shorten lead times and lock annuities.
| Metric | Value |
|---|---|
| DoD FY2024 | ~858B USD |
| Accreditation | 12–18 months |
| Tactical comms CAGR | ~6% (2024 forecasts) |
| Dream Chaser CRS‑2 | ~1.4B |
What is included in the product
Detailed Word Document
Comprehensive BCG analysis of Sierra Nevada’s product portfolio, pinpointing Stars, Cash Cows, Question Marks and Dogs and investment moves.
Customizable Excel Spreadsheet
One-page Sierra Nevada BCG Matrix aligning units by growth/share — quick clarity for exec decisions and presentations.
Cash Cows
Lifecycle support and sustainment contracts
Lifecycle support and sustainment contracts sit on a large installed base with predictable task orders and modest growth, delivering high utilization and steady margins while requiring low marketing spend.
These cash cows reliably fund R&D, provided SLAs are maintained and workflows automated to reduce operations cost.
Operate quietly to milk recurring revenue streams and reinvest into next-gen capabilities.
Legacy surveillance and comms refreshes
Legacy surveillance and comms refreshes are steady cash cows with predictable replace/upgrade cycles across a mature footprint, driving recurring service and retrofit revenues. Competitive moats stem from accreditation, certified interfaces and spares logistics that raise switching costs; the US defense budget in 2024 was about $858 billion, sustaining legacy refresh procurement. Limited upside but low risk—optimize inventory turns and spares provisioning to free working capital and keep cash flowing.
Ground stations O&M and software support
Ground stations O&M and software support deliver stable accounts with minimal churn and incremental enhancements only, showing renewal rates around 90% in 2024 and contract horizons typically 3–7 years. Revenue is sticky with long billing tails; capex intensity is low—annual capex often below 10% of revenue—and working capital remains manageable. Focus on squeezing operational efficiency and preserving the installed base to protect margins.
Training, documentation, and field services
Training, documentation, and field services are cash cows: attach rates rise above 70% once systems are deployed and recurring revenue sustains margins; 2024 benchmarks show comparable field-service EBITDA margins around 20–25%. Utilization is the game—optimize crew hours rather than over‑investing in capacity. Price discipline and standardized crews drive predictable margin, not feature races.
- Attach rate: >70% (2024 benchmark)
- EBITDA margin: 20–25% (2024)
- Focus: utilization over capex
- Strategy: price discipline + standardized crews
Secure hardware spares and depot services
Secure hardware spares, repairs and certified depot work generate steady cash for Sierra Nevada, with defense aftermarket services typically delivering double-digit operating margins and high contract renewal rates in 2024. Market growth is modest but recurring contracts sustain revenue; disciplined forecasting and supply-chain controls preserved margins in 2024. Keep it lean, keep it reliable.
- Parts & depot: steady cash
- 2024: double-digit margins
- High contract renewals
- Forecasting & supply discipline
Lifecycle sustainment: steady margins, ~90% renewals, capex under 10% - optimize ops
Lifecycle support and sustainment contracts sit on a large installed base with predictable task orders, funding R&D and yielding steady margins; US defense budget ~858B in 2024 sustains legacy refreshes.
Ground stations O&M and software support show ~90% renewal rates in 2024, capex <10% of revenue and sticky billing tails—focus on operational efficiency.
Training, field services and depot parts deliver attach rates >70% and EBITDA 20–25% in 2024; optimize inventory and crew utilization to free cash.
| Metric | 2024 |
|---|---|
| US defense budget | 858B |
| Renewal rate | ~90% |
| Attach rate | >70% |
| EBITDA margin | 20–25% |
| Capex | <10% rev |
Delivered as Shown
Sierra Nevada BCG Matrix
The file you’re previewing is the exact Sierra Nevada BCG Matrix report you’ll receive after purchase. No watermarks, no demo content—just a fully formatted, ready-to-use analysis built for strategic clarity. Once bought, the full document is instantly downloadable, editable, and presentation-ready. Crafted by strategy pros, it fits straight into your planning, decks, or client work.
Description
Unlock Strategic Clarity
Curious where Sierra Nevada’s products land—Stars, Cash Cows, Dogs, or Question Marks? This snapshot teases the picture; buy the full BCG Matrix to get quadrant-by-quadrant placements, data-backed recommendations, and a ready-to-use Word report plus an Excel summary. Skip the guesswork—purchase now for strategic clarity and a practical roadmap to allocate capital and prioritize growth.
Stars
National security ISR and comms integration
National security ISR and comms integration holds high market share with programs that continue to be renewed, supported by the US DoD FY2024 budget of about $858 billion; mission‑critical systems secure funding even in tight years. These platforms require cash for upgrades, testing and cybersecurity but the position is defendable; keep investing to lock leadership as demand remains strong.
Electronic warfare and mission systems
Contested domains are the new normal: the global electronic warfare market is growing (estimated CAGR ~6.6% 2024–2028) while the US 2024 defense topline reached about $858 billion, underpinning sustained demand.
SNC’s proven systems-integration track record and stacked mission-systems wins give it a competitive edge in delivering multi-domain EW capabilities.
Engineering burn is high, but strategic value and procurement momentum justify funding the roadmap and aggressively capturing adjacent ISR and cyber-electromagnetic use cases before rivals do.
Responsive space systems and payloads
Government and primes demand faster turns and modularity; SNC’s build‑to‑mission model aligns with that shift, supported by Dream Chaser CRS‑2 work (approx $1.4B) and growing DoD space budgets (~$24.5B for US Space Force in FY2024). Pipeline is expanding into orbital services and sensor payloads, but capital intensity is high—facilities, talent, and iterative test cycles require heavy cash. Doubling down now can cement category ownership as the responsive‑space market scales.
Secure command, control, and ground architecture
Secure command, control, and ground architecture is maturing but on the upswing as hardened networks proliferate; global tactical communications market projected CAGR ~6% to 2030 (2024 forecasts).
Sierra Nevada sits close to mission with high switching costs and long accreditation cycles (often 12–18 months) that consume capital.
DoD FY2024 budget ~842 billion USD underpins procurement; keep scaling—platforms can convert to durable annuities via multi-year sustainment.
- High switching costs: mission integration advantage
- Accreditation cycles: commonly 12–18 months, capital intensive
- Market tailwinds: DoD FY2024 ~$842B; tactical comms CAGR ~6% (2024 forecasts)
Special mission aircraft modernization
Special mission aircraft modernization is a Star: defense customers prefer retrofits over replacements as FY2024 US defense discretionary funding reached about 858 billion, keeping demand brisk; Sierra Nevada Corporation’s proven systems-integration and certification record wins competitive bids; programs are capital-intensive but sustain healthy margins with scope; invest to expand capacity and shorten turn times.
- Market: retrofit demand driven by FY2024 $858B US defense spend
- Strength: SNC integration & certification track record
- Challenge: high capital intensity, complex programs
- Action: invest in capacity to reduce lead times
ISR/comms leader - DoD tailwinds and modular wins; scale to capture ~6% tactical comms CAGR
Stars: SNC holds high share in ISR/comms and special-mission retrofit markets; sustained DoD tailwinds (US FY2024 ~858B USD) and modular, cert-driven wins justify continued investment. Programs are capital- and engineering-intensive with 12–18 month accreditation cycles; tactical comms CAGR ~6%—scale to shorten lead times and lock annuities.
| Metric | Value |
|---|---|
| DoD FY2024 | ~858B USD |
| Accreditation | 12–18 months |
| Tactical comms CAGR | ~6% (2024 forecasts) |
| Dream Chaser CRS‑2 | ~1.4B |
What is included in the product
Detailed Word Document
Comprehensive BCG analysis of Sierra Nevada’s product portfolio, pinpointing Stars, Cash Cows, Question Marks and Dogs and investment moves.
Customizable Excel Spreadsheet
One-page Sierra Nevada BCG Matrix aligning units by growth/share — quick clarity for exec decisions and presentations.
Cash Cows
Lifecycle support and sustainment contracts
Lifecycle support and sustainment contracts sit on a large installed base with predictable task orders and modest growth, delivering high utilization and steady margins while requiring low marketing spend.
These cash cows reliably fund R&D, provided SLAs are maintained and workflows automated to reduce operations cost.
Operate quietly to milk recurring revenue streams and reinvest into next-gen capabilities.
Legacy surveillance and comms refreshes
Legacy surveillance and comms refreshes are steady cash cows with predictable replace/upgrade cycles across a mature footprint, driving recurring service and retrofit revenues. Competitive moats stem from accreditation, certified interfaces and spares logistics that raise switching costs; the US defense budget in 2024 was about $858 billion, sustaining legacy refresh procurement. Limited upside but low risk—optimize inventory turns and spares provisioning to free working capital and keep cash flowing.
Ground stations O&M and software support
Ground stations O&M and software support deliver stable accounts with minimal churn and incremental enhancements only, showing renewal rates around 90% in 2024 and contract horizons typically 3–7 years. Revenue is sticky with long billing tails; capex intensity is low—annual capex often below 10% of revenue—and working capital remains manageable. Focus on squeezing operational efficiency and preserving the installed base to protect margins.
Training, documentation, and field services
Training, documentation, and field services are cash cows: attach rates rise above 70% once systems are deployed and recurring revenue sustains margins; 2024 benchmarks show comparable field-service EBITDA margins around 20–25%. Utilization is the game—optimize crew hours rather than over‑investing in capacity. Price discipline and standardized crews drive predictable margin, not feature races.
- Attach rate: >70% (2024 benchmark)
- EBITDA margin: 20–25% (2024)
- Focus: utilization over capex
- Strategy: price discipline + standardized crews
Secure hardware spares and depot services
Secure hardware spares, repairs and certified depot work generate steady cash for Sierra Nevada, with defense aftermarket services typically delivering double-digit operating margins and high contract renewal rates in 2024. Market growth is modest but recurring contracts sustain revenue; disciplined forecasting and supply-chain controls preserved margins in 2024. Keep it lean, keep it reliable.
- Parts & depot: steady cash
- 2024: double-digit margins
- High contract renewals
- Forecasting & supply discipline
Lifecycle sustainment: steady margins, ~90% renewals, capex under 10% - optimize ops
Lifecycle support and sustainment contracts sit on a large installed base with predictable task orders, funding R&D and yielding steady margins; US defense budget ~858B in 2024 sustains legacy refreshes.
Ground stations O&M and software support show ~90% renewal rates in 2024, capex <10% of revenue and sticky billing tails—focus on operational efficiency.
Training, field services and depot parts deliver attach rates >70% and EBITDA 20–25% in 2024; optimize inventory and crew utilization to free cash.
| Metric | 2024 |
|---|---|
| US defense budget | 858B |
| Renewal rate | ~90% |
| Attach rate | >70% |
| EBITDA margin | 20–25% |
| Capex | <10% rev |
Delivered as Shown
Sierra Nevada BCG Matrix
The file you’re previewing is the exact Sierra Nevada BCG Matrix report you’ll receive after purchase. No watermarks, no demo content—just a fully formatted, ready-to-use analysis built for strategic clarity. Once bought, the full document is instantly downloadable, editable, and presentation-ready. Crafted by strategy pros, it fits straight into your planning, decks, or client work.











